


Testing secondary clarifiers to understand installed and theoretical capacity

First published in Water e-Journal Vol 6 No 4 2021.
Learning to identify and address any limitations of each secondary clarifier through full scale testing.
DOWNLOAD THE PAPER
Executive Summary
Full scale testing of secondary clarifiers was completed using the WERF Protocol for Evaluating Secondary Clarifier Performance (WERF/CTRC (2001)). The project purpose was to understand the installed capacity as compared to the theoretical capacity of the secondary clarifiers and to identify the constraining elements of each secondary clarifier. Identification of the limiting element of each clarifier enabled retrofits to be tailored to the clarifier, with a focus on minimising the works required to maximise the installed capacity of the clarifiers. This included the investigation of addition of polyelectrolyte to extend the clarifier capacity in certain (i.e. wet weather) situations. A large range of installed to theoretical clarifier capacities was found supporting the need to assess clarifiers in situ to understand their true capacity. Polyelectrolyte was found to enhance the capacity in some (but not all) clarifiers tested, depending on the particular limitations. Other relatively minor retrofits, for example the installation of stamford baffles, and adjustment of the launder configuration, were recommended to unlock latent capacities.
Introduction
Increasing populations, aging infrastructure and increased frequency and magnitude of rainfall events puts pressure on plant owners, managers and operators to achieve the required treatment capabilities under a range of increasingly difficult conditions. In many cases, secondary clarification capacity is identified through theoretical calculations (and operational observations) as the limiting plant process. However, the full scale installed secondary clarifier capacity is often very different in practice compared to the theoretical capacity, and the limiting function/s are often unknown. Understanding the installed capacity and limitations of each clarifier enables the utility to fully utilise the asset, maintain licence compliance and accurately plan for future upgrades.
In design, a secondary clarifier’s calculated capacity is usually derated by a factor to account for full scale non-idealities, termed the “design factor”, which is typically applied at around 0.75 – 0.85 (depending on the clarifier side wall depth, (Ekama et al. (2004)), to calculate the theoretical capacity. However in practice, design factors, as determined through comparison of stress testing results to the flux model, are known to vary substantially. Clarifier features not considered within the flux model, such as side water depth, launder design, inlet configuration, flocculation skirt size, and sludge removal configuration, are known to influence the design factor. Derivation of the installed design factor through insitu testing enables estimates of the true installed capacity based on solids settling to be developed.
Once the installed clarifier capacity and limiting conditions are identified, the clarifier limitation can be specifically addressed. This may mean adjustments to clarifier feed flow splitting arrangement (to ensure a more proportionate feed split relative to each clarifier’s installed capacity), RAS upgrades, adjustments to the mechanical structures such as the feed well and flocculation chamber, or changes to the effluent launder. In some cases, the use of polyelectrolyte to extend the clarifier’s performance under wet weather conditions may be useful. Addressing the specific limitation provides the opportunity for utilities to minimise capital outlay when compared to the construction of additional clarifier capacity. Should the requirement for a major upgrade be identified, knowledge of the installed clarifier capacity allows for accurate programming of major works to optimise spend and treatment requirements.
Whilst a reasonable investment in time and expenditure is involved in this form of testing, the outcomes in terms of plant improvements and savings in infrastructure investment are potentially significant, making the study a worthwhile exercise.
This paper presents experience gained and lessons learned in assessing a number of sites using the WERF Protocol for Evaluating Secondary Clarifier Performance (WERF/CTRC (2001)).
Method
Full scale test work has been completed across a number of sites with various clarifier dimensions, internal mechanisms and feed structures.
The method utilised followed the Water Environment Research Foundation (WERF/CTRC (2001)) protocol which separates testing into two key elements of:
- State of flocculation testing
- Clarifier “stress testing”
In this way, the individual aspects of each clarifier’s performance were assessed, with limitations outlined, and where possible, bespoke outcomes devised to address the identified limitations.
Methodology: State of Flocculation Testing
State of focculation testing was employed following the WERF protocol. (WERF/CTRC (2001)). This method involves sampling of clarifier effluent immediately below the launder and from the central feed well. These results are analysed for total suspended solids (TSS) and compared to the supernatant of laboratory flocculated and settled mixed liquor (which is taken to represent the best possible flocculation state for the given mixed liquor at that time).
As it is the flocculation performance during dry weather which generally dominates secondary effluent compliance, flocculation sampling was undertaken under dry weather flow conditions. Samples of all parameters were collected at least three times to allow for averaging of results and removal of outliers associated with the sampling. A Van Doorn sampler was utilised to enable sample collection, settling and subsequent supernatant extraction to be undertaken in the one cylinder, therefore minimising the impacts of floc aggregation and breakup. Note a Kemmerer sampler is recommended in the protocol, but was unavailable at the time of sampling. A Kemmerer and Van Doorn sampler are shown in Figure 1. The parameters used in flocculation testing are described below and summarised in Table 1.

Figure 1: Kemmerer (left, vertical arrangement) and Van Doorn (right, horizontal arrangement) sampler
Flocculated Suspended Solids (FSS)
- FSS represents the secondary effluent TSS which could be achieved if the clarifier feed were optimally flocculated and the flow through the secondary clarifier hydraulically ideal.
- FSS was measured by subjecting a mixed liquor sample to controlled flocculation in a jar testing apparatus (30 minutes, 50 rpm), allowing the solids to settle, and then determining the solids concentration in the supernatant.
- Should the FSS value be greater than 10mg/L, this is taken as poor flocculating biomass, reflecting process limitations within the plant with a recommendation to investigate potential causes within the STP (such as sludge age and aeration parameters).
Influent Dispersed Suspended Solids (iDSS)
- Influent DSS (iDSS) provides an indication of the flocculation ability of the clarifier, at the time of sampling.
- This sample was taken with the van Doorn sampler from the flocculation zone of each clarifier tested. The sample was allowed to settle for 30 minutes within the sampler, at which time supernatant was drawn from the top portion of the sampler vessel.
Effluent Dispersed Suspended Solids (eDSS)
- This sample represents the dispersed solids remaining in the effluent.
- Effluent DSS (eDSS) was taken approximately 30cm below the clarifier launder level, using the van Doorn sampler. The sample was allowed to settle for 30 minutes, with the supernatant removed for analysis.
Effluent Suspended Solids (ESS)
- The ESS sample was taken approximately 30cm below the launder level, by utilising the van Doorn sampler. The sample was not settled, but rather taken directly for analysis. This represents the clarifier performance during the test period.
The guidelines for assessing the flocculation performance are summarised in Table 2 (WERF/CTRC, 2001), and involve the assessment of the clarifier influent and effluent dispersed suspended solids (DSS) parameters taken against the flocculated suspended solids (FSS) value, which represents the best flocculation state of the biomass at the site at the time tested.
|
Test |
Sample Location |
Sample treatment (for TSS) |
|
Clarifier Influent FSS |
Mixed Liquor, Bioreactor |
Flocculation, settling in laboratory. Supernatant tested. |
|
Clarifier Influent iDSS |
Clarifier Influent, Flocculation Zone |
Settling in sampler. Supernatant tested. |
|
Clarifier Supernatant eDSS |
Clarifier Effluent, below launder |
Settling in sampler. Supernatant tested. |
|
Clarifier Supernatant ESS |
Clarifier Effluent, below launder |
Sample direct from launder |
|
Parameter |
Additional requirement |
Flocculation indication |
Hydraulic indication |
Process indication |
|
iDSS ≥ eDSS |
eDSS = FSS = ESS |
|
|
|
|
eDSS>FSS |
eDSS = ESS |
|
|
|
|
eDSS = FSS |
eDSS < ESS |
|
|
|
|
eDSS > FSS |
eDSS < ESS |
|
|
|
|
FSS >10mg/L |
|
|
|
|
indicates acceptable performance, indicates poor performance, requires investigation
Methodology: Clarifier "stress" testing
The WERF protocol for assessing clarifier performance was utilised as a basis for clarifier assessment (WERF/CTRC. (2001).
Boundary definition
Specific plant boundaries for aborting the test were developed in conjunction with the plant operators and considered items such as:- Maximum sludge blanket height
- Maximum sustained plant influent flow
- Wet weather definition
- High effluent turbidity or TSS
- Hydraulic constraints
- Recycled Activated Sludge (RAS) Mixed Liquor suspended solids (MLSS) range (particularly if poly dosing)
- Sludge volume index (SVI) range (before another stirred sludge volume index (sSVI) test is required)
- Redundancy requirements (i.e RAS pumps, additional clarifier operation, power, system control and data acquisition (SCADA))
State point analysis, definition of test load to be applied
Settleability parameters for the plant at the time of the test were determined by the performance of a sSVI test. The sSVI test involves monitoring the interface settling velocity of mixed liquor and RAS, diluted to various concentrations. The most commonly used relationship is the Vesilind equation:
Vs = Voexp−kX
Where:
Vs = interface settling velocity (m/h)
X = solids concentration (kg/m3)
Vo = sludge specific settling parameter (m/h)
k= sludge specific settling parameter (m3/kg)
Vesilind settling parameters (Vo, k) are estimated by fiting the Vesilind equation to the interface settling velocity data by minimising the sum of squared errors. These results then support the development of solids flux curve for the biomass by the following equation:
G = XVs = XVoexp−kX
Where:
G = solids flux (kg/m2.h)
X = solids concentration (kg/m3)
Vs = interface settling velocity (m/h)
Vo = sludge specific settling parameter (m/h)
k = sludge specific settling parameter (m3/kg)
The overflow rate, representing the clarifier feed, is defined as:
G = X ∗ 1000 (G ⁄ A)
Where:
G = solids flux (kg/m2.h)
X = solids concentration (mg/L)
Q = clarifier effluent flow (m3/h)
A = total clarifier surface area (m2)
The underflow rate, representing the RAS, is defined as:
G = (1000 ⁄ A) ∗ (Q ∗ X<L + QRAS (XML - X))
G = solids flux (kg/m2.h)
A = total clarifier surface area (m2)
Q = clarifier effluent flow (m3/h)
XML = MLSS concentration (mg/L)
QRAS = Return activated sludge flow (m3/h)
X = solids concentration (mg/L)
Figure 2 shows an example of state point analysis for a specific plant, which was developed and assessed to identify (in conjunction with the plant operators) the initial loading conditions (in terms of clarifier feed flow, load and RAS return) for the stress test. The settling flux curve represents the maximum theoretical solids flux which may be applied at various MLSS concentrations. The intersection of the red, green and blue lines represents the installed operating point of the clarifier (or state point). The ratio of the state point flux to the settling flux represents the design factor applied in the test.
Clarification failure occurs where the hydraulic load on a clarifier results in an upflow velocity over the clarifier area which exceeds the rate at which the mixed liquor solids in the clarifier settle. Thickening failure occurs when more solids are applied to the clarifier than can be transferred to the bottom of the tank by settling, and removed via the return activated sludge flow. This results in accumulation of solids in the clarifier, forming a sludge blanket. If this overloaded condition continues, the sludge blanket reaches a level where solids are lost over the clarifier weirs.
The clarifier is underloaded with respect to thickening if the underflow rate operating line passes below the descending limb of the settling flux curve (intersects the curve just once). The clarifier is overloaded with respect to thickening if the underflow rate operating line passes above the descending limb of the settling flux curve (intersects the curve three times if the state point is within the envelope defined by the settling flux curve). The clarifier is critically loaded with respect to thickening if the underflow rate operating line is just tangential to the settling flux curve (intersects the curve twice). The clarifier is underloaded with respect to clarification if the overflow line intersects the operating MLSS under the settling flux curve.
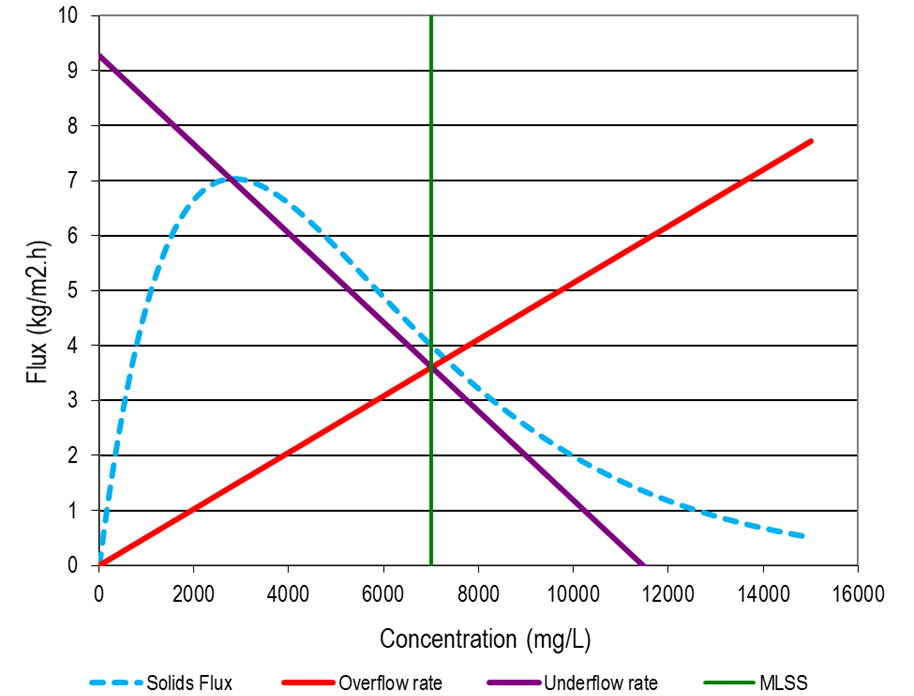 Figure 2: Example State Point Analysis chart, showing example theoretical to applied flux during stress testing
Maintaining test conditions
The agreed test condition (clarifier feed flow, clarifier feed load – via MLSS concentration, and RAS flow) was consistently maintained for three hydraulic residence times (HRTs) to achieve steady state, in accordance with the protocol. Monitoring of the clarifier (effluent turbidity, sludge blanket) at 30 minute intervals was conducted throughout this time. If a critical ‘stress test’ level was not obtained (by reaching the limit of clarifier performance before either clarification or thickening failure was deemed imminent) the test was re-run until the maximum operating point was found.
For the purposes of the test, clarification failure was considered when the agreed boundary turbidity conditions were met for an extended (1 hour, two test results) period of time. Thickening failure was deemed to occur when the sludge blanket exceeded the agreed maximum sludge blanket level for more than 1 hour.
Methodology: utilising polyelectrolyte to enhance clarifier performance
To assess the potential benefit of polyelectrolyte dosing on clarifier performance, full scale dosing of polyelectrolyte was employed. Stress testing of clarifiers with and without poly dosing was conducted to assess the relative gain to plant capacity by utilising poly during certain conditions (for example, during wet weather).
Jar testing of the polyelectrolyte type and dose rate was identified as critical to ensure the correct polyelectrolyte type and dose rate was selected. For the instances studied, a poly dose rate in the order of 0.5- 1kg/dt was found to be effective. Design of a polyelectrolyte dosing system to ensure effective flocculation and that the developed floc structure was not destroyed by subsequent downstream structures (for example as flow passes through weirs) was required.
The stress test as defined above was then replicated with the addition of polyelectrolyte at the specified dose rate. The relative benefit of polyelectrolyte dosing against the control (without dosing) was then compared.
Results
Results: State of flocculation testing
By comparison of the various test results, as per the WERF guidelines state of flocculation, was categorised as:
- Not limiting (good flocculation observed at peak expected)
- Hydraulically limited
- Flocculation limited
- Process limited
Augmentations were considered to address specific limitations as shown in Table 3.
|
Limitation indication |
Design aspects for review |
|
Hydraulically limited |
Review outlet port configuration Review feed structure |
|
Flocculation limited |
Review feed structure Review clarifier internal mechanisms |
|
Process limited |
Consider sludge age adjustments Review aeration configuration |
Results: Clarifier "stress" testing
Figure 3 highlights the monitoring of the sludge blanket of a test clarifier in an instance where the loading exceeded the agreed test boundary of maximum sludge blanket depth, and the test was aborted. Figure 4 shows an example of a clarifer at maximum loading conditions, where the sludge blanket had achieved steady state at the agreed maximum level. Note also the time requirement to achieve the steady state conditions for loading the clarifier, approaching 12 hours (which in this case represented the requisite three HRTs as required by the guideline).
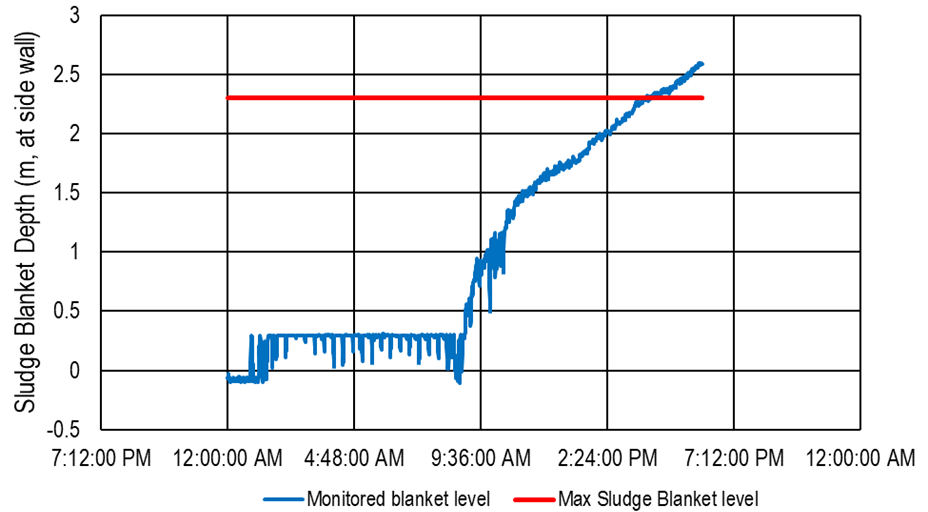
Figure 3: Example of clarifier failure during stress testing (red line showing the agreed test boundary, representing the maximum sludge blanket depth)
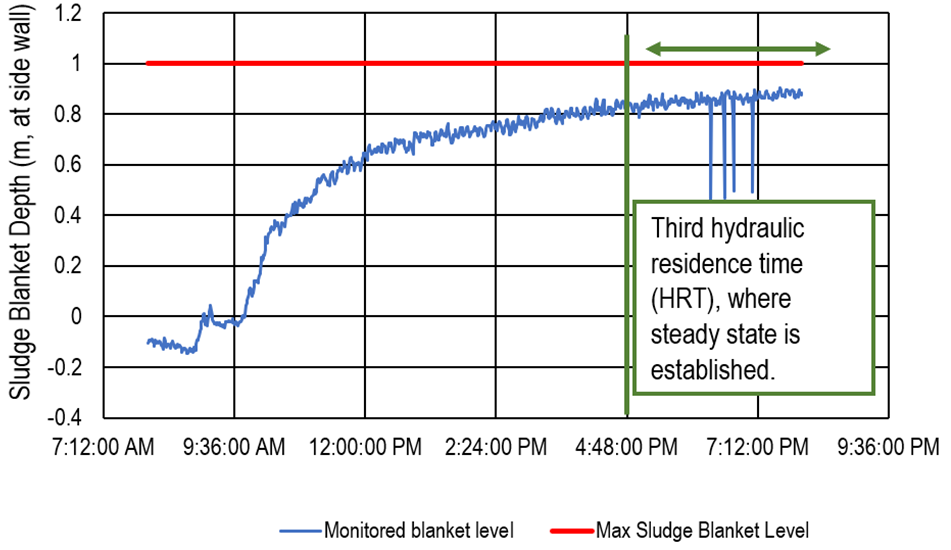
Figure 4: Example of clarifier at maximum load during stress testing (red line showing the agreed test boundary, representing the maximum sludge blanket depth)
Figure 5 and Figure 6 show solids loading rates and surface overflow rates for a number of clarifiers tested. Figure 5 results indicate that the clarifiers were operating within their boundaries in terms of clarification failure, as the effluent turbidity was under the agreed maximum levels (10 NTU). Figure 6 shows clarifiers B and C approaching their relative boundaries for thickening failure as evidenced by the approach to the agreed maximum blanket depth.
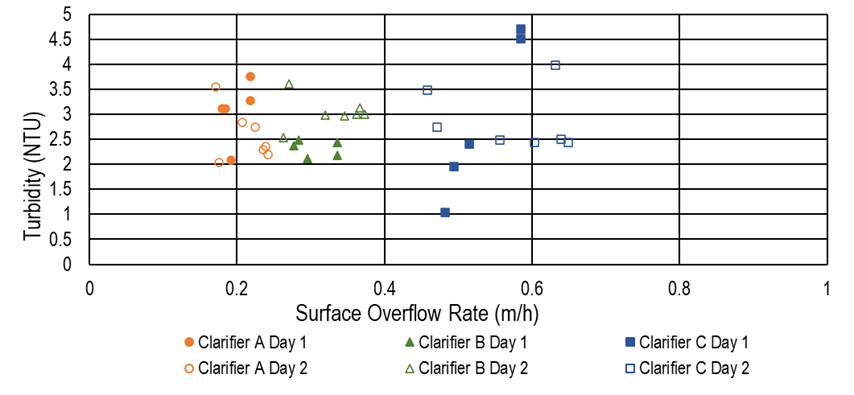
Figure 5: Example of effluent turbidity for three clarifiers at various surface overflow rates.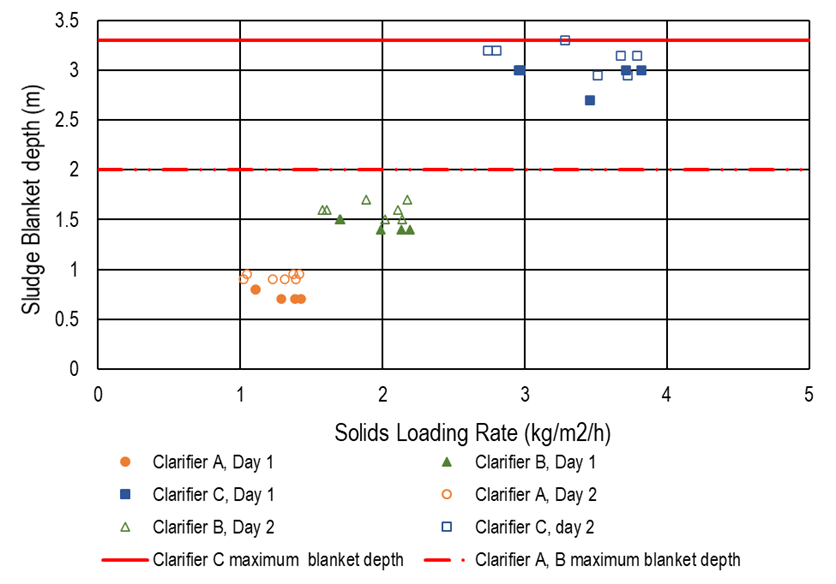
Figure 6: Example of sludge blanket depth for three clarifiers at various solids loading rates.
Results: Utilising polyelectrolyte to enhance clarifier performance
Figure 7 shows the sludge blanket level of three clarifiers under test conditions with and without polyelectrolyte addition.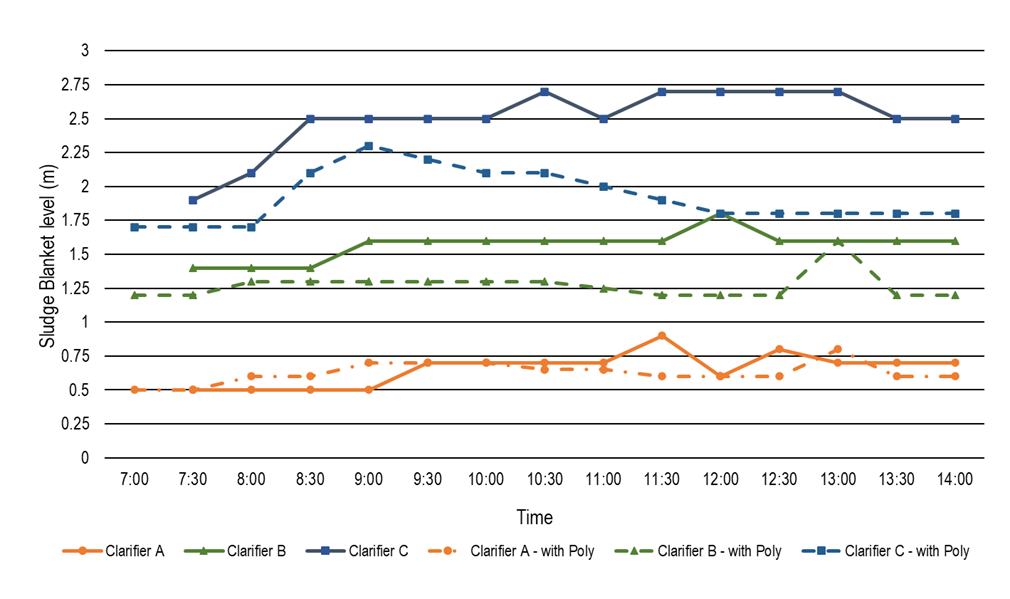
Figure 7: Example of sludge blanket levels of three clarifiers under test conditions, with and without polyelectrolyte
Results: Design factor determination
Design factors were derived for each clarifier by dividing the installed clarifier capacity (in terms of solids loading rate or surface overflow rate) derived through the stress testing tests by the capacities predicted by the Vesilind Flux model for the same operational and loading conditions. Example outputs are given in Table 4.
|
Parameter |
Units |
Clarifier D |
Clarifier E |
Clarifier F |
|
sSVI |
mL/g |
115 |
130 |
98 |
|
V0 |
m/s |
5.58 |
5.07 |
6.21 |
|
n |
m3/kg |
0.418 |
0.45 |
0.38 |
|
MLSS |
mg/L |
3818 |
4148 |
4600 |
|
Clarifier Influent Flow (excl. RAS) |
L/s |
118 |
165 |
245 |
|
Surface Overflow Rate Applied |
kL/m2/h |
0.53 |
0.58 |
0.70 |
|
RAS Flow Applied |
L/s |
90 |
90 |
101 |
|
RAS Ratio Applied |
ratio |
0.76 |
0.55 |
0.41 |
|
Minimum Theoretical RAS Ratio at Applied SOR |
ratio |
0.37 at 0.53 m/h SOR |
0.58 at 0.58 m/h SOR |
0.50 at 0.70 m/h SOR |
|
Maximum Surface Overflow Rate (theoretical) |
kL/m2/h |
1.13 (Clarification Failure) |
0.78 (Clarification Failure) 0.53 (Thickening Failure) |
1.07 (Clarification Failure) 0.48 (Thickening Failure) |
|
Design Factor |
# |
0.46 (Clarification Failure) (Thickening failure not able to be calculated) |
0.75 (Clarification Failure) 1.09 (Thickening Failure) |
Unknown for Clarification Failure, but must be >0.65 1.46 (Thickening Failure) |
Upgrade requirement
By applying the test procedures outlined above, identification of the failure mechanism specific to each clarifier enabled identification of a potential upgrade solution with a view to minimising costs and improving performance and/or capacity. Table 5 outlines identified failure mechanisms and potential outcomes which were considered as part of this study.
|
Failure Mechanism |
Potential Action |
|
Flocculation |
Clarifier feed structure Energy Dissipating Inlet arrangement, sizing Flocculation skirt sizing, depth, outlet ports, hydraulics (lateral flow) |
|
Clarification |
Weir configuration Stamford baffles Polyelectrolyte (applied in wet weather events only) |
|
Thickening |
Sludge scraper effectiveness Sludge hopper RAS pump upgrade Polyelectrolye (applied in wet weather events only) |
Discussion
The WERF protocol was found to be a useful tool in assessing clarifier performance in situ. By following this protocol at multiple plants, several key learnings were made:
Operational experience
As part of the protocol, discussions were held with operational staff before performing the testing procedure to advise on setting the boundary conditions for the tests. This enabled the STPs to continue operating within safe operating parameters whilst allowing the test to proceed.
Given the large range between theoretical and actual clarifier loading conditions, and the time and operational effort to perform each test, these discussions were proven crucial in accurately setting the initial “stress testing” conditions. Specific questions were asked regarding clarifier performance during recent wet weather and maintenance events where the clarifiers were considered to be highly loaded and data pursued to quantify the loading rates (in terms of SLR , SOR and maximum RAS capabilities) for those periods in an effort to accurately predict the “stress test” conditions.
Testing procedure, maintaining steady state conditions
Maintaining steady state conditions to the test clarifier over a period of three hydraulic residence times is a fundamental requirement of the WERF protocol. In many cases, this condition requires the test to run for greater than 12 hours, with clarifier feed flow, MLSS concentration and RAS flows held constant. To achieve the steady state conditions to the clarifier in test, site specific measures may require alternative influent pumping arrangements (to minimise diurnal fluctuations), and/or supplemental influent pumping arrangements. In several of the plants tested, this required control of the network pumps to moderate the influent flow, and overpumping from effluent lagoons to the bioreactors to maintain consistent flow to the clarifier under test. These arrangements required a significant commitment from site operations staff, but were observed to be required to be maintaned for the recommended three hyraulic residence times to achieve steady state (see Figure 4, which shows the clarifier solids blanket stabilising over the third hydraulic residence time in the test). The long hours required for each test run further support the early and accurate identification of the near to or correct loading rate for the test, as multiple re runs of the test consume considerable time and disruption to plant operations.
Consistently maintaining steady state loading conditions (particularly with respect to individual clarifier feed flow) was difficult to achieve at many plants due to the lack of installed flow monitoring (and control) for individual clarifier feeds. In some cases this was managed by diverting flow to other trains of the plant, such that only one clarifier for the train was tested, and therefore totalised train flows could be used. In another assessment, hydraulic calibration of the clarifier flowsplitter was made to understand the proportionate flow splits between clarifiers, with this flow split used in conjunction with the totalised plant effluent flowmeter to approximate the flow through the test clarifier.
Testing procedure, equipment
A van Doorn sampler was utilised for flocculation testing, as a Kemmerer sampler was unavailable. The van Doorn sampler enabled sampling, settling and removal of the sample in one vessel (thus adhering to the protocol’s requirements). However, the lateral arrangement of the van Doorn sampler made sampling difficult and required additional care to ensure the supernatant could be removed accurately, noting the “hang up” of solids on the horizontal tube located within the sampler (See Figure 1).
Testing procedure, adhering to predefined boundaries
Adherence to the predefined boundaries for aborting the test were considered mandatory to ensure plant performance requirements were met throughout the test. Impacts on plant operation, including the RAS concentration and RAS pump speed, required monitoring to ensure pump capacities were not exceeded.
At one plant, the thickened RAS concentration was such that there was a requirement to dilute RAS to a concentration appropriate for the installed pumps. This required dilution from the effluent lagoons to the RAS pump well to ensure RAS concentration could be maintained below an agreed boundary condition. This process highlighted the limitation of the installed RAS pumps when compared to the clarifier capacity and led to a RAS pump upgrade to be considered as part of an overarching upgrade strategy to release capacity at the plant.
Practical challenges
At one plant, the clarifier flowsplitting arrangement was such that of the three clarifiers in service, only two could ever be operated at limiting conditions. The test run shown in Figure 6 shows a scenario where a clarifier (Clarifier A) was operating well under its limit for solids loading rate, as shown by the low sludge blanket depth recorded. In this instance, Clarifier A was not able to be tested at its ‘stress test’ limiting loading condition, due to the plant’s clarifier flow splitting configuration.
Through this testing, the plant’s clarifier flow splitting limitation was demonstrated, which resulted in the under utilisation of this clarifier. This testing highlighted the importance of effective flowsplitting in achieving full utilisation of installed infrastructure. In this instance, the augmentation of the upstream flowsplitter was considered to balance the loading proportionally, according to the installed clarifier capacity, across all available clarifiers. This moderate augmentation could provide a substantial plant capacity increase.
Polyelectrolyte variability in performance
Figure 7 describes the sludge blanket level of three clarifiers under test conditions with no polyelectrolyte, and again with polyelectrolyte addition. The results show the minor to major impact polyelectrolyte addition may have to plant capacity depending on the limitations of the system – again showing the importance of full scale tests to identify the potentials relevant to each situation. In the case shown, a polyelectrolyte dosing system was installed for Clarifier C, with significant plant improvements observed during wet weather events. Polyelectrolyte was not shown to improve the capacity of Clarifier A, due to the relative load imbalance between the clarifiers, and the inability of Clarifier A to be loaded to at, or near, its limit (during test conditiosn or otherwise). Polyelectrolyte was shown to have a minor impact on settleability for Clarifier B. Due to this, and the relatively small contribution of that clarifier to the whole of plant capacity (due to its relative size), a polyelectrolyte dosing system was not installed on this clarifier.
In the case shown, the same polyelectrolyte was shown through jar testing to be beneficial for settling that was also used on site for dewatering. Hence a cost efficient augmentation was devised to dose polyelectrolyte to the clarifiers from the existing polyelectrolyte batching and dosing facility. As dewatering can be adjusted to not operate during wet weather events, utilisation of the same system could be made with limited upset to the existing plant.
Conclusion
The WERF protocol for evaluating secondary clarifier performance was found to provide a robust reference for assessing clarifier capacities. Installed clarifier capacities were found to vary substantially from their theoretical values by reference to design factors which ranged from 0.46-1.46 when compared to typical design figures of 0.75-0.85.
Understanding the installed clarifier capacity and limiting features is a key element to enabling full utilisation of existing assets. This provides benefits in maximising the asset, but also in setting realistic expectations with respect to treatment capacities and allowing for meaningful upgrade planning. Understanding the element which limits the secondary clarifier capacity (be it flocculation, hydraulics, clarification or thickening) were shown in this study to provide benefits in enabling relatively minor retrofits to be empolyed to release latent capacity. In particular, the addition of polyelectrolyte was shown to improve clarifier performance in some cases. This was employed to extend clarifier performance in emergency situations such as wet weather events.
Nomenclature
ADWF – Average Dry Weather Flow
DSS – Dispersed Suspended Solids
eDSS – effluent Dispersed Suspended Solids
ESS – Effluent Suspended Solids
FSS – Flocculated Suspended Solids
HRT – Hydraulic Residence Time
iDSS – influent Dispersed Suspended Solids
MLSS – Mixed Liquor Suspended Solids
RAS – Return Activated Sludge
SCADA –System control and data acquisition
sSVI- Stirred sludge volume index
STP – Sewage Treatment Plant
SVI – Sludge volume index
TSS – Total Suspended Solids
WERF – Water Environment Research Foundation
WWTP – Wastewater Treatment Plant
References
Ekama, G and Marias, P.M. 2004. Assessing the applicability of the 1D flux theory to full-scale secondary settling tank design with a 2D hydrodynamic model.
WERF/CTRC, 2001. Protocols for Evaluation Secondary Clarifier Performance.
Author Biographies
Christie Cole | Christie Cole is a Technical Director with GHD. She has extensive experience in operations which has enabled her to understand the complexities involved in the application of design to operations and the importance of maintaining a focus on operability and efficiency. Christie holds an Environmental Engineering (Honours) degree from UQ.
Share