


Measuring progress to achieve safe drinking water for First Nations people

Key points
- The “safe drinking water” target (Target 9b) for the National Agreement on Closing the Gap needs a suitable robust indicator for reporting progress towards its achievement.
- The proportion of the Indigenous population supplied with water that fails at least one of the ADWG in a given year is suitable and is compatible with the planned submission of compliance data from smaller suppliers to the National Performance Review.
- Several other indicators are proposed that account for the severity of the health risks from an unsafe water supply and the number of consumers affected.
- Calculating values of these indicators from a comprehensive dataset across four jurisdictions demonstrates their robustness and suitability for prioritising remediation of non-compliant supplies.
- The values calculated here show the immediate and considerable effort required to achieve the water safety aspect of Target 9b by 2031.
Abstract
In December 2021, the Community Infrastructure Target 9b was added to the National Agreement on Closing the Gap. This Target stated that First Nations’ households were to receive essential services, including “safe drinking water”, at relevant State/Territory “jurisdictional standards” by 2031. In Australia, water is considered safe if it complies with the Australian Drinking Water Guidelines (ADWG). We have proposed several potential jurisdictional/national target indicators, based on health risk. They are consistent with the ADWG advice that reducing acute (microbial) health risks is of higher priority than reducing chronic (chemical) risks. They also account for the severity of the risks involved and the number of people exposed to them. Their values were calculated from a Dataset for Indigenous communities derived from the most comprehensive annual data publicly available for smaller regional and remote communities. They show that there are many remote Indigenous communities that are facing acute health risks and many more facing severe chronic health risks. Non-compliant supplies were also prioritised for remediation, based on acute, then chronic, health risks to their corresponding communities.
Introduction
The National Agreement on Closing the Gap (2020) came into effect on 27 July 2020. Parties to the Agreement committed to developing a (further) target on Community Infrastructure within 12 months (Clause 87). This target “will measure progress towards parity in infrastructure, essential services and environmental health conditions. This will include data development to measure essential service provision to Aboriginal and Torres Strait Islander (ATSI) communities, including water and sewerage, waste management road reserves and electricity supply, as well as composite measures to capture all aspects of the target”.
The Community Infrastructure target (Target 9b) was added to the National Agreement by the Joint Council on 3 December 2021. It states that:
By 2031, all ATSI households:
- within discrete ATSI communities receive essential services that meet or exceed relevant [State/Territory] jurisdictional standards
- in or near to a town receive essential services that meet or exceed the same standard as applies generally within the town
Discrete communities of part i are those with >50 inhabitants that are predominantly (>50%) ATSI people with housing or infrastructure (power, water, sewerage and solid waste) managed on a community basis. The households referred to in part ii of the Target are not defined further.
In addition to the targets, the National Agreement lists indicators to be used to assess the progress being made towards the targets (Chapter 7B). The indicator relevant to Target 9b, the provision of essential services, is “progress towards parity”.
Clause 89 of the National Agreement states that “available baseline data for each state and territory will be published on the Closing the Gap website on commencement of this Agreement and subsequently on the Productivity Commission Dashboard following its development to enable monitoring of each jurisdiction’s progress and contribution towards the achievement of targets. The Productivity Commission will also publish baseline data for any new target agreed….” Clause 88 is a similar statement regarding the national trajectories for each target.
Three years have elapsed since Target 9b was included in the National Agreement, but the Productivity Commission has not yet published any relevant baseline data. In the latest data compilation report (Productivity Commission 2024), Target 9b is the only one of nineteen target indicators for which there is no data source and therefore no report on progress. This situation cannot be remedied at least until the next data compilation report is issued in July 2025 – more than three and a half years after Target 9b was included in the National Agreement. This severely limits the nation’s ability to even understand the scale of the work required to bring essential services up to parity, let alone plan and achieve the Target in the remaining six and a half years (to Dec 2031).
The National Agreement further includes “Data Development” to measure and report progress in ways that are necessary but not currently possible. In relation to Target 9b, the item of critical importance listed under this heading is “Aboriginal and Torres Strait Islander households’ access, relative to relevant standards, to safe drinking water” because it directly affects human health. This is confirmed by the setting of an immediate Priority Action for Target 9b, announced by the Federal Government in February 2023, of $150M (with matched funding from the State/Territory jurisdictions) for the provision of “safe and reliable drinking water to First Nations communities”, to be expended by 2026 (National Indigenous Australians Agency 2024).
Ensuring that these and future commitments achieve safe drinking water for First Nations communities first requires an agreed definition of safety across all jurisdictions. In Australia, it is generally accepted that drinking water is safe if it meets the Australian Drinking Water Guidelines (ADWG; NHMRC 2024) – hereafter termed the Guidelines. These Guidelines recommend limits on either the annual proportion of positive samples (i.e., containing indicator bacteria) or the maximum measured values of over two hundred substances. Many of these are designated as health-related. However, even in urban areas, only a subset of these health-related substances is monitored at the frequency and spatial distribution recommended in the Guidelines advice. The subset of substances monitored differs between jurisdictions and may also differ within each jurisdiction.
Consequently, to even compare the safety of First Nations drinking water with the Guidelines, or with any other drinking water, an agreed list of substances is required for comparison, which will differ at least between, and possibly within, jurisdictions.
The National Performance Report: urban water utilities (NPR; BoM 2024) is published annually by the Bureau of Meteorology (BoM). It includes two indicators of Public Health (H3 and H4), which are the proportions (%) of the population that a utility supplies with water complying respectively with the microbiological and health-based chemical Guidelines. These two indicators could be combined to form a single one for reporting progress towards the water safety component of Target 9b. Before the 2023-24 NPR (not yet released), only water utilities servicing more than 10,000 connections were included. As there are no discrete Indigenous communities of this size, there are no relevant data available from previous NPRs.
The 2024-25 NPR will be the first to include data from utilities servicing less than 10,000 connections (BoM 2025), but these suppliers are only required to report whether they use water quality risk management Guidelines (H1), not whether their water complies with the Guidelines (H3 and H4). Consequently, the 2025-26 NPR (to be released in 2027) will be the first possible opportunity to obtain compliance data (H3 and H4) from water suppliers to Indigenous communities, assuming that all suppliers are required to report in that year. This requirement has not yet been foreshadowed and is likely to take at least two years to implement, given the experience with larger suppliers. That is, the NPR compliance data would be barely available for inclusion in the mid-2029 Productivity Dashboard – over seven years after the introduction of Target 9b. A population-weighted combined indicator is needed much earlier to track (and adjust) progress towards the water safety component of Target 9b, as that Target is intended to be achieved by 2031.
We propose that the Dashboard uses a combination of indicators H3 and H4 because water safety is only one aspect of Target 9b that needs to be reported on the Dashboard. In the absence of this information from smaller water suppliers in the NPR, a baseline analysis was conducted to produce this combined indicator from the Supplementary Data of Wyrwoll et al. (2022) – hereafter termed Wyrwoll’s Data. They collated and published the publicly available drinking water quality data from smaller Australian regional and remote communities for 2018-2019 (or the nearest available year).
The combined indicator proposed for the Dashboard may be sufficient to track progress towards national compliance with the health-related Guidelines. However, the microbial and health-based components need to be reported separately at jurisdictional level to enable each jurisdiction to give priority to achieving microbial compliance, as recommended by the ADWG. We have also reported the results of our baseline analysis at this level for this purpose.
None of the indicators just described provide any useful information regarding the severity of exceedances associated with each supply and the consequent prioritisation needed for their remediation. We further propose the use of a “Health Risk Index” (HRI) for this purpose, which is similar in concept to the “Hazard Index” used by World Health Organization Guidelines (WHO 2022) and the US Environmental Protection Agency (USEPA 2024). The latter index is used to limit the concentrations of a group of substances (e.g. trihalomethanes or PFAS) by requiring the sum of the ratios of their individual concentration to the corresponding Guideline to be less than one. The HRI uses the same summation of ratios, but each ratio is the concentration by which a substance exceeds its Guideline, relative to the Guideline concentration. The ADWG consistently prioritises microbial compliance above health-related chemical compliance. Consequently, an HRI for each category is proposed to characterise the relative safety of each water supply for prioritising remediation.
To maintain consistency with the advice of the ADWG, Indigenous community water supplies should be remedied, first in order of their microbial HRIs, then in order of their health-related chemical HRIs. A priority list for remediation of Indigenous water supplies was derived on this basis from Wyrwoll’s Data. It can be readily updated whenever additional relevant data become available.
This proposed approach to tracking progress and prioritising remediation to achieve the water safety aspect of Target 9b considers only discrete Indigenous communities (i.e. part i of the Target). We also consider how part ii of the Target (i.e. for Indigenous households in or near a town) could be included in this approach.
Similar measures should be derived later for substances identified in the Guidelines as affecting aesthetic quality, particularly because poor aesthetic quality affects health indirectly through the substitution of sugary drinks for drinking water.
It should also be noted that the same approach could be applied to any set or sub-set of water supplies (e.g. for zones within a large supply system).
Method
Target 9b of the National Agreement on Closing the Gap implies that water is safe if it meets “jurisdictional standards”, which are subsets of the Guidelines, currently differing between jurisdictions. This study consequently assumed that a water supply is safe if it meets the subset of health-related Guidelines that are currently monitored in a given jurisdiction. We have adopted the (jurisdictional) subsets of health-related substances identified by Wyrwoll et al. (2022).
We used Wyrwoll’s Data as our data source because it is the most comprehensive dataset of drinking water quality data publicly available for smaller Australian regional and remote communities. Furthermore, a similar dataset for a later year is currently under development (Wyrwoll pers. comm.) When complete, progress towards Target 9b can be estimated by calculating changes in the measures proposed in this paper over the time elapsed between the original and new datasets.
Wyrwoll’s Data is contained in Excel spreadsheets that list (by row) each water supply serving less than 10,000 connections within a single jurisdiction. A column in each spreadsheet indicates whether each supply serves a “Remote Indigenous” community, which is determined from a hierarchy of information detailed by Wyrwoll et al. (2022). Another column contains the population served by each supply. The population and health-related water quality data associated with supplies identified as serving Remote Indigenous communities were extracted to form a new Dataset from which the proposed measures of safety were calculated. (Although not classified as Remote, Cherbourg QLD was included in our Dataset because it is supplied by a Regional Aboriginal Council.) The new Dataset (download here) was confined to those supplies that contained at least one health-related substance which did not comply with its respective Guideline.
The only microbial data included in Wyrwoll’s Data (and this study’s Dataset) are the presence/ absence of the bacterium E. coli in 100mL samples. These data are ideally recorded as the number of samples taken and the number of these that contain E. coli (i.e. positive samples) in two adjacent spreadsheet columns. This follows the ADWG advice on long-term evaluation of monitoring in the distribution system (NHMRC 2024, section 10.3). To comply with the ADWG “microbial” Guideline requires zero positive samples in an annual period and this study used this definition to determine which supplies were included in the safety analysis.
Additional columns in Wyrwoll’s Data (and our extracted Dataset) contain the measured data obtained from samples taken from each water supply for non-microbial substances monitored in any jurisdiction during July 2018-June 2019 (or the nearest similar period). Wyrwoll calculated compliance for each substance, according to the rounding rules specified in Chapter 6 and Table 10.3 of the ADWG. All exceedances were reviewed to ensure the resulting individual indicators of exceedances were correct. The only correction required was due to the raising of the Guideline for uranium since Wyrwoll’s calculations were made. In contrast, a composite indicator was constructed for all these substances in our Dataset, in addition to an acute (microbial) compliance indicator.
The crudest measure of safety is the proportion of communities within a jurisdiction supplied with water containing substances that exceed one or more of their respective Guidelines in a given year. A similar national measure could be proposed. However, this is not a suitable measure for reporting progress towards meeting the Guidelines because it would give undue emphasis to improving the safety of small supplies, even at the same level of Guideline exceedances.
Instead, suitable measures of safety need to account for the number of people affected by any exceedances of the Guidelines in their water supply. Then a basic general measure of safety is the proportion of a jurisdiction’s population that is supplied with water that exceeds at least one of the Guidelines in any year. That is;
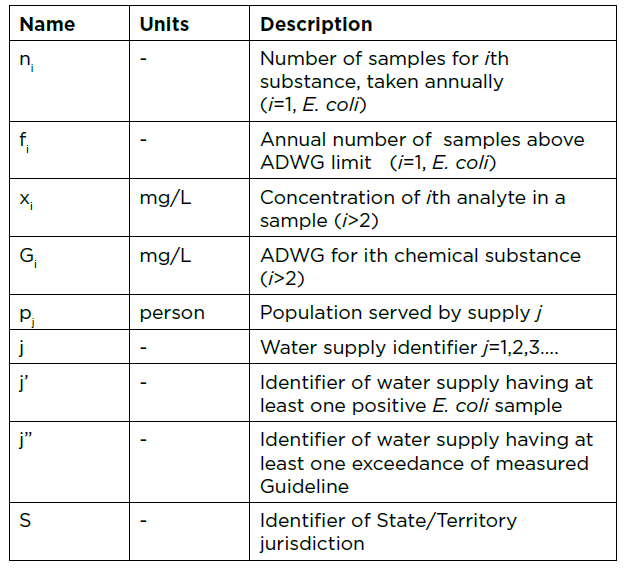
where pj is the population of the jth community in the jurisdiction and j’ and j” indicate communities with water containing substances that exceed at least one of the Guidelines for microbial (E. coli) and non-microbial substances respectively.
The corresponding national measure is given by Equation 2:
where S is the State/Territory jurisdiction indicator.
The ADWG guidance (NHMRC 2024) clearly states that compliance with the microbial Guideline is of higher priority than meeting the Guideline for any other substance because a positive E. coli sample indicates a potential immediate (acute) health risk of illness from enteric pathogens. In contrast, all other health-related (chronic) Guidelines are specified as concentrations, below which the health risk from its consumption over a lifetime is acceptable. Consequently, two separate measures of safety – acute and chronic health risk – are needed to focus priority on reducing acute health risks.
Acute health risk assessment
The basic measure of safety is the proportion of people supplied with water for which at least one sample was positive for E. coli in the year of interest (Equation 3). Within a jurisdiction:
where pj is the population served by supply j and j’ identifies those supplies with positive samples.
The corresponding national measure is given by Equation 4.
where S is the State/Territory (jurisdiction) indicator.
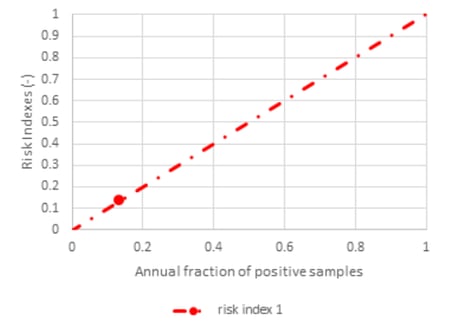
This measure does not account for differences in the severity of the acute health risk faced by people served by different supplies. For most Guidelines (including this one), each person drinking from the same supply is assumed to face the same health risk. This study therefore proposed the ratio of positive E. coli samples (f1) to the total number of samples (n1) taken in any year as a second measure of the safety of a drinking water to reflect the severity of the acute health risk in a given supply. This is defined as the acute health risk index. Its form is illustrated in Figure 1. It can be interpreted as the increased annual chance (percentage of time) that an individual consumer is exposed to enteric pathogens, relative to a consumer drinking from a microbially compliant supply.
This “individual’s acute HRI” can be converted to a “community acute HRI” by multiplying the individual’s risk by the population supplied with that water Then the average (or population-weighted) individual’s risk over all supplies in a jurisdiction can be calculated by summing the community risks and dividing by the sum of the populations supplied (Equation 5).
A similar calculation over all supplies in all jurisdictions gives the national average individual’s risk (Equation 6).
The Acute HRI is a suitable primary criterion for prioritising remediation of individual water supplies because it reflects the severity of exceedance of the microbial Guideline.
Chronic (lifetime) health risk assessment
For our Dataset, the simplest measure of chronic health risk is the proportion of people served by supplies containing at least one substance that does not comply with its respective Guideline. As with the microbial limit, this does not account for the severity of the risks faced by people served by different non-compliant supplies.
The ADWG advice on evaluating long-term health-based chemical monitoring in the distribution system (NHMRC 2024, Section 10.3.2) recognises that relatively few chemical data (monthly or quarterly) will be available from smaller systems. In these cases, it recommends that the maximum annual measured concentration of a chemical should not exceed its Guideline value. If the maximum exceeds the Guideline, then the water does not comply. Also, assuming a single measure is required for prioritisation, a procedure is needed to combine the risks associated with the maximum concentration of several substances exceeding their respective Guidelines simultaneously.
To address both these issues, we have adopted the concept of a chronic health risk index to be the amount by which a substance concentration exceeds its Guideline limit, relative to that Guideline value (Equation 7).
Then the annual chronic health risk index for a single (ith) contaminant (i>2) is:
Chronic HRI = (max(xi) / Gi) -1 for max(xi)>Gi
ni
= 0 otherwise (7)
where xi is one of ni measured values of the ith contaminant in a given year.
For example, if a measured concentration exceeds the Guideline value by 70%, the corresponding HRI is 0.7. Figure 2 illustrates the case of a substance with a Guideline value of 0.6 mg/L.
This concept embodies the principle that an individual’s health risk from a substance exceeding its Guideline value increases in proportion to the exceedance. Consequently, the HRIs of individual substances can be simply added to obtain a combined HRI for a given water (Equation 8) because the index is defined relative to the Guideline value (i.e. it is non-dimensional). This is similar in principle to the “hazard index” used by WHO (2022) to set a limit for total trihalomethanes, but here it is being used to characterise the severity of the relative exceedance of all relevant Guidelines.
Combined HRI =
∑ [(max(xi)/Gi)-1] for max(xi)>Gi only (8)
i ni
This combined individual’s health risk was also converted to a community’s combined risk by multiplying by the population served (Equation 9).
Community Combined HRI =
pj × ∑ [(max(xi) / Gi) -1] for max(xi)>Gi only (9)
i ni
The population-weighted average combined chronic HRI for a jurisdiction is then given by Equation 10.

A similar national average over all jurisdictions is given by Equation 11.
Some of the data for substances that constitute chronic health risks are not reported publicly as numerical annual maximum values. Rather, they are reported as the annual number of samples that exceed the respective Guideline value of each monitored substance. (This is an alternative for long-term assessment recognised by the ADWG Section 10.3.2.) If the total number of samples taken in the same period is also given, then the proportion of samples exceeding the corresponding Guideline was used as an HRI, just as it was for the microbial (E. coli) Guideline (Equation 3). HRIs of this type of were summed to obtain a combined chronic HRI for a given water (Equation 12). A correction for double-counting in cases of more than one exceedance in a sample was also made, as detailed in the Results section.
The population-weighted average combined chronic HRI for a jurisdiction is then given by Equation 13.
where j” is the indicator for those supplies in which at least one of the chronic Guidelines is exceeded.
Similarly, summing these over all jurisdictions (Equation 14) is an appropriate replacement for the national measure M4n, used when measured values are given (Equation 10).
Results and Discussion
A substantial omission from Wyrwoll’s Data is any useful data from NSW because the NSW Government does not require any water supplier to make its water quality monitoring data public. Furthermore, there is no Indigenous classification of water supplies included in Wyrwoll’s Data for NSW, Victoria or Tasmania. Consequently, the proposed measures could be calculated for only the remaining four jurisdictions – NT, QLD, SA and WA – and the “national” measures draw on data from only these jurisdictions.
In our Dataset, 39 Remote Indigenous communities face chronic health risks. Only seven non-microbial substances were monitored in any of these communities – antimony, barium, nitrate, manganese, uranium, fluoride and trihalomethanes. Although free and total chlorine were included as health-related parameters for QLD in Wyrwoll’s Data, they were not included in our analysis as they are operational data rather than data for annual assessment, according to the ADWG guidance. Table 1 shows the ADWG limits and the disparity between jurisdictions regarding the monitored substances.
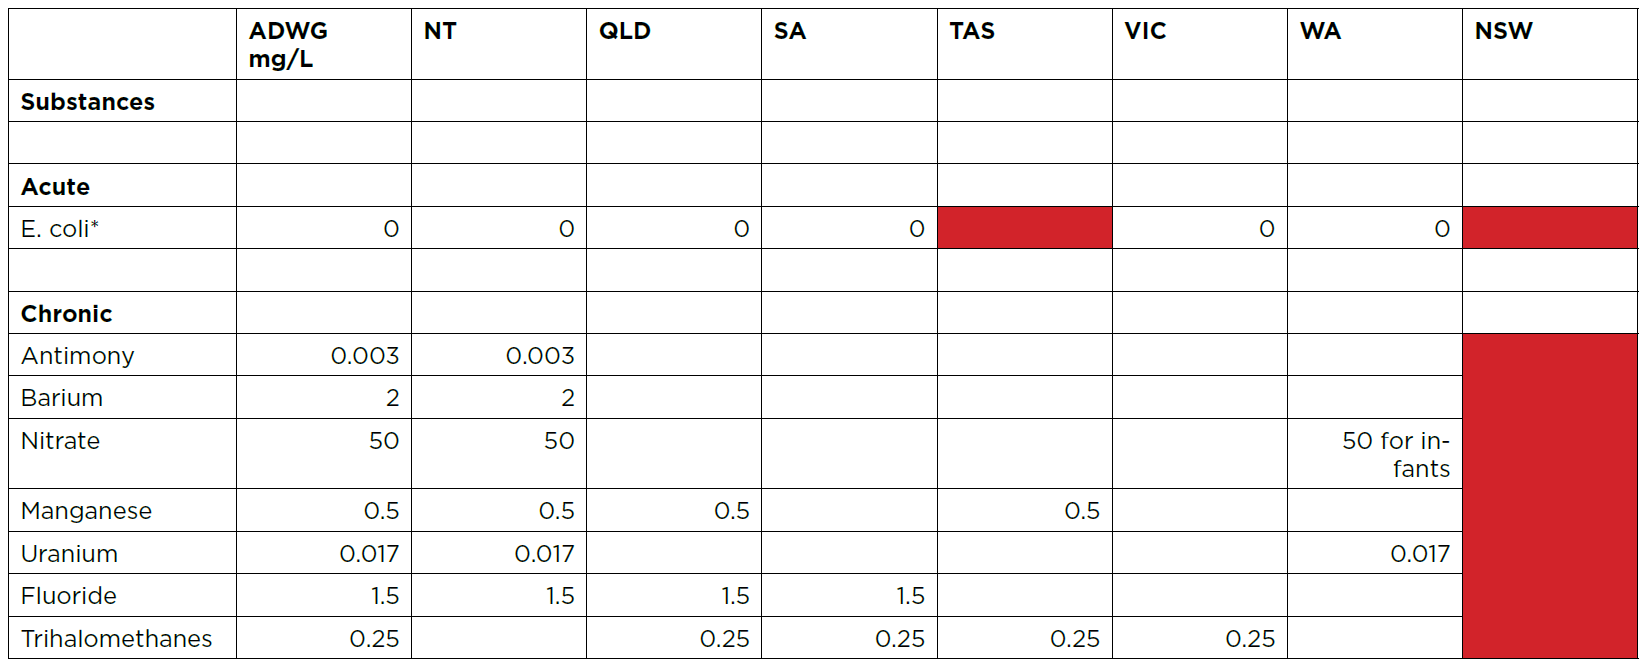
*cfu/100mL;
Blank cells indicate no data available; red cells indicate data existing but not publicly available.
Our Dataset spreadsheet (download spreadsheet here) also contains the calculations of the measures (M1 to M5) proposed in the Methods section above. The calculated values of these measures are summarised in Table 2.
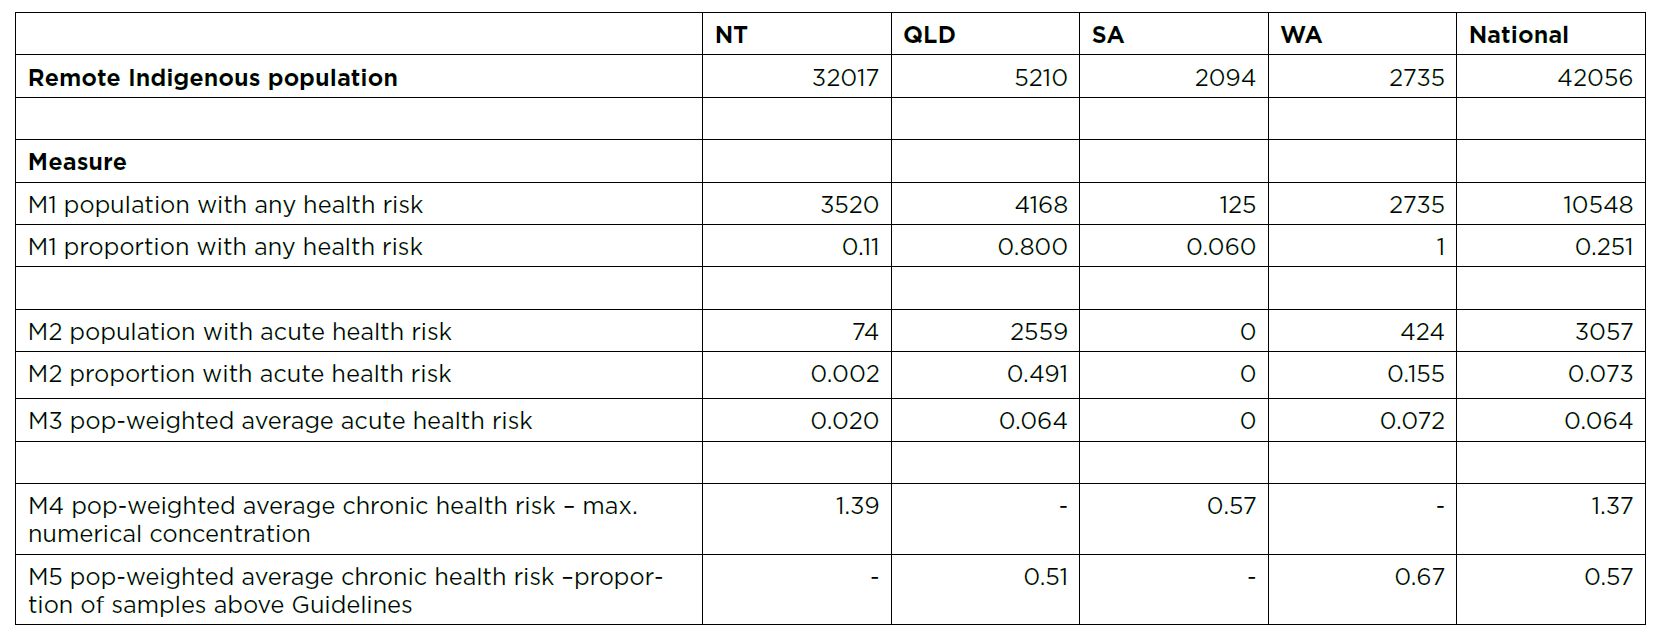
From Table 2, there are 42,056 Remote Indigenous people (as classified by Wyrwoll et al. 2022 plus Cherbourg) living in 48 communities. More than a quarter of these people (M1n=25%) face either acute or chronic (lifetime) health risks from their water supply. This proportion (M1) varies from 6% in SA to 100% in WA.
The national measure M1n could be calculated annually from NPR data when smaller suppliers are required to provide compliance indicator data (H3 and H4) to the NPR. It is therefore proposed as the simplest appropriate measure to be included in the Productivity Commission’s Dashboard for reporting progress towards the water safety aspect of Target 9b.
Over three thousand Remote Indigenous people (M2n=7.3%) face acute health risks, as indicated by presence of E. coli. These people live in 14 different communities. This national statistic is distorted by the very small proportion (0.2%) of people affected in the NT (only one community). It is difficult to see why this proportion (M2) should be so much higher in WA (15.5%) and highest in QLD (49.1%), particularly when NT appears to be conducting weekly sampling, whereas WA is sampling monthly.
Of the 14 communities facing acute health risk, the national population-weighted average acute health risk (M3n), as indicated by the ratio of positive to total samples taken, is 0.064. That is, on average, these people face an additional 6.4% chance of exposure to enteric pathogens annually (compared with communities having ADWG-compliant water). The jurisdictional average (M3) varies from zero (SA) to 0.072 (QLD). These are the primary jurisdictional measures of water safety that are suitable for tracking their progress towards Target 9b because they encompass the numbers of people facing acute health risks and the severity of these risks. The goal for jurisdictions would be to drive this measure to zero by 2031.
For substances that constitute chronic health risks, the ADWG guidance (NHMRC 2024, section 10.3) is that the maximum measured (“numerical”) concentration should be compared with the respective Guideline in an annual assessment because there are usually relatively few samples taken (monthly or quarterly). Only the NT and SA followed this guidance. In these two jurisdictions, there were no supplies in which more than one of these seven substances exceeded their respective Guidelines.
The population-weighted average annual chronic health risk (M4) for the NT and SA were 1.39 and 0.57 respectively (Table 1). The corresponding national value (M4n) of 1.37 was obtained by combining these jurisdictional data according to Equation 11. That is, the average maximum concentration of monitored substances that constitute chronic health risks were on average more than double (137% higher than) their respective Guideline limits – reflecting substantial exceedances and hence chronic health risks. In SA, this average was highest, at 139% of the Guideline limit.
The other two jurisdictions (QLD and WA) publicly reported their non-microbial health-based data as the proportion of Guideline exceedances of a given substance’s concentration. The jurisdictional and national population-weighted average annual chronic health risks (M5 and M5n) could therefore be calculated in the same way as the corresponding microbial acute health risk (M3 and M3n, Equations 5 and 6).
The calculated value of 0.57 for the national average M5n can be interpreted as more than one chance in two of an individual suffering an adverse chronic health effect in those communities whose water exceeds any Guideline. In WA, this average risk is even higher (at 67% rather than 57% chance).
In these two jurisdictions, there were two instances where two non-microbial substances were reported as exceeding their respective Guidelines in the same supply, thus requiring the summation of proportions fi/ni in Equation 12. A correction is needed to the sum obtained to avoid double counting samples in which both Guidelines are exceeded. Assuming independence of exceeding each Guideline, the correction made was -pj×(f2/n2× f3/n3) where subscripts 2 and 3 indicate the chronic substances involved.
Table 3. Priority ranking of water supplies for remediation of acute health risk
Calculation of the proposed jurisdictional measures M3 to M5 (and their national counterparts) from Wyrwoll’s Data clearly shows there is much progress needed to reach Target 9b with respect to water safety. If decreasing health risk is regarded as the primary criterion for prioritising remediation of Indigenous water supplies, then remediation should be prioritised according to the rankings given in Table 3. Group A comprises water supplies that are not compliant with the microbial Guideline, which are ranked according to decreasing population-weighted acute HRI (pj’×f1/n1 of Equation 5). To be consistent with ADWG advice, they should all be remediated before Groups B and C (Table 4). In particular, the first three supplies (Woorabindah, Erub and Kadjina) have substantially elevated acute HRIs.
Six of the Group A supplies also have positive chronic HRIs. Remediation of the corresponding substances should be considered at the same time as reduction in their acute HRIs. They are shaded yellow in the Groups B and C rankings (Table 4) to indicate this.
Table 4. Priority ranking of water supplies for remediation of chronic health risks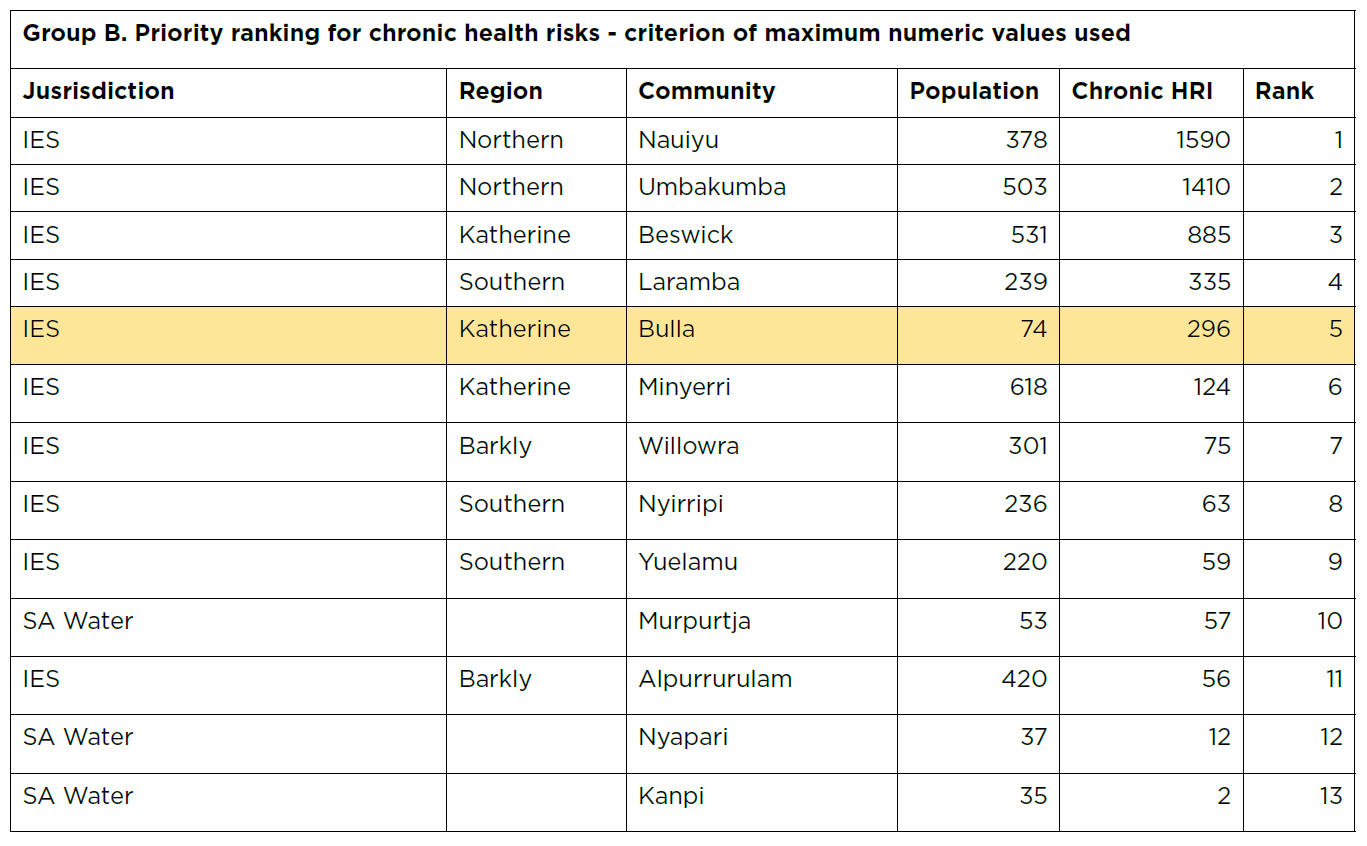
*calculated from Equation 9;
^calculated from Equation 12
Groups B and C comprise supplies that were non-compliant with chronic health-related Guidelines. Group B supplies were ranked according to chronic HRIs derived from annual maximum numerical values (Equation 9), whereas Group C supplies were ranked according to HRIs derived from frequencies of samples exceeding their respective Guidelines (Equation 12). These two types of chronic HRIs were not combined because the former type can be interpreted as the annual chance of exceeding a chronic health Guideline, whereas the latter are estimates of the increase in chronic health risk due to consuming the measured (maximum) concentration over the whole year.
The first three supplies in Group B (Nauiyu, Umbakumba and Beswick) have substantially elevated chronic HRIs, as do the first four supplies in Group C (Warburton, Wingellina, Pandanus Park and Burringurrah). However, the order in which resources for remediation should be supplied between these two Groups can only be arbitrary unless the data from Group C supplies are reanalysed to obtain HRIs based on annual maximum values.
This analysis of the publicly available data may not adequately indicate the extent of improvement required by the National Agreement on Closing the Gap. In particular, there are no data included for Remote Indigenous communities in NSW because the NSW Government does not require water suppliers to make their water quality data public.
Of the four jurisdictions that are included in this analysis, Wyrwoll’s Data for QLD contained a compliance indicator for only the microbial (E. coli) data. It is therefore uncertain whether QLD supplies were being monitored for the non-microbial substances listed unless they were non-compliant, in which case their data was included in Wyrwoll’s QLD spreadsheet. Examination of Wyrwoll’s “References” sheet confirmed that the non-microbial substances monitored varied substantially across QLD supplies.
More generally, it is uncertain whether all discrete Indigenous communities are included in the publicly reported data in all other jurisdictions, as required for tracking progress towards Target 9b. There are also no data publicly available pertaining to the Indigenous communities described in the second part of Target 9b – those supplied by nearby general communities. A list of such communities and associated monitoring sites is needed before the adequacy of drinking water quality monitoring can be assessed for this purpose.
Conclusion
More than three years has elapsed since the Closing the Gap target to provide safe drinking water was agreed, yet there is still no supporting measure to track its improvement reported on the Productivity Commission Dashboard. The NPR will eventually include data from smaller water suppliers, from which a suitable measure of their compliance with the ADWG could be derived. In the meantime, an equivalent jurisdictional and national measure of compliance was proposed and tested against our Dataset. This is the most comprehensive data available for Indigenous community water supplies, as it was extracted from the Supplementary Data of Wyrwoll et al. (2022). Additional measures were also proposed and tested to better inform jurisdictions on the effort required to reduce acute and chronic health risks to those recommended by the ADWG.
In our Dataset, there were more than 42,000 Indigenous people living in 48 discrete communities. More than a quarter of these people face either acute or chronic (lifetime) health risks (or both) from their water supply. Over 3,000 people in 14 communities face acute health risk from enteric pathogens, as indicated by positive E. coli samples. Over 9,000 people in 39 communities face chronic health risks as indicated by exceeding (sometimes more than twice) one or more Guidelines.
The Dataset was further analysed to obtain rankings of non-compliant water supplies for remediation, assuming that reducing (population-weighted) health risks took priority over reduction of chronic health risks. In particular, there were several supplies with very high associated health risks of each type.
The real situation may be worse than these results indicate, firstly because VIC and TAS did not identify Indigenous communities and NSW does not provide any drinking water quality data publicly. Consequently, only data from NT, QLD, SA and WA jurisdictions are included even though there are known Indigenous communities in NSW and VIC. It is also questionable whether all relevant Indigenous communities have been identified even in the jurisdictions included in Wyrwoll’s Data.
Part ii of Target 9b concerns meeting jurisdictional standards in Indigenous communities supplied with water from nearby towns. There is little indication from Wyrwoll’s Data that monitoring of these supplies has been separated from that of the nearby towns. For example, there is only one entry in the NT spreadsheet for Alice Springs, yet there is a significant population in nearby “town camps” that are not separately mentioned. To include the safety of these communities’ supplies in the proposed Dashboard indicator requires separate population estimates and new water quality monitoring at these locations.
Appropriate population-weighted measures to track progress towards the water safety component of Target 9b in the Closing the Gap Agreement were proposed, which adequately account for the differences between jurisdictions in defining and monitoring water safety. They are robust enough to accommodate the inclusion of more communities, more water quality parameters and any frequency of sampling.
Some measures were also used to establish an initial priority ranking for all Indigenous supplies that publish their water quality data to indicate the concerted action required at jurisdictional level, if the Target is not on track (as required by Clause 91 of the Agreement). A similar analysis should be made of the Data update currently being undertaken by Wyrwoll (pers. comm.) when it becomes available in 2025, to identify the further action required.
Nomenclature
The Authors
Dr Ian Fisher
is a Director of Watervale Systems, a company specialising in modelling and measurement of water quality in distribution systems. He was formerly Sydney Water’s Principal Scientist for Drinking Water, responsible for designing Sydney’s first trace substance surveillance. Ian was also foundation co-ordinator of the CRCWQT’s Distribution System research program.
Dr George Kastl
is a chemical engineer whose PhD focused on optimising drinking water treatment processes to reduce organic carbon and stabilise chlorine disinfectant. With over thirty years’ experience in the water industry, George has worked with major water utilities and leading consultancies, contributing to innovative solutions in water treatment.
Professor Arumugam Sathasivan
is Professor in Environmental Engineering in the School of Engineering, Design and Built Environment, Western Sydney University, with over thirty years’ academic and industrial experience in water and wastewater. For drinking water, he works to improve water quality in distribution systems via treatment, disinfection and modelling.
References
Bureau of Meteorology 2024. The National performance report 2022–23: Urban water utilities. http://www.bom.gov.au/water/npr/npr_2022-23.shtml
Bureau of Meteorology 2025. The National performance report 2023–24: Urban water utilities. http://www.bom.gov.au/water/npr/index.shtml
National Indigenous Australians Agency 2024. Commonwealth Closing the Gap 2023 Annual Report and 2024 Implementation Plan. https://www.niaa.gov.au/resource-centre/commonwealth-closing-gap-2023-annual-report-and-2024-implementation-plan.
National Agreement on Closing the Gap 2020. https://www.closingthegap.gov.au/national-agreement/national-agreement-closing-the-gap.
National Health and Medical Research Council (NHMRC) 2024. Australian Drinking Water Guidelines 6 version 3.9. https://www.nhmrc.gov.au/about-us/publications/australian-drinking-water-guidelines
Productivity Commission 2024, Closing the Gap Annual Data Compilation Report July 2024, Canberra.
US Environmental Protection Authority (USEPA) 2024. Understanding the Final PFAS National Primary Drinking Water Regulation Hazard Index Maximum Contaminant Level. Fact Sheet. https://www.epa.gov/system/files/documents/2024-04/pfas-npdwr_fact-sheet_hazard-index_4.8.24.pdf
World Health Organization (WHO) 2022.
Guidelines for drinking-water quality: fourth edition incorporating the first and second addenda. https://www.who.int/publications/i/item/9789240045064.
Wyrwoll, P., Manero, A., Taylor, K., Rose, E., and Grafton, R. 2022. Measuring the gaps in drinking water quality and policy across regional and remote Australia. npj Clean Water (2022) 5:32 ; https://doi.org/10.1038/s41545-022-00174-1.
Documents
 Dataset
Share