


Biofiltration’s effect on removing pollutants in stormwater

First published in Water e-Journal Vol 8 No 1 2022.
The use of a biofiltration system in Western Sydney demonstrates effectiveness in removing solids and nutrients.
DOWNLOAD THE PAPER
Abstract
Stormwater treatment performance monitoring has been undertaken for a high flow rate biofiltration system at Western Sydney, NSW, Australia. The system has a total area of 1.45m2 (0.34% of catchment) and 0.53m depth of Filterra® filter media, with a design treatment flow rate of 1.42 L/s – and receives runoff from a car-park area of 420m2. Influent and effluent water quality samples were collected using automated samplers, which were connected to pre-configured and calibrated flow analysis of treated effluent and sample pacing (with remote communication and data access). Collected samples were delivered to and analysed in a NATA-accredited laboratory for pH and concentrations of suspended solids and nutrient species. The biofiltration system was monitored between June 2019 and September 2020, with a total of seventeen (17) qualifying runoff events recorded during this period. Results demonstrated that the high flow rate biofiltration system was able to achieve significant reductions in stormwater pollutant concentrations, with a concentration reduction efficiency ratio for total suspended solids (TSS), total phosphorus (TP) and total nitrogen (TN) of 81, 83 and 49% respectively after the 12-month establishment period.
Introduction
Over recent decades, the implementation of stormwater control measures (SCMs) to achieve a more water sensitive urban environment and reduce the hydrologic and water quality impacts of urban development has increased across Australia (and overseas) (Ma et al 2019, Hermawan et al 2019, Dalrymple et al 2018). Biofiltration systems (also called biofilters, bioretention basins, bioretention systems, bioswales and raingardens) are one of the most commonly used SCMs given their flexible design, space efficiency and applicability at a variety of scales (Water by Design, 2014).
Filterra® biofiltration systems are a type of high flow rate biofiltration system that are similar to a typical biofiltration system. A key difference, however, is that Filterra® biofiltration systems utilise a filter media blend in a depth filter configuration which can treat flows at a significantly higher flow rate than typical biofiltration filter media which are configured as cake filters (Lenhart et al 2015). Filterra® biofiltration systems can achieve comparable stormwater pollution reduction performance with significantly less area (typically 0.3% of upstream area) (Smolek et al (2018), Herrera Environmental Consultants (2014)) relative to typical biofiltration systems (with sandy loam media, typically 1 to 2% of upstream area).
There are approximately 9000 Filterra® biofiltration systems in USA, including systems that have undergone extensive stormwater treatment performance monitoring at Virginia (Shaw et al 2006, Richardson et al 2009, Contech 2016), Washington (Herrera 2014), and North Carolina (Smolek et al 2018).
Whilst Filterra® biofiltration systems have also been installed at locations within Australia, there had previously been a lack of treatment performance monitoring at a ‘real world’ site within Australia. Study authors and the Engineering Department of the Western Sydney University subsequently developed and implemented a Filterra® biofiltration system to assess its performance within Australia.
Method
Site Details
The site is located at a car park in Western Sydney, Kingswood, NSW, Australia (hereafter referred to as ‘the site’). The car park is swept periodically, but minor amounts of sediment and organic debris are typically present at the car park. The car park consists entirely of an impervious asphalt surface and has a high usage rate.
An aerial photo of the site from January 2018 is shown in Figure 1. An example photo of the car park is provided in Figure 2.
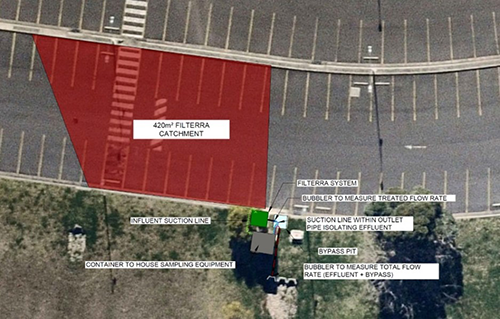
Figure 1: Aerial photo of the site, catchment and equipment
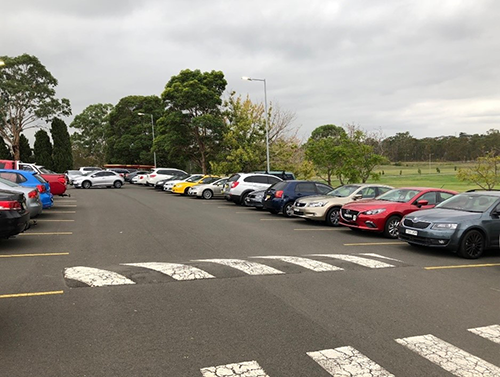
Figure 2: Example photo of the car park
A Filterra® biofiltration system was installed at the southern edge of the car park. The system receives runoff from an area of 420m2 (which is 100% impervious), determined by land survey and site inspections. The catchment is illustrated in Figure 1.
The Filterra® biofiltration system was installed at the site in April 2018. The system has a total area of 1.45m2 (0.34% of catchment) and 0.53m depth of Filterra® filter media, with a design treatable flow rate of 1.42 L/s. Slotted pipes are located within a gravel surround (immediately below the Filterra® filter media).
Example photos of the Filterra® biofiltration system are provided in Figure 3. A schematic of the system is provided in Figure 4.
Figure 3: Example photos of the Filterra® biofiltration system and sampling facilities at the site
Figure 4: Schematic plan drawing of Filterra® biofiltration system at site
Figure 5: Schematic section drawing of Filterra® biofiltration system at site
The Filterra® biofiltration system at the site has been maintained in accordance with typical/ standard maintenance procedures for these assets. In summary, the system is maintained approximately every twelve (12) months. Specific maintenance activities undertaken have been: inspection of Filterra® biofiltration system and surrounding area; temporary removal of tree grate to access filter media surface; removal of debris, litter and mulch; mulch replacement; and plant health evaluation and pruning, as necessary.
Sampling Design
The equipment and sampling techniques used for this study were in accordance with the Project Plan developed by Ocean Protect in consultation with both City of Gold Coast’s (2016) Development Application Requirements and Performance Protocol for Proprietary Devices and Stormwater Australia’s (2018) Stormwater Quality Improvement Device Evaluation Protocol Field Monitoring. The Project Plan generally satisfied most conditions outlined in both field testing protocols detailed below in Table 1.
|
Criteria |
Requirement |
|
Minimum number of aliquots |
> 8 |
|
Minimum storm coverage |
> 50% of storms have >70% hydrograph coverage |
|
Antecedent dry period |
> 6 hours |
|
Minimum Rainfall Depth |
minimum required to take a composite sample |
|
Minimum Storm Duration |
5 minutes |
Ocean Protect personnel were responsible for the installation, operation, and maintenance of the sampling equipment. Ocean Protect personnel provided sample retrieval, system reset, and sample submittal activities. Water sample processing and analysis was performed by ALS and Western Sydney University.
A small double-door cabinet was provided, installed, maintained, and operated by Ocean Protect personnel for sampling purposes. The cabinet is a fully enclosed, self-contained stormwater monitoring system, specially designed and built by Ocean Protect for remote, extended-deployment stormwater monitoring.
Influent and effluent water quality samples were collected using individual ISCO 6712 Portable Automated Samplers configured for 9.5 litre wide-mouth carboy bottles with disposable sample liners for sample collection. The influent sampler was equipped with an ISCO 730 Bubbler Weir module, connected directly to the ISCO 6712 sampler, and installed within a pre-configured and calibrated 152mm diameter Thel-Mar Weir for flow measurement of treated effluent and sample pacing. Flow rates were recorded every minute.
The bubblers were regularly checked for calibration by submersing the weir in water and setting the depth on the sampler with the bubbler module to the depth measured. The tables for the flow against height are provided by Thel-mar and input into the samplers.
Rainfall was measured at 1-minute intervals using two (2) 0.25mm resolution ISCO 674 tipping bucket-type rain gauges, securely installed on the container and regularly inspected. The two (2) rain gauges were installed approximately 1 m apart and results were compared periodically to ensure accuracy.
Sample strainers and flow measurement equipment were secured to the invert of the influent and effluent pipes using stainless steel spring rings with all components supplied and setup in general accordance with ISCO’s guidelines. Each sampler was also connected to an ISCO 6712Gi Global Digital Cell Phone Modem (two) to allow for remote communication and data access. Effluent samples were sampled prior to mixing effluent flows with any bypass flows.
Samplers were programmed to enable the sampling program to trigger on flow. Once enabled, the samplers collected flow-proportional samples allowing the specified pacing volume to pass before taking a sample. Due to the variability among precipitation events, the sample pacing specifications were varied in consultation with the most up-to-date precipitation forecasts and remotely programmed by Ocean Protect personnel prior to all storm events.
Following a precipitation event, Ocean Protect personnel communicated with the automated sampling equipment to confirm sample collection and then to dispatch personnel to retrieve the samples and reset the automated sampling equipment. Samples where then split using the appropriately sized Bel-Art’s Churn Splitter – one for the influent and one for the effluent to reduce the likelihood of contamination and to provide subsamples in accordance with the manufacturer’s guidelines. Sub-samples were delivered to ALS (a NATA-accredited laboratory) on ice (<4o C) and accompanied by chain-of-custody documentation and analysis was carried out in accordance with Table 2.
|
Parameter |
Abbreviation |
Analytical method |
Limit of Reporting |
|
Ammonia as N |
Amm.N |
APHA 4500 NH3- - G |
0.01 mg/L |
|
Nitrate + Nitrite as N |
NOx |
APHA VCl3 reduction 4500 NO3- + NO2-B |
0.01 mg/L |
|
Nitrate as N |
- |
APHA VCl3 reduction 4500 NO3- + NO2-B |
0.01 mg/L |
|
Nitrite as N |
- |
APHA 4500 NO2- - I |
0.01 mg/L |
|
Total Kjeldahl Nitrogen (TKN) as N |
TKN |
APHA 4500 Norg – D + APHA 4500 NH3-G |
0.1 mg/L |
|
pH (pH units) |
pH |
APHA 4500 H+ - B |
0.01 pH units |
|
Phosphorus Total as P |
TP |
APHA 4500 P - F |
0.01 mg/L |
|
Filtered Total Phosphorous as P |
Ortho-P |
APHA 4500 P - F |
0.01 mg/L |
|
Phosphorus Reactive as P |
DP |
APHA 4500 P – F |
0.01 mg/L |
|
Solids - Suspended Solids - Standard level |
TSS |
APHA 2540 D |
5 mg/L |
Sampling design
The Filterra® biofiltration system was monitored between June 2019 and September 2020, with a total of seventeen (17) qualifying runoff events recorded during this period. Figure 6 illustrates the timing of the sampling events compared to a time series of rainfall data recorded at the site. Table 3 also provides a summary of recorded rainfall at the site and flow discharged from the system.
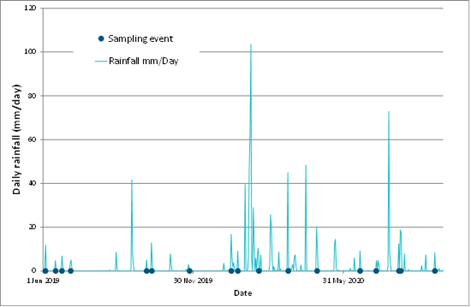
Figure 6: Time series of site rainfall and timing of sampling events
|
Event Date |
Max. rainfall intensity (mm/hr) |
Mean rainfall intensity (mm/hr) |
Total rainfall (mm) |
Total runoff volume (L) |
Peak flow (L/s) |
Mean flow (L/s) |
Sampling duration (hr) |
Sampling coverage (%) |
Number of aliquots |
|
3 Jun 2019 |
7.62 |
0.64 |
12.7 |
4856 |
1.003 |
0.068 |
10.7 |
100% |
68 |
|
16 Jun 2019 |
12.70 |
0.33 |
4.8 |
1814 |
0.958 |
0.034 |
10.7 |
99% |
47 |
|
23 Jun 2019 |
7.62 |
0.50 |
6.9 |
2232 |
0.741 |
0.046 |
9.0 |
99% |
39 |
|
4 Jul 2019 |
12.70 |
0.31 |
8.6 |
3192 |
0.913 |
0.032 |
9.0 |
23% |
32 |
|
5 Oct 2019 |
10.16 |
0.47 |
5.1 |
765 |
0.461 |
0.020 |
5.1 |
99% |
18 |
|
11 Oct 2019 |
12.70 |
0.87 |
10.4 |
2436 |
1.146 |
0.056 |
6.8 |
99% |
41 |
|
26 Nov 2019 |
15.24 |
0.22 |
1.5 |
210 |
0.538 |
0.008 |
2.2 |
99% |
6 |
|
16 Jan 2020 |
17.78 |
0.64 |
17.0 |
4652 |
1.146 |
0.049 |
14.5 |
79% |
50 |
|
24 Jan 2020 |
17.78 |
0.56 |
7.6 |
1786 |
1.196 |
0.036 |
6.4 |
89% |
28 |
|
18 Feb 2020 |
43.18 |
1.32 |
10.4 |
2168 |
2.024 |
0.076 |
1.1 |
98% |
72 |
|
25 Mar 2020 |
88.90 |
2.63 |
45.2 |
7058 |
2.024 |
0.114 |
1.2 |
82% |
80 |
|
29 Apr 2020 |
81.28 |
2.08 |
21.8 |
3812 |
2.024 |
0.101 |
1.4 |
83% |
45 |
|
21 Jun 2020 |
25.40 |
0.71 |
8.9 |
1787 |
1.731 |
0.040 |
6.3 |
54% |
35 |
|
10 Jul 2020 |
7.62 |
0.24 |
6.1 |
822 |
0.194 |
0.009 |
16.3 |
67% |
28 |
|
7 Aug 2020 |
10.16 |
0.73 |
12.4 |
2387 |
0.278 |
0.039 |
11.8 |
99% |
36 |
|
9 Aug 2020 |
22.86 |
1.03 |
29.7 |
6874 |
0.577 |
0.066 |
22.7 |
99% |
44 |
|
20 Sep 2020 |
12.70 |
0.69 |
8.9 |
1981 |
0.499 |
0.043 |
6.4 |
86% |
24 |
Results and Discussion
Table 4 provides the results of the monitoring. Table 5 provides the calculated concentration reduction efficiencies (CREs). Table 6 provides a statistical summary of the monitoring results. Table 7 provides the influent nitrogen speciation percentages. Table 8 also provides a comparison of influent EMC values recorded at the site and those given in MUSIC modelling guidelines within Australia by Water By Design (2010), BMT WBM (2015) and Melbourne Water (2018). Table 9 provides a comparison of the percentage fraction of total nitrogen as dissolved nitrogen against that recommended in the E2DesignLab (2015) report Development Application Requirements and Performance Protocol for Proprietary Devices on the Gold Coast and Blacktown City Council’s (2020) Water sensitive urban design (WSUD) developer handbook – MUSIC modelling and design guide. Table 10 provides a summary comparison of biofiltration performance monitoring at various sites, including the study site, other Filterra® biofiltration systems, and typical biofiltration systems.
|
Event Date |
fTSS (mg/L) Influent |
TSS (mg/L) Effluent |
DP (mg/L) Influent |
DP (mg/L) Effluent |
TP (mg/L) Influent |
TP (mg/L) Effluent |
NOx (mg/L) Influent |
NOx (mg/L) Effluent |
NH3 (mg/L) Influent |
NH3 (mg/L) Effluent |
DIN (mg/L) Influent |
DIN (mg/L) Effluent |
TKN (mg/L) Influent |
TKN (mg/L) Effluent |
TN (mg/L) Influent |
TN (mg/L) Effluent |
|
3 Jun 2019 |
29.0 |
9.0 |
0.010 |
0.010 |
0.040 |
0.005 |
0.200 |
0.220 |
0.190 |
0.120 |
0.390 |
0.340 |
0.600 |
0.300 |
0.800 |
0.520 |
|
16 Jun 2019 |
16.0 |
2.5 |
0.020 |
0.020 |
0.050 |
0.005 |
0.250 |
0.200 |
0.360 |
0.150 |
0.610 |
0.350 |
0.600 |
0.300 |
0.850 |
0.500 |
|
23 Jun 2019 |
30.0 |
6.0 |
0.005 |
0.005 |
0.070 |
0.010 |
0.150 |
0.170 |
0.220 |
0.060 |
0.370 |
0.230 |
0.600 |
0.100 |
0.750 |
0.270 |
|
4 Jul 2019 |
26.0 |
2.5 |
0.030 |
0.005 |
0.130 |
0.020 |
0.610 |
0.200 |
0.470 |
0.030 |
1.080 |
0.230 |
1.200 |
0.300 |
1.810 |
0.500 |
|
5 Oct 2019 |
36.0 |
10.0 |
0.005 |
0.005 |
0.060 |
0.020 |
0.620 |
0.300 |
0.340 |
0.110 |
0.960 |
0.410 |
0.800 |
0.300 |
1.420 |
0.600 |
|
11 Oct 2019 |
90.0 |
2.5 |
0.005 |
0.005 |
0.120 |
0.005 |
0.260 |
0.190 |
0.260 |
0.100 |
0.520 |
0.290 |
0.400 |
0.100 |
0.660 |
0.290 |
|
26 Nov 2019 |
138.0 |
41.0 |
0.005 |
0.020 |
0.760 |
0.040 |
0.280 |
0.750 |
0.005 |
|
0.285 |
0.750 |
3.900 |
0.700 |
4.180 |
1.450 |
|
16 Jan 2020 |
92.0 |
11.0 |
0.020 |
0.005 |
0.290 |
0.050 |
0.700 |
0.840 |
0.760 |
0.410 |
1.460 |
1.250 |
2.300 |
1.300 |
3.000 |
2.140 |
|
24 Jan 2020 |
98.0 |
36.0 |
0.005 |
0.010 |
0.160 |
0.070 |
0.320 |
0.440 |
0.370 |
0.160 |
0.690 |
0.600 |
1.200 |
0.700 |
1.520 |
1.140 |
|
18 Feb 2020 |
13.8 |
2.5 |
0.005 |
0.005 |
0.080 |
0.067 |
0.450 |
0.373 |
0.288 |
0.157 |
0.738 |
0.530 |
0.425 |
0.233 |
0.875 |
0.607 |
|
25 Mar 2020 |
39.0 |
2.5 |
0.005 |
0.005 |
0.150 |
0.020 |
0.180 |
0.190 |
0.320 |
0.060 |
0.500 |
0.250 |
0.400 |
0.200 |
0.580 |
0.390 |
|
29 Apr 2020 |
52.0 |
8.0 |
0.005 |
0.005 |
0.120 |
0.030 |
0.140 |
0.210 |
0.250 |
0.140 |
0.390 |
0.350 |
0.800 |
0.400 |
0.940 |
0.610 |
|
21 Jun 2020 |
8.0 |
2.5 |
0.005 |
0.005 |
0.010 |
0.005 |
0.060 |
0.060 |
0.120 |
0.060 |
0.180 |
0.120 |
0.200 |
0.050 |
0.260 |
0.110 |
|
10 Jul 2020 |
15.0 |
2.5 |
0.005 |
0.005 |
0.040 |
0.005 |
0.260 |
0.180 |
0.170 |
0.060 |
0.430 |
0.240 |
0.600 |
0.200 |
0.860 |
0.380 |
|
7 Aug 2020 |
11.0 |
2.5 |
0.005 |
0.005 |
0.020 |
0.005 |
0.210 |
0.110 |
0.230 |
0.070 |
0.440 |
0.180 |
0.400 |
0.200 |
0.610 |
0.310 |
|
9 Aug 2020 |
39.0 |
2.5 |
0.005 |
0.005 |
0.040 |
0.005 |
0.060 |
0.050 |
0.210 |
0.005 |
0.270 |
0.055 |
0.300 |
0.050 |
0.360 |
0.100 |
|
20 Sep 2020 |
26.0 |
2.5 |
0.040 |
0.005 |
0.080 |
0.010 |
0.005 |
0.060 |
0.010 |
0.005 |
0.015 |
0.065 |
0.300 |
0.100 |
0.305 |
0.160 |
|
Mean |
44.6 |
8.6 |
0.011 |
0.007 |
0.131 |
0.022 |
0.280 |
0.267 |
0.269 |
0.106 |
0.549 |
0.367 |
0.884 |
0.325 |
1.164 |
0.593 |
|
Median |
30.0 |
2.5 |
0.005 |
0.005 |
0.080 |
0.010 |
0.250 |
0.200 |
0.250 |
0.085 |
0.440 |
0.290 |
0.600 |
0.233 |
0.850 |
0.500 |
*: Italicised values were recorded as below the laboratory level of reporting (LOR) and are presented as being equal to half of the LOR.
|
Event Date |
TSS CRE% |
DP CRE% |
TP CRE% |
NOx CRE% |
NH3 CRE% |
TKN CRE % |
DIN CRE% |
TN CRE% |
|
3 Jun 2019 |
69% |
0% |
88% |
-10% |
37% |
50% |
13% |
35% |
|
16 Jun 2019 |
84% |
0% |
90% |
20% |
58% |
50% |
43% |
41% |
|
23 Jun 2019 |
80% |
0% |
86% |
-13% |
73% |
83% |
38% |
64% |
|
4 Jul 2019 |
90% |
83% |
85% |
67% |
94% |
75% |
79% |
72% |
|
5 Oct 2019 |
72% |
0% |
67% |
52% |
68% |
63% |
57% |
58% |
|
11 Oct 2019 |
97% |
0% |
96% |
27% |
62% |
75% |
44% |
56% |
|
26 Nov 2019 |
70% |
-300% |
95% |
-168% |
100% |
82% |
-163% |
65% |
|
16 Jan 2020 |
88% |
75% |
83% |
-20% |
46% |
43% |
14% |
29% |
|
24 Jan 2020 |
63% |
-100% |
56% |
-38% |
57% |
42% |
13% |
25% |
|
18 Feb 2020 |
82% |
0% |
17% |
17% |
46% |
45% |
28% |
31% |
|
25 Mar 2020 |
94% |
0% |
87% |
-6% |
81% |
50% |
50% |
33% |
|
29 Apr 2020 |
85% |
0% |
75% |
-50% |
44% |
50% |
10% |
35% |
|
21 Jun 2020 |
69% |
0% |
50% |
0% |
50% |
75% |
33% |
58% |
|
10 Jul 2020 |
83% |
0% |
88% |
31% |
65% |
67% |
44% |
56% |
|
7 Aug 2020 |
77% |
0% |
75% |
48% |
70% |
50% |
59% |
49% |
|
9 Aug 2020 |
94% |
0% |
88% |
17% |
98% |
83% |
80% |
72% |
|
20 Sep 2020 |
90% |
88% |
88% |
-1100% |
50% |
67% |
-333% |
48% |
|
Mean |
82% |
-9% |
77% |
-66% |
64% |
62% |
6% |
49% |
|
Median |
83% |
0% |
86% |
0% |
62% |
63% |
38% |
49% |
|
Analyte |
no. of events |
Range of Influent EMCs (mg/L) |
Median Influent EMC (mg/L) |
Mean Influent EMC (mg/L) |
Range of Effluent EMCs (mg/L) |
Median Effluent EMC (mg/L) |
Mean Effluent EMC (mg/L) |
Median Conc. Removal Efficiency (Mean CRE, %) |
Efficiency Ratio (ER, %) |
|
TSS |
17 |
8 - 138 |
30.0 |
44.6 |
2.5 - 41 |
2.5 |
8.6 |
83% |
81% |
|
DP |
17 |
0.005 - 0.04 |
0.005 |
0.011 |
0.005 - 0.02 |
0.005 |
0.007 |
0% |
31% |
|
TP |
17 |
0.01 - 0.76 |
0.080 |
0.131 |
0.005 - 0.07 |
0.010 |
0.022 |
86% |
83% |
|
NOx |
17 |
0.005 - 0.7 |
0.250 |
0.280 |
0.05 - 0.84 |
0.200 |
0.267 |
0% |
4% |
|
NH3-N |
17 |
0.005 - 0.76 |
0.250 |
0.269 |
0.005 - 0.41 |
0.085 |
0.106 |
62% |
61% |
|
DIN |
17 |
0.015 - 1.46 |
0.440 |
0.549 |
0.055 - 1.25 |
0.290 |
0.367 |
63% |
33% |
|
TKN |
17 |
0.2 - 3.9 |
0.600 |
0.884 |
0.05 - 1.3 |
0.233 |
0.325 |
38% |
63% |
|
TN |
17 |
0.26 - 4.18 |
0.850 |
1.164 |
0.1 - 2.14 |
0.50 |
0.59 |
49% |
49% |
|
Event Date |
% of NOx as % of TN |
NH3 as % of TN |
DIN as % of TN |
TKN as % of TN |
|
3 Jun 2019 |
25% |
24% |
49% |
75% |
|
16 Jun 2019 |
29% |
42% |
72% |
71% |
|
23 Jun 2019 |
20% |
29% |
49% |
80% |
|
4 Jul 2019 |
34% |
26% |
60% |
66% |
|
5 Oct 2019 |
44% |
24% |
68% |
56% |
|
11 Oct 2019 |
39% |
39% |
79% |
61% |
|
26 Nov 2019 |
7% |
0% |
7% |
93% |
|
16 Jan 2020 |
23% |
25% |
49% |
77% |
|
24 Jan 2020 |
21% |
24% |
45% |
79% |
|
18 Feb 2020 |
51% |
33% |
84% |
49% |
|
25 Mar 2020 |
31% |
55% |
86% |
69% |
|
29 Apr 2020 |
15% |
27% |
41% |
85% |
|
21 Jun 2020 |
23% |
46% |
69% |
77% |
|
10 Jul 2020 |
30% |
20% |
50% |
70% |
|
7 Aug 2020 |
34% |
38% |
72% |
66% |
|
9 Aug 2020 |
17% |
58% |
75% |
83% |
|
20 Sep 2020 |
2% |
3% |
5% |
98% |
|
Mean |
26% |
30% |
56% |
74% |
|
Median |
25% |
27% |
60% |
75% |
|
Parameter |
Site Influent (mg/L) |
Water By Design (2010)1 |
BMT WBM (2015)2 |
eWater, Melbourne Water (2016)3 |
|
TSS EMC |
44.7 |
269 |
269 |
270 |
|
TP EMC |
0.131 |
0.501 |
0.501 |
0.500 |
|
TN EMC |
1.164 |
1.82 |
2.19 |
2.20 |
|
Parameter |
Site |
E2DesignLab (2015)1 |
Blacktown City Council (2020) |
||
|
Mean |
Range |
Typical |
Minimum Mean |
Minimum Mean |
|
|
% fraction of TN dissolved |
56% |
5 to 86% |
Approx. 50% |
40% |
25% |
|
Reference |
Biofiltration system details |
Methodology summary |
TSS ER (%) |
TP ER (%) |
TN ER (%) |
|
Current study |
Western Sydney, NSW, Australia; installed April 2018, 1.45m2 area (0.34% of catchment); 0.53m deep Filterra® filter media; Bush Christmas’ Lilly Pilly (Syzygium australe) |
17 real events after ‘establishment’; flow & water quality monitored; 2019-21 |
81% |
83% |
49% |
|
Shaw et al (2006) |
Falls Church Virginia, USA; installed April 2018, 3.3m2 area (0.7% of catchment); 0.53m deep Filterra® filter media; unidentified shrub/ tree |
16 real events; flow and water quality monitored; 2004-2005 |
88% |
60% |
- (40% for TKN) |
|
Stanford (2009) |
7 simulated events; flow and water quality monitored; 2006-2007 |
- |
70% |
- |
|
|
Herrera (2014) |
Bellingham, Washington, USA; 2.2m2 area (0.13% of catchment); installed 2007, 0.53m deep Filterra® filter media; unidentified shrub/ tree |
22 real events; water quality monitored in 2013 |
94% |
70% |
- |
|
Contech (2016) |
Virginia Beach, Virginia, USA; 2.2m2 area (unknown catchment area); installed 2007, 0.53m deep Filterra® filter media; unidentified shrub/ tree |
92 real events; water quality monitored; 2008-2016 |
90% |
66% |
49% |
|
Smolek et al (2018): |
North Carolina State University, Fayetteville, North Carolina, USA; installed 2012, 2.2m2 area (0.22% of catchment); 0.53m deep Filterra® filter media; Crepe myrtle (Lagerstroemia spp) |
34 real events; flow & water quality monitored; 2013-14 |
95% |
64% |
27% |
|
Birch et al (2005) |
Sydney, NSW, Australia; 420m2 biofiltration system (approx..4% of catchment); up to 1.1m deep filter media (1:6 mixture of zeolite and coarse, pure quartzitic sand with a mean diameter of 2 mm.); unknown planting |
9 real events; water quality monitored; between October & December 1999 |
50% |
65% |
N/A |
|
Hunt et al (2006) |
Greensborough, North Carolina, USA; constructed 2000-01; two cells, 10m2 each (5% of catchment); both with 1.2m ‘organic sandy soil’ filter, cell G1 included 0.45 to 0.6m internal water storage, approx. 20m2 area; planted with river birch, common rush, yellow flag iris & sweetbay |
11 real events; flow & water quality monitored; 2002-03 |
N/A |
-409% (G1), -2900% (G2), |
224% (G1), -312% (G2) |
|
Davis (2007) |
Maryland, USA; installed 2003; 2 parallel cells, 26m2 area each (2.2% of catchment), Cell A 0.9m filter (50% sand, 30% topsoil, 20% hardwood mulch) with 80mm surface hardwood, Cell B as per Cell A but with 0.3m anaerobic sump (sand & newspaper mix); vegetated |
12 real events; water quality monitored; 2003-04 |
22% (Cell A), 41% (Cell B) |
74% (Cell A), 68% (Cell B) |
N/A |
|
McKenzie-McHarg et al (2008): |
Brisbane, QLD, Australia; 20m2 area (approx. 4% of catchment); 0.4m sandy loam filter media; vegetated |
4 simulated events between 2006-2007; 3000L dose per event; flow & water quality monitored |
87% |
83% |
28% |
|
Hatt et al (2009) |
Monash University, VIC, Australia; 3 cells, each 1.5m2 area (1% of catchment); 0.5m deep filter media (Cell 1, sandy loam; Cell 2, 80% sandy loam, 10% vermiculite, 10% perlite, by volume; Cell 3, 80% sandy loam, 10% compost, 10% hardwood mulch, by volume; dense planting (native sedges & rushes) |
Real events; water quality data for 38 events; flow data for 28 events; monitored 2006-2007 |
87% (Cell 1), 92% (Cell 2), 90% (Cell 3) |
-2140%(C1), -1286% (C2), -1423% (C3) |
18% (Cell 1), 0% (Cell 2), 18% (Cell 3) |
|
Hatt et al (2009) |
McDowall, Brisbane, QLD, Australia; constructed 2006; 20m2 area (2% of catchment); 0.4m deep sandy loam filter media; re-planted with Carex spp. in 2007 |
4 simulated events in June & October 2007 |
89% |
83% |
19% |
|
Roberts et al (2012): |
Wakerley, QLD, Australia; constructed 2007; 3 cells (955m2 each, 0.3% of catchment) with upstream sediment basin; sandy loam filter media; 0.9m saturated zone in Cell 3; variety of plant species
|
53 to 74 real events for each cell; water quality monitored 2009-10 |
36% (Cell 1), 53% (Cell 2), 44% (Cell 3) |
25%(Cell 1), 34%(Cell 2), 38% (Cell 3) |
-28% (Cell 1), -11% (Cell 2), 19% (Cell 3) |
|
Lucke et al (2015, 2017): |
Caloundra, QLD, Australia; constructed 2005; 3 systems (7m2 each); 0.9m depth sandy loam media; L.longifolia |
1 simulated event at each system at typical TSS/TP/TN concentrations#; approx. 2-year 30-min events; 2014 |
-25% |
90% |
18% |
|
Peljo et al (2016) |
Caloundra, QLD, Australia; constructed 2013; 4 systems approx.10m2 each (approx. 1% of catchment); 0.4m deep sandy loam filter media; Juncus & Carex spp |
2 simulated events at each of 4 systems in June 2015 |
91% |
83% |
33% |
|
Johnson et al (2019): |
Chapel Hill, North Carolina, USA; constructed 2001; 90m2 area (14% of catchment in 2002-03; 8% of catchment 2003-present); 1.2m deep sandy filter media; perennial grasses, trees & shrubs |
1st study: 10 real events; flow & water quality monitored; 2002-2003 2nd study: 18 real events; flow & water quality monitored; 2017-2018 |
N/A |
-21% (1st), 39% (2nd) |
-38 (1st), 26% (2nd) |
|
Bonneau et al (2020) |
Melbourne, VIC, Australia; 1800m2 biofiltration system (0.5% of catchment); 0.8m average filter depth (0.35m sandy loam, 0.1m sand, 0.05m gravel, 0.3m scoria) – with bottom 0.5m being a submerged zone (of un-lined basin); densely vegetated with a mixture of swamp grasses (e.g. Centella cordi folla, Amphibromus nervosus), sedges (e.g. Carex appressa) and common spike rush (e.g. Eleocharis acuta). |
13 real events analysed for water quality; 2013-2016 |
93% |
84% |
73% |
Flow
The design treatable flow rate of Filterra® biofiltration systems is 3560mm/hour (Lenhart et al 2015, Smolek et al 2018). Four (4) of the seventeen (17) events sampled exceeded this design treatable flow rate, with a peak measurement of 2.024 L/s (5060mm/hour) recorded for three (3) of the events. Due to the limitation of the flow capacity through the 152mm Thel-Mar weir, higher flow rates (above 2.024 L/s) through the system were unable to be qualified. The flow rate measured through the system were under typical operational conditions (i.e., 150mm peak hydraulic head filtering through all components of the system being the mulch layer, media layer (saturated) through to the underdrain). No mixing of bypass flows were possible to over-estimate the treatment flow rate recorded.
Suspended Solids
Significant reductions in TSS concentrations were recorded for all events, with a concentration ER of 81% (with concentration reductions ranging from 63 to 97%) for all qualifying events. Particle Size Distribution analysis was completed for three (3) events (24 January 2020, 29 April 2020 and 10 July 2020) with an average d50 of 53.6µm and 21.2µm for the influent and effluent respectively. The average d90 for the three events sampled indicates almost all particles above 100µm being removed by the Filterra® biofiltration system.
TSS concentrations in stormwater flowing from the car park catchment (and entering the Filterra® biofiltration system) were significantly lower than that recommended in MUSIC guidelines (see Table 8) for comparable land use. For example, the mean TSS concentration recorded in inflows to the Filterra® biofiltration system was 44.6mg/L, significantly lower than the guideline recommended EMC values of 269 and 270mg/L (see Table 8). As described by Neumann et al (2010), for example, it is easier for SCMs to achieve higher pollutant concentration reduction rates when runoff has higher pollutant concentrations. Higher TSS concentration reductions would subsequently be anticipated for the Filterra® biofiltration systems with higher TSS influent concentrations. Therefore, higher TSS concentration reductions would be likely for Filterra® biofiltration systems receiving flows with TSS concentrations similar to values recommended in the aforementioned guidelines.
Higher TSS concentration ERs were observed for Filterra® biofiltration systems assessed by Shaw et al (2006), Richardson et al (2009), Hererra (2015), Contech (2016), and Smolek et al (2018). These studies, however, recorded significantly higher TSS inflow concentrations (relative to the site), which (as described above) would favour higher TSS concentration reductions. The TSS inflow concentrations observed in all Filterra® biofiltration system monitoring studies to date were also significantly lower than those recommended in MUSIC Guidelines, indicating that higher TSS CREs would be likely at TSS concentrations closer to guideline values.
As summarised in Table 10, high TSS ER’s have been consistently observed for Filterra biofiltration systems. Whilst high TSS ER’s have been observed for other (typical) biofiltration systems outlined in Table 10, some studies have observed significantly lower TSS ER’s. This variable TSS ER for typical biofiltration systems may, however, be due to a range of factors, including (but not limited to) variable filter media characteristics, climatic conditions, influent concentrations and monitoring methodologies.
Nutrients
TP and TN concentration ERs observed across the system after establishment were 83% and 49% respectively. The ER for TP was higher than observed by the other Filterra® biofiltration studies given in Table 10. The ER for TN at the site was higher than that observed by Smolek et al (2018) but the same as that observed by Contech (2016).
TP and TN EMCs observed in flows to the Filterra® biofiltration systems at the site were significantly lower than that recommended by MUSIC guidelines (see Table 8). As for TSS, the ability of any SCM to reduce nutrient concentrations would be decreased at lower inflow concentrations.
The majority of the recorded phosphorus concentrations observed in flows to and from the Filterra® biofiltration system at the site consisted of particulate phosphorus, with relatively low concentrations of dissolved phosphorus. For nitrogen, a mean of 56% of recorded inflow concentrations were dissolved inorganic nitrogen (ranging from 5 to 86%), which complies with the recommended minimum mean of 40% given by E2DesignLab (2015) and minimum mean of 25% given by Blacktown City Council (2020).
As summarised in Table 10, high nutrient ER’s are consistently observed for Filterra® biofiltration systems. In comparison, nutrient ER’s for other biofiltration systems are highly variable, with several studies observing increases in nutrient concentrations across the biofiltration systems. As for TSS, this variable nutrient concentration reduction for other biofiltration systems may be due to a range of factors including (but not limited to) variable filter media characteristics, climatic conditions, influent concentrations and monitoring methodologies.
Conclusions
Stormwater treatment performance testing was undertaken for a Filterra® biofiltration system located in a car park at Western Sydney, NSW, Australia. The sampling and monitoring protocol was designed and implemented in consultation with both City of Gold Coast’s (2016) Development Application Requirements and Performance Protocol for Proprietary Devices and Stormwater Australia’s (2018) Stormwater Quality Improvement Device Evaluation Protocol Field Monitoring.
The performance testing at the site demonstrated that the Filterra® biofiltration system was able to achieve significant reductions in stormwater pollutant concentrations, with a concentration ER for TSS, TP and TN of 81, 83 and 49% respectively. These concentration reductions were achieved despite relatively low concentrations for TSS, TP and TN in incoming stormwater flows (which would be expected to decrease potential concentration reductions).
These results generally correlate with similar assessments of Filterra® biofiltration systems in the USA described by others and provide evidence of the ability of an appropriately designed, installed and operated Filterra® biofiltration system to provide a stormwater treatment function (and protect water quality within downstream waterways) within Australia. As Filterra® biofiltration systems require significantly less area relative to typical biofiltration systems (with sandy loam media), there is anticipated to be significant opportunity for their integration – particularly in highly constrained urban areas.
References
Birch, G F, Fazeli, M .S, Matthai, C, 2005, Efficiency of an infiltration basin in removing contaminants from urban stormwater, Environmental Monitoring and Assessment, I0I, 23-38.
BMT WBM. 2015. NSW MUSIC Modelling Guidelines. Prepared for Greater Sydney Local Land Services.
Bonneau J, Fletcher T D, Costelloe J F, Poelsma P J, James R B, Burns M J, 2020, The hydrologic, water quality and flow regime performance of a bioretention basin in Melbourne, Australia, Urban Water Journal, 2020, Vol 17, No. 4.
Contech Engineering Solutions, 2016, Filterra® Performance Over Time.
Dalrymple B, Coathup C, Coathup J, Penhallurick B, 2018. Point Break for the WSUD Asset Wave. Presented at Ozwater 2018, Melbourne, Australia.
Davis, A.P., 2007. Field performance of bioretention: water quality. Environ. Eng. Sci. 24, 1048e1064.
Drapper D, Lucke T. 2015. Characterisation of Stormwater Pollutants from Various Catchment types in South-east Queensland. Presented at the 2015 WSUD & IECA Conference.
E2DesignLab, 2015. Development Application Requirements and Performance Protocol for Proprietary Devices on the Gold Coast. Prepared for the City of Gold Coast, 2015, Originally Prepared by DesignFlow. Peer Reviewed and Amended by E2DesignLab.
eWater, 2014. MUSIC by eWater User Manual
Herrera Environmental Consultants. 2014. Technical Evaluation Report – Filterra® System Phosphorus Treatment and Supplemental Basic Treatment Performance Monitoring. Prepared for Americast Inc.
Hatt, B.E., Fletcher and T. D., Deletic, A. (2009). Hydrologic and pollutant removal performance of stormwater biofiltration systems at the field scale, Journal of Hydrology, 365, 310-321.
Hunt, W., Jarrett, A. R., Smith, J. T., & Sharkey, L. J. 2006. Evaluating Bioretention Hydrology and Nutrient Removal at Three Field Sites in North Carolina. Journal of Irrigation and Drainage Engineering, 2006, 132(6), 600-608.
Lucke T, Nichols P W B, 2015, The pollution removal and stormwater reduction performance of street-side bioretention basins after ten years in operation, Science of the Total Environment.
Lucke T, Dierkes C, Boogaard F, 2017, Investigation into the long-term stormwater pollution removal efficiency of bioretention systems, Journal of Water Science and Technology.
Johnson J P, Hunt W F, 2019, A Retrospective Comparison of Water Quality Treatment in a Bioretention Cell 16 Years Following Initial Analysis, Journal of Sustainability.
Lenhart J, Hills M, 2015. The Use and Verification of Micro Bioretention Systems in the United States, 9th International Water Sensitive Urban Design Conference and 3rd International Erosion Control Association Conference, Sydney, Australia, 2015.
Ma Y., Deilami K., Egodawatta P., Liu A., McGree J., Goonetilleke A., 2019. Creating a hierarchy of hazard control for urban stormwater management. Environmental Pollution, 255, 1, 2019.
McKenzie-McHarg, A., Smith, N. and Hatt, B. (2008). Stormwater Gardens to Improve Urban Stormwater Quality in Brisbane.
Melbourne Water. 2016. MUSIC Guideline – Recommended input parameters and modelling approaches for MUSIC users.
Neumann, L N, Sharma A. 2010. Literature Review on Performance Testing Approaches for Gross Pollutant Traps. CSIRO: Water for a Healthy Country National Research Flagship.
Ocean Protect, 2020. Filterra® Stormwater Bioretention Filtration System – Operation & Maintenance Manual.
Parker, N. 2010. Assessing the Effectiveness of Water Sensitive Urban Design in Southeast Queensland. Thesis submitted towards Masters of Engineering. Queensland University of Technology
Peljo, L., Dubowski, P., & Dalrymple, B. (2016). The Performance of Streetscape Bioretention Systems in South East Queensland. Paper presented at Stormwater Australia 2016 conference, Sydney.Stanford R S, 2009, Technical Report Addendum – Additional Field Testing and Statistical Analysis of the Filterra® Stormwater Bioretention Filtration System, submitted to Filterra Division of Americast Inc, ATR Associates Inc.
Roberts S J, Fletcher T D, Garnett L, Deletic A, 2012, Bioretention saturated zones: do they work at the large-scale? WSUD 2012 Conference, Melbourne, Australia.
Smolek A P, Anderson A R, Hunt W F. 2018. Hydrologic and Water-Quality Evaluation of a Rapid-Flow Biofiltration Device. Journal of Environmental Engineering 144(2), February 2018.
Shaw L Y, Stanford R S, 2006, Field Evaluation of the Filterra® Stormwater Bioretention Filtration System, submitted to Filterra Division of Americast Inc, University of Virginia.
Stormwater Australia, 2018. Stormwater Quality Improvement Device Evaluation Protocol Field Monitoring V1.3.
Taylor G. D., Fletcher T. D., Wong T. H. F., Breen P. F., Duncan H. P., 2005. Nitrogen Composition in Urban Runoff – Implications for Stormwater Management. Water Research, 2005, Vol 39, pp 1982-1989.
Water By Design. 2010. MUSIC Modelling Guidelines. Brisbane: South East Queensland Healthy Waterways Partnership.
Water By Design, 2014. Bioretention Technical Design Guidelines (Version 1). Healthy Waterways Ltd, Brisbane.
Author Biographies
Brad Dalrymple | Brad is a Principal Environmental Engineer at Ocean Protect and Adjunct Lecturer at Griffith University. Brad has over twenty years’ experience in various projects associated with environmental engineering, and has CPEng and RPEQ accreditation. Brad has been responsible for the planning, design and implementation of integrated water management and water sensitive urban design strategies for a range of applications – from many small-scale ‘retrofit’ projects, several high-profile and award-winning master-planned communities, and catchments and regions.
Michael Wicks | Michael has owned the company for almost a decade and leads the business’ technical direction and oversees research and development. He is responsible for new product development and managing the engineering design team at Ocean Protect ensuring cost-effective environmental outcomes for developments. He has a Bachelor of Engineering (Civil) from the University of Western Sydney and has 20+ years’ experience in the sector. He has sat on the committees of the NSW, Victoria and Queensland Storm Water Associations.
Warren Jones | Warren Jones is the Lead Engineer and Engineering Manager at Ocean Protect. Warren plays a key role in shaping Ocean Protect’s stormwater field testing capabilities, providing expertise from design and implementation through to collection and analysis. He has also designed, developed and deployed multiple software programs focused on automation of tasks and retrieval of information.
Blake Allingham | Since January 2019, Blake has been heavily involved in the design, implementation, operation and management of a range of stormwater treatment performance monitoring programs for Ocean Protect.
Share