


Using chloramine trials to determine the impacts of water disinfection

First published in Water e-Journal Vol 6 No 4 2021.
How a chloramine dosing trial program resulted in Queensland water customers receiving improved disinfection residuals and associated public health benefits at their meter.
DOWNLOAD THE PAPER
Abstract
Over 14-weeks during the Queensland summer (2019/2020), the chloraminated network received an elevated total chlorine residual (4.0 mg/L) as part of a trial to determine if this increased residual had any impact on improved disinfection residuals and reduced microbial detections in the Bulk and Water Supply Partners (Urban Utilities, Unitywater and Logan City Council) reticulated networks. Increased chloramine dosing was observed to improve the total chlorine residual in most of Seqwater’s bulk water network, however, it did not improve the secondary disinfection performance in areas known to have high water age due to network configuration. Observed and modelled information from the 2019/2020 summer trial demonstrated that some water quality indicators slightly improved, compared to the 2018/2019 summer. The primary objective of the trial was to increase the area of the network that held total chlorine residual >0.5 mg/L. The trial achieved this improvement for three reticulated zones in the Urban Utilities’ network, all of which were adjacent to Seqwater’s bulk water supply points. Network mode of operation was also critical. The increased chloramine dosing program resulted in an increased number of South East Queensland water customers receiving improved secondary disinfection residuals and associated public health benefits at their meter.
Introduction
The Regional Secondary Disinfection Optimisation Project (RSDOP) commenced in 2015 as a joint regional water quality partnership project. The core driver of the project was “optimising the existing secondary disinfection regime on a South East Queensland (SEQ) regional and subregional basis with the primary objective being to lower public health risks and secondly to lower cost”. The project membership includes all the SEQ Water Supply Partners (WSPs): Seqwater, City of Gold Coast, Logan City Council, Urban Utilities, Redland City and Unitywater, with Seqwater being the major contributor and undertaking project management. RSDOP was initiated to address issues about poor secondary disinfectant performance in some SEQ Water Supply Grid zones. It was to consider which disinfection regime was preferred in the SEQ Grid and determined that it was optimal to continue with a combined disinfectant regime, i.e. chloramine in the central scheme with chlorine dosing through break-point at poorer performing zones and remaining as free chlorine systems in the northern and southern regions (Figure 1). The study area for this paper is the zone represented in pink which encompasses both the bulk water supply and reticulated zones.
The RSDOP provides a basis for the development of an optimised management approach to secondary disinfection across the SEQ Grid, or ‘the Water Grid’, which meets the criteria of cost-effective operation and management practices, protecting public health, enhancing public trust and maintaining organisational reputation. Key performance measures for RSDOP’s assessment focused around the primary objective of secondary disinfection infrastructure improvement works, to achieve the target residual benchmarks set at ≥0.2 mg/L free chlorine and ≥0.5 mg/L monochloramine (measured as total chlorine).
In the Summer of 2016/2017, seven positive E. coli detections were recorded in Urban Utilities and Logan City Council’s reticulation schemes. While operational and climatic factors may have contributed to ingress and detection, these detections were recorded at times when residual disinfectant concentration did not reach Leading Practice levels, which are defined in SEQ as >2.5 mg/L total chlorine for reticulated reservoirs and 0.5 mg/L for reticulated networks (Table 1). Seqwater and the WSPs agreed to work collaboratively towards optimising current operational infrastructure to increase the effectiveness of disinfectant residual through the bulk and WSPs networks. An assessment of the different operational and capital investment strategies to achieve this outcome for Seqwater and its WSPs within the central chloraminated region (Figure 1) found the best net present value of cost and capital cost solution was to increase chloramine stability by an estimated 70% through Water Treatment Plant (WTP) upgrades to optimise pH at 8.0 to 8.4, and free ammonia < 0.1 mg/L, dissolved organic carbon < 3.5 mg/L via operational means and undertake network improvements. As this capital investment approach would take several years to adequately plan, develop and deliver, the increased chloramine dosing program was designed to investigate if a temporary period of increased chloramine dosing could be applied during periods of elevated network chloramine decay, typically occurring in the warmer months when water temperature is high (>27 degrees), with the aim of reducing the public health risk associated with accelerated chloramine decay until a permanent change in chloramine stability could be delivered.
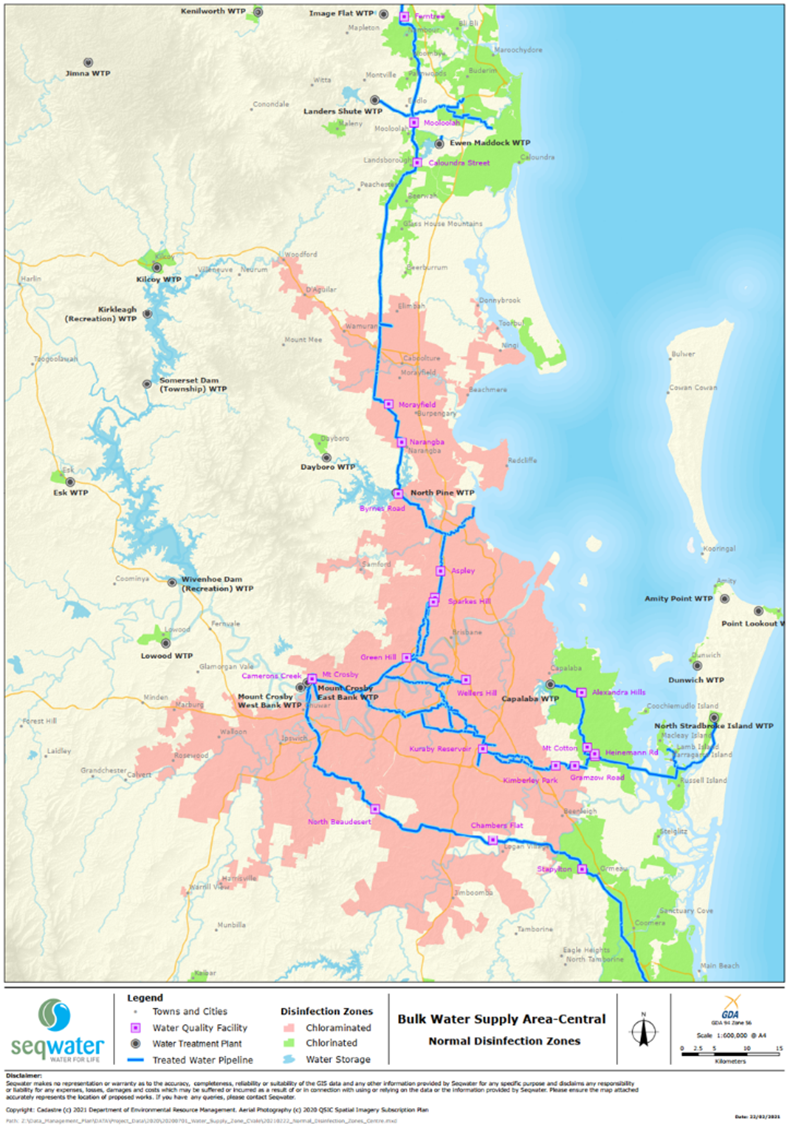
Figure 1: Disinfection Zone Mapping for the central region of the Water Supply Grid
Methodology
Trial Dosing and Monitoring: The increased chloramine trial aimed to assess if an increased starting concentration of the chloramine (measured as total chlorine) entering the network (i.e. leaving the Grid connected Water Treatment Plant (WTPs) and Water Quality Management Facilities (WQMFs)) from 3.3-3.5 mg/L up to 4.0 mg/L, would result in further penetration of disinfectant residual into the Water Supply Grid and reduced chloramine decay in storage reservoirs and pipes during period of high chloramine demand. The trial was conducted during the 2019/2020 summer and would be compared to the same period of time in 2018/2019 when increased chloramine dosing wasn’t occurring. This trial was designed to occur while maintaining the pH at similar levels to normal operation (pH ~7.7). This was to ensure that the stability of the chloramine residual is maintained at typical levels while also favouring the production of monochloramine and limiting the formation of dichloramine and trichloramine. The trial stipulates different water quality criteria and assessment levels across both the bulk and reticulated network taken from the Regional Partnership Water Quality Management Plan. There are three levels in the plan that were adopted for this trial, with different bulk and reticulated trigger limits for each level. “Leading Practice” is defined as optimal for SEQ conditions; “Monitor” conditions are at risk of generating a poor water quality outcome; and “Action” water quality parameters are poor and action needs to be taken to improve the performance outcomes. A subset of parameters from the Regional Partnership Water Quality Management Plan where adopted for the trial (Table 1) including: E.coli, Total Coliforms, Bulk and reticulated Total Chlorine and Total Trihalomethanes (tTHMS) which is the sum of bromodichloromethane, bromoform, dibromochloromethane, and chloroform.
|
Parameter |
Location |
Leading Practice |
Monitor |
Action |
|
E.coli
|
Bulk Suppler |
≥ 98% samples with E.coli <1 CFU/100mL |
< 98% samples with E.coli <1 CFU/100mL |
≥ 2 samples with E.coli ≥ 1 CFU/100mL in 12 months |
|
Reticulated Reservoir |
Reservoirs with ≥98% samples with E.coli <1 CFU/100mL |
Reservoirs with <98% samples with E.coli <1 CFU/100mL |
Reservoirs with ≥ 3ᶲ samples with E.coli ≥ 1 CFU/100mL in 12 months |
|
|
Reticulated Zone |
Zones/Schemes with ≥ 98% samples with E.coli <1 CFU/100mL |
No trigger |
Zones/Schemes with ≥ with ≥ 3ᶲ samples with E.coli ≥ 1 CFU/100mL in 12 months |
|
|
Disinfection indicator organisms (Total coliforms)
|
Bulk Suppler |
≥95% of samples with <1 CFU/100 mL |
≤95% of samples with ≤10 CFU/100 mL |
<97% of samples with <10 CFU/100 mL over 12 month reporting period |
|
Reticulated Reservoir |
Reservoirs with ≥95% of samples with <1 CFU/100 mL |
Reservoirs with <95% of samples with ≤10 CFU/100 mL |
Reservoirs with <97% of samples with <10 CFU/100 mL over 12 month reporting period |
|
|
Reticulated Zone |
Zones/schemes with ≥95% of samples with <1 CFU/100 mL |
Zones/schemes with <95% of samples with ≤10 CFU/100 mL |
Zones/schemes with <97% of samples with <10 CFU/100 mL over 12 month reporting period |
|
|
Chloramine (expressed as total chlorine)
|
Bulk Suppler |
≥95% of samples with free chlorine >3.0 mg/L |
<95% of samples with free chlorine ≥2.5 mg/L |
<90% of samples with total chlorine ≥2.0 mg/L over 12 month reporting period |
|
Reticulated Reservoir |
Reservoirs with ≥95% of samples with free chlorine >2.5 mg/L |
Reservoirs with <95% of samples with free chlorine ≥1.0 mg/L |
Reservoirs with <90% of samples with total chlorine ≥1.0 mg/L over 12 month reporting period |
|
|
Reticulated Zone |
Zone/schemes with ≥95% of samples with free chlorine >0.5 mg/L |
Zone/schemes with <95% of samples with free chlorine ≥0.5 mg/L |
Zone/schemes with <90% of samples with total chlorine ≥0.2 mg/L over 12 month reporting period |
|
|
tTHMs |
Bulk Suppler |
95th percentile for THM <0.10 mg/L |
95th percentile for THM >0.13 mg/L |
>1 sample with THM >0.16 mg/L over 12 month reporting period |
|
Reticulated Zone |
Zone/schemes where 95th percentile for THM <0.18 mg/L |
Zone/schemes where 95th percentile for THM >0.18 mg/L |
Zone/schemes with >1 sample with THM >0.25 mg/L over 12 month reporting period |
The trial investigated if this increased chloramine residual entering the network had an effect on the penetration throughout the Water Grid, with the primary aim of reducing the proportion of the network where total chlorine fell below “Leading Practice” target of 0.5 mg/L (regionally agreed target to minimise public health risk).
Chloramine dosing set-point at Seqwater’s Mt Crosby East and West Bank WTPs, North Pine WTP and two WQMFs (Aspley and Chambers Flat) was increased for 14 weeks from 02/12/2019 to 02/03/2020 (Figure 1). Extensive water quality monitoring across all WSPs’ bulk supplies and networks, along with operational information from WSPs’ boosting or breakpoint facilities, were used to assess the success of the trial against the key performance indicators (Table 1) of the trial’s effectiveness. The total chlorine set-point for the secondary disinfection process was increased from 3.3-3.5 to 4.0 mg/L for the duration of the trial. Ammonia is dosed proportionally to the chlorine residual and as such the dose rate was proportionally increased to maintain the chlorine to ammonia ratio to achieve monochloramine formation. Note that no change was made to either the primary disinfection chlorine residual or treated water pH set-points as part of this trial. Seqwater has 10 WQMFs in the network that are designed to boost secondary disinfectant levels by either chloramine top up or break-point waters, depending on the direction of flow and WSPs’ network specifications. For the trial, 125 locations were monitored weekly in the bulk and WSPs’ reticulated networks (52 reservoirs, 73 bulk and reticulated zones).
Water Quality Modelling: A review of the network operating conditions for both summer periods revealed that 2019/2020 summer generally had a higher water demand than in 2018/2019, and the network was under different underlying operating modes in both summers. These may also be key contributors to the observed improvement in network chloramine, and therefore network modelling was required to compliment the observational findings and aid in determining the attributable benefits from the network operations versus the increased chloramine dosing.
The following modelling methodology was then developed to understand whether increased chloramine set-point alone could result in significant network disinfection improvement to warrant this operational practice to be replicated in future summer periods. The modelling assessment was designed to isolate the potential secondary disinfection benefits and interactions between the key contributing parameters, namely increased network demands, increased dosing levels leaving the WTPs, and the changes in network operating mode (refer Table 2). To understand the performance of the Central sub-region (Figure 1) under the nominated water quality performance, the water quality assessment focuses on three key questions:
- Same demand, same mode, different WTP setpoint: What are the relative differences in secondary disinfection performance within the Central sub-region for the different WTP total chlorine dosing setpoints under the same operating mode and demand? The following scenarios were compared using this approach:
- Scenario 1 vs Scenario 3 (2019/2020 high summer demand).
- Scenario 5 vs Scenario 7 (2019/2020 normal summer demand).
- Scenario 2 vs Scenario 4 (2018/2019 high summer demand).
- Scenario 6 vs Scenario 8 (2018/2019 normal summer demand).
- Same demand, different mode, same WTP setpoint: What are the relative differences in secondary disinfection performance within the Central sub-region for the different operating modes under the same demand condition and the same WTP total chlorine dosing setpoint?
- Scenario 1 vs Scenario 4 (High demand, high WTP setpoint).
- Scenario 5 vs Scenario 8 (Normal demand, high WTP setpoint).
- Different demand, same mode, same WTP setpoint: For a given operating mode and a WTP total chlorine dosing setpoint, what is the relative impact on secondary disinfection performance from changes in the demand conditions?
- Scenario 2 vs Scenario 6 (Normal WTP setpoint, same operating mode).
These scenarios were then configured to the Regional Water Quality Network Model, which is a water network hydraulics and secondary disinfection modelling tool operated using the Innovyze InfoWater software. The model represents a skeletonised version of the whole-of-SEQ grid-connected network, including all of Seqwater’s assets and the WSP’s major distribution assets. The secondary disinfection model that was adopted was known as the “saturation model” which was developed specifically for the SEQ chloramine system. It describes an empirical relationship between the observed bulk chloramine decay rate coefficients and other seasonal environmental factors such as temperature and water age. Each modelling scenario produced an average modelled total chlorine residual for each model element (e.g. a model node, a pipe, a reservoir, etc) within the SEQ water-grid.
|
ID |
WTP Total Chlorine Setpoint |
Central Sub-region Demand |
Network Operating Mode |
Water Temp |
Comment |
|
1 |
High |
High summer (~715 ML/day) |
2019/20 (Southern Regional Water Pipeline (SRWP) in Northerly Flow Direction (NFD)) |
29 °C |
Model to simulate recorded info in 4/12/2019 – 10/12/2019. Modelled total chlorine residual results validated against sampling records in the same period. |
|
ID |
WTP Total Chlorine Setpoint |
Central Sub-region Demand |
Network Operating Mode |
Water Temp |
Comment |
|
2 |
Normal (~3 mg/L) |
High summer (~715 ML/day) |
2018/19 (Southern Regional Water Pipeline (SRWP) in Southern Flow Direction (SFD)) |
29 °C |
Model to simulate recorded info in 19/1/2019 – 25/1/2019. Modelled total chlorine residual results validated against sampling records in the same period. |
|
3 |
Normal (~3 mg/L) |
High summer (~715 ML/day) |
2019/20 (SRWP in NFD) |
29 °C |
|
|
4 |
High |
High summer (~715 ML/day) |
2018/19 (SRWP in SFD) |
29 °C |
|
|
5 |
High |
Normal summer (~580 ML/day) |
2019/20 (SRWP in NFD) |
28 °C |
Model to simulate recorded info in 1/1/2020 – 10/12/2019. Modelled total chlorine residual results validated against sampling records in the same period. |
|
6 |
Normal (~3 mg/L) |
Normal summer (~580 ML/day) |
2018/19 (SRWP in SFD) |
28 °C |
Model to simulate recorded info in 4/12/2019 – 10/12/2019. Modelled total chlorine residual results validated against sampling records in the same period. |
|
7 |
Normal (~3 mg/L) |
Normal summer (~580 ML/day) |
2019/20 (SRWP in NFD) |
28 °C |
|
|
8 |
High |
Normal summer (~580 ML/day) |
2018/19 (SRWP in SFD) |
28 °C |
|
Note: SRWP = Southern Regional Water Pipeline; NFD = Northerly flow direction; SFD = Southerly flow direction.
Results
Measured Results: All three WTPs in the trial were able to consistently maintain the target chloramine residual at an elevated level (>3.5 to <4.5 mg/L total chlorine) for the duration of the trial, generally being ≥4.0 mg/L, with these elevated levels being observed in the Seqwater network storages at >2.5 mg/L at most reservoirs. Reservoir and network nitrification in the grid was low, except for sites with significant water age challenges. Trends in tTHMs concentration and speciation observed at Cameron’s Hill Reservoirs and North Pine WTP track very closely with periods of elevated water temperature. Observed tTHMs levels in the chloraminated system ranged from 55 to 120 µg/L during the trial. An observed general increase in network-wide tTHMs in late February and early March is speculatively related to an increase in water age due to a reduction in network demand following a significant rainfall event in the SEQ region. It is known that the use of chloramine as a disinfectant significantly reduces the risk of the typical organic disinfection by-products. However, it is the precursor to several nitrogenated disinfection by-products that are typically indicated by n-nitrosodimethylamine (NDMA). NDMA is predominantly formed in the presence of dichloramine. As the formation at Cameron’s Hill is optimised towards monochloramine formation, it should not be present at significant concentration. Monitoring for NDMA was undertaken fortnightly at reference sites and all samples returned results of <5 ng/L, which is the limit of reporting for the analysis and is consistent with historic performance. Chlorate is a by-product of the sodium hypochlorite dosed as the source of chlorine. The increased amount of sodium hypochlorite dosed to increase the total chlorine residual to 4.0 mg/L increases the potential for elevated chlorate concentrations. Seqwater has a rigerous chemical monitoring program and stock management system to ensure chlorate levels are managed below health criterea limits. The monitoring undertaken during the trial indicated that chlorate was maintained at acceptable levels, with the current Seqwater Water Quality Criteria for this parameter being 0.8 mg/L, with a maximum detected of 0.4 mg/L at Chambers Flat WQMF. This is consistent with the concentration typically detected during summer at these network dosing facilities, which have significantly less dosing than that at WTPs, resulting in longer chemical storage times and subsequent increased chlorate formation potential. There was a reduction in customer complaints in the 2019/2020 summer compared to the preceding summers recorded by Unitywater, Logan City Council and Urban Utilities. The link to the program is tenuous, however, as the trial should not have positively impacted (at a customer observable level) many customers’ observable factors such as taste, odour, illness and discoloured water. There was no change in the level of illness complaints, which is not surprising as the benefit of improved secondary disinfection residual is only likely to manifest at detectable levels as a result of a contamination event. Results from the monitoring of 125 locations in summariesed in Table 3.
|
Category |
Parameter |
Location |
Comment |
|
Micro-biology
|
E.coli
|
Bulk or Reticulated Reservoir |
All sites remained unchanged between years at Leading Practice for: Seqwater, Urban Utilities and Unitywater, except Logan City Council which saw an increase from 2 of 3 Leading Practice to 3 of 3 Leading Practice. Overall, no significant change (1 reservoir) was observed between the trial and baseline dosing conditions. |
|
Bulk Network or Reticulated Zone |
All sites remained unchanged between years at Leading Practice for: Seqwater, Logan City Council and Unitywater, except Urban Utilities, which saw an increase from 53 of 55 Leading Practice to 55 of 55 Leading Practice in the 2019/2020. Overall, a slight change (2 zones) was observed between the trial and baseline dosing conditions. |
||
|
Disinfection indicator organisms (Total coliforms)
|
Bulk or Reticulated Reservoir |
Seqwater remained unchanged between years, while Urban Utilities saw an increase in Leading Practice reservoirs from 16 of 30 to 22 of 31 in 2019/2020. Unitywater saw a decrease from 4 of 4 to 3 of 4 reservoirs being Leading Practice in 2019/2020, with Logan City Council reversing the trend, going from 2 of 3 to 3 of 3 reservoirs achieving Leading Practice in 2019/2020. Overall, a moderate change (6 reservoirs changed to Leading Practice and 1 dropped to Monitor) was observed between the trial and baseline dosing conditions. |
|
|
Bulk Network or Reticulated Zone |
Seqwater and Urban Utilities both observed moderate increases in Leading Practice between the two years (improvements of 2 and 5 zones respectively), while Unitywater saw a reduction from 2 of 4 to 1 of 4 zones Leading Practice, and an increase in the number of sites at Action level. Logan City Council remained unchanged. Overall, a slight improvement was observed between the trial and baseline dosing conditions. |
||
|
Chemical Chemical |
Chloramine (expressed as total chlorine)
|
Bulk or Reticulated Reservoir |
Seqwater and Urban Utilities both experienced a small increase in the number of sites reaching Leading Practice between the two years (2 and 3 additional sites respectively), with Logan City Council and Unitywater sites all failing to reach Leading Practice in both summers. Unitywater was the only WSP to see a reduction in Action level reservoirs from 30 of 30 to 26 of 31. Overall, a moderate change (5 reservoirs changed to Leading Practice) was observed between the trial and baseline dosing conditions. |
|
Bulk Network or Reticulated Zone |
In the reticulated zone, both Seqwater and Urban Utilities had 3 more zones reach Leading Practice during 2019/2020, with no zones in the Logan City Council or Unitywater areas of operation reaching Leading Practice. Of the 73 supply zones, only 6 were Leading Practice in 2018/2019, with the increased chloramine trial period only resulting in 12 for the 2019/2020. While this is an increase, at the customer tap, this increase is only 3 zones (as the others were Seqwater bulk network) and appears to only benefit Urban Utilities supply schemes. |
||
|
Disinfection By-products |
tTHMs |
Bulk Network or Reticulated Zone |
Logan City Council and Seqwater remained unchanged, while Urban Utilities saw 1 zone move to Leading Practice in 19/20, and Unitywater saw 3 of 4 zones move to Leading Practice. Of note, all 4 Unitywater zones moved out of Action level between the two years. Overall, a moderate change to Leading Practice was observed between the trial and baseline dosing conditions. |
Modelled Results: Each scenario produced an average modelled total chlorine residual for each demand area within the SEQ water-grid (Figure 2 is an example of one of the scenarios). In addition, comprehensive assessment of the relative impacts of changes in the above modelling parameters were also charted in key network locations (typically at the inlets of outlets of major network storages).
Using the nominated comparison approach:
- By comparing the same demand, same mode, different WTP setpoint scenarios, direct benefits in secondary disinfection performance is observed with increased total chlorine levels leaving the WTP for the same operating mode and demand conditions.
- By comparing the same demand, same WTP setpoint, different mode scenarios, the Southern Regional Water Pipeline (SRWP) operation, in particular its throughput volume and operating direction, has a signficant but varying impact on the secondary disinfection performance in various locations within the Central region.
- When the SRWP was operating in a southerly flow direction (SFD), higher than target level of secondary disinfection performance was simulated for the Ipswich region; however, in the detriment of the northern Central region (north of Sparkes Hill) and Logan.
- When the SRWP was operating in a northerly flow direction (NFD), higher than target level of secondary disinfection performance was simulated for the Logan and northern Central region; however, in the detriment of the southern Moreton (north of Narangba) area.
- Overall secondary disinfection benefit across the Central system was modelled when the SRWP is operating at high throughput in an NFD.
- By comparing the same WTP setpoint, same mode, different demand scenarios, direct secondary disinfection residual benefit was modelled with increased demands across the Central sub-region; however, Seqwater cannot actively control the water demands throughout the network.
Other site specific modelling outcome observations include:
- Total chlorine residual improvement is simulated in most of the major Seqwater reservoirs within the Central sub-region, with an increased total chlorine setpoint at the North Pine WTP, the Mt Crosby WTPs and the Chambers Flat WQMF. However, increasing total chlorine setpoint at the regional WTPs alone did not appear to improve the secondary disinfection performance in areas that are known to have very high water age due to network configuration challenges (e.g. lack of dedicated reservoir inlet/outlet mains) and potentially localised nitrification issues (e.g. at Kimberley Park).
- The central “spine” (Green Hill – Sparkes Hill – Aspley service reservoirs) (Figure 2) is typically the interaction zone between treated waters from the North Pine and Mt Crosby WTPs and is therefore very sensitive to the modelled demand distribution and operating mode within this part of the network. The following issues are of note:
- The pipeline between the Aspley and Sparkes Hill reservoirs is where significant sub-daily total chlorine residual fluctuations is typically simulated, irrespective of the total chlorine levels leaving the WTPs.
- In addition, the Aspley WQMF is unable to be operated when the interaction zone is between the Aspley and Sparkes Hill reservoirs, creating challenges in improving the secondary disinfection performance under this operating mode.
- The Sparkes Hill Reservoir #2 (the biggest Seqwater reservoir within the Central sub-region) was offline for upgrade works in both summers. The inclusion of this reservoir will increase overall water age and is likely to worsen the secondary disinfection performance.
- The Southern Regional Water Pipeline (SRWP) was operating in a Northerly Flow Direction (NFD) at a high flow rate (~100 ML/day) for an extended period over the 2019/2020 summer (January 2020). This operating mode is represented by Scenario 5 and represents the best total chlorine performance along the SRWP and the Central “spine”. The high flow volume significantly reduces the water age in the SRWP and increases the total chlorine residual simulated in the North Beaudesert Balance Tank (NBBT). Higher total chlorine residuals will likely be experienced in both the Logan south and Ipswich central and eastern areas during this period.
- The higher flow volumes through the SRWP in an NFD also allowed more treated water from the Mt Crosby WTPs to be sent north through the central “spine”, creating uni-directional flow along the entire central network and into the northern Moreton Bay Regional Council serviced by Unitywater (Petrie and Narangba). The uni-directional operation of the central “spine” significantly reduces water age within the central areas of the Brisbane supply system (e.g. around Sparkes Hill). Furthermore, the ability to re-chloraminate at the recently constructed Aspley WQMF means that this generally represents the best operating mode for water quality performance within the central sub-region.
- Minimum flow through the SRWP in either direction (Scenarios 3 and 6) resulted in approximately 2.5 mg/L of total chlorine being simulated south of NBBT #1. This may cause disinfection residual challenges in Logan or Ipswich.
The adopted decay kinetics were developed at a relatively high-level using system data collected in 2013-2015 for strategic level planning disinfection management undertaken for RSDOP. Whilst the adopted chloramine decay profile should remain valid and a good representation of the Mt Crosby treated water chloramine decay, given that there have been no significant treatment process changes at the Mt Crosby WTPs, it also assumes that all other chloraminated water sources perform similarly to the Mt Crosby WTP supply (e.g. supply from the North Pine WTP and NFD in the SRWP through the Chambers Flat WQMF). The modelling results are in line with the observed secondary disinfection performance of the network during the increased chloramine trial. In those parts of the network where reservoirs are nitrifying and water age management is difficult due to single inlet and outlet valves, and other network configuration issues, no improvement in secondary disinfection performance was observed.
While the adopted total chlorine decay kinetics can generally simulate the recorded secondary disinfection performance within the central sub-region, there are observed discrepancies between the simulated and recorded total chlorine residuals. This is most notable when the water age is low and when the initial WTP total chlorine setpoint is high (e.g. at Green Hill reservoirs), or where there may be localised effects of increased total chlorine decay (e.g. Kimberley Park reservoir).
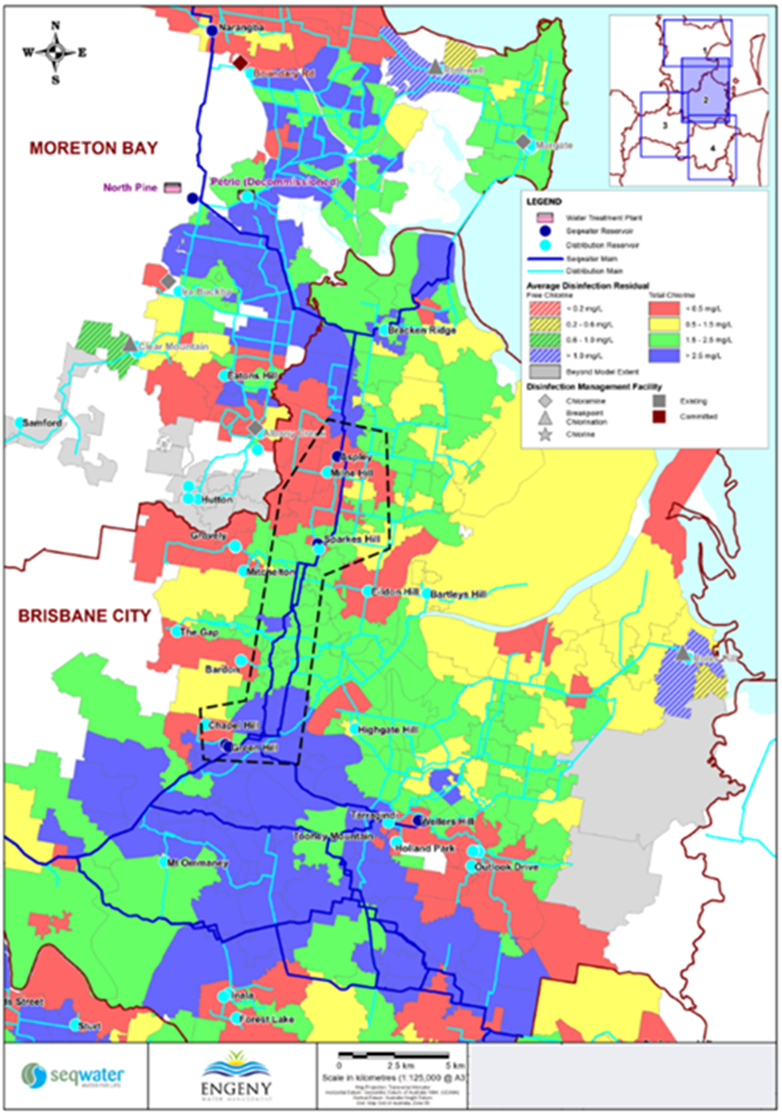
Figure 2: Modelled total chloramine bulk and reticulated network concentrations under scenario 6. Dashed line polygon represents the Central Spine.
Discussion
The modelling program was able to verify that the observed secondary disifnection improvement within the network during the trial period can be attributed to the increased total chlorine set-point at the WTPs and WQMFs. However, modelling also shows that increased set-point alone did not appear to improve the secondary disinfection performance in areas that are known to have very high water age due to network configuration challenges and potentially localised nitrification issues.
The importance of water age management and source water quality was also strongly drawn out in the modelling assessment, with network operations and flow directions as per the Seqwater Water Security Program significantly impacting the water supplied. This was most signifcantly observed in the Logan City Council region, which observed a significant change in water age between the two summers. This change was due to dropping dam levels in Lake Wivenhoe during the 2019/2020 summer, resulting in Logan City Council being supplied with water flow from the SRWP in a northerly flow direction, bringing water from the desalination plant with less chloramine decay than water supplied from the Mt Crosby WTPs. Feedback from the retail WSPs is that timing of commencement of increased chloramine residual operation is critical, as well as the level at which the increased dosing takes place. If the trial starts too late in the spring and summer, the increased chloramine levels are overwhelmed by established biological chloramine decay (including nitrification). Therefore, early application of increased dosing may significantly delay onset of elevated chloramine decay in the water distribution system.
Nitrifying microorganisms use inorganic carbon as a carbon source. Heterotrophic microbes use organic carbon as a carbon source. Both are involved in decomposing chloramine. In the drinking water network, a significant fraction (90-95%) of microorganisms reside in the biofilm found on the surfaces of pipelines and reservoirs and are reported as significantly contributing to chloramine decay. Recent grey literature work, delivered by the University of Western Sydney as part of an Australian Research Council Linkage project, found that chloramine concentration should be maintained above 1.5 mg/L in SEQ to overcome and suppress the biological decay of chloramine residuals in service reservoirs. It is further recommended that following a number of chloramine decay studies undertaken since 2015, chloramine decay functions used for water modelling studies in SEQ be updated based on best available science and more recent system performance data, including data collected during this prolonged increased chloramine trial. Further learnings are relevant to both increased chloramine dosing operation and the RSDOP recommendations around pH increase. Learnings identified optimising location and operation of breakpoint facilities to minimise operating costs, while ensuring chlorine residual penetration in the network. This also has implications for improved tTHM management, i.e. having the systems ideally located to maintain secondary disinfection residuals without creating increased THM management challenges.
The increased chloramine setpoint program resulted in apporximately $200,000 of additional treatment chemicals spread across multiple WTPs, WQMFs and WSP’s boosting and breakpoint facilities. However, compared to the number of people served in the Central sub-region, the cost per person implications were quite small. The program is only intended as a stop-gap until the longer term increased chloramine stability program can be fully delivered in 2023/2024
Conclusion
Monitoring and modelled results indicated increased dosing, reduced water age and network configuration all aided in trial success. More granular monitoring and modelling will be used to determine if sub-zone benefits can be achieved, even if entire zones don’t meet the minimum requirements. The purpose of this is to understand the additional number of SEQ customers who might benefit from this program, even if 100% of a supply zone doesn’t meet the 0.5 mg/L total chlorine target. These results will be used to inform decision-making about permanent increased chloramine residual entering the central sub-region during spring and summer until the pH increase and chloramine stabilisation program is operational.
Acknowledgement
All authors would like to acknowledge those staff in their respective organisations who have contributed to the data collections, network operations and operational guidance that have enabled this trial to be undertaken.
Author Biographies
Cameron Veal | Cameron is a PhD qualified scientist with more than 10 years’ experience in water quality related roles in both consulting and state based utilities. Cameron is Lead Water Quality (Public Health) at Seqwater where he leads the delivery of Seqwater’s Drinking Water Quality Management Program.
Charlene Wong | Charlene is a Chemical Engineer and Finance graduate at Aurecon with more than 7 years of experience in developing and integrating technical engineering solutions complex infrastructure problems. Working closely with multiple water utilites Charlene has provided technical support for the water industry in her time in consulting.
Paul Sherman | Paul is Principal Scientist in the City & Regional Future team of Urban Utilities. Paul is a scientist with over 40 years water quality experience working for a range of State Government departments and water utilities. Paul has a passion for water quality and public health.
Phil Wetherell | Phil is the Water Service Quality and Sustainability Program Leader for Logan Water. He is a scientist with over 15 years of experience in the water and mining industries. Phil is passionate about practical scientific solutions, communication and clean water and sanitation more broadly.
Duncan Middleton | Duncan has more than 15 years’ experience in drinking and recycled water quality management and monitoring. His work has included some of the largest and most advanced drinking and recycled water schemes in the ACT and Queensland. Duncan is currently the Principal Product Quality for Seqwater.
Jennifer Wain | Jennifer in the Water Quality Manager at Unitywater and has more than 10 years’ experience in laboratory, water quality specialist and water quality management roles. Jen has strong background in Biomedical, Environmental and Public Health which she has keenly applied to drinking water management especially through distribution systems.
Share