


Silicon carbide membranes: Piloting a cost-effective solution for future upgrades at Mount Pleasant WTP


Abstract
The Mount Pleasant Water Treatment Plant (WTP) is complex, featuring two distinct process streams - a conventional and a polymeric membrane stream - to treat River Murray water. The variability in river water quality and limitations on chemical dosing upstream of the polymeric membranes often force a trade-off between plant capacity and premature irreversible fouling. Compounded by increasing network demand, there is an urgent need for capacity and process upgrades at Mount Pleasant. As an alternative to costly capital upgrades requiring significant civil works, SA Water piloted silicon carbide membranes on site. Across a range of scenarios, the membranes demonstrated excellent physical and water quality performance and impressive flux rates. Silicon carbide membranes are a viable future option for water treatment, offering operational benefits and cost savings for large capital upgrades.
Introduction
The Mount Pleasant WTP was commissioned in 2001 to supply Adelaide Hills customers of Mount Pleasant, Springton and Eden Valley with filtered River Murray water. The treatment process selection at the time of design incorporated new technology and allowed for research and development opportunities. As a result, the Mount Pleasant treatment process is complex; consisting of two process streams each with a nominal capacity of 1.25 ML/day. Stream one is a conventional treatment process and stream two is a polymeric membrane process.
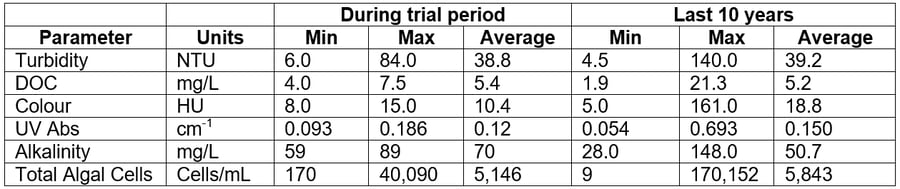
The fluctuating quality of the River Murray source water (Table 1) often creates complexity in operating the two streams at full capacity while ensuring the supply of safe and clean drinking water. Over the past decade, the current polymeric membranes have been replaced, on average, every two years due to irreversible fouling. To extend the lifespan of the current membranes, a recommended approach was to limit chemical addition upstream of the membranes. As a result, the production capacity of this stream is reduced during challenging source water events, in particular taste and odour, and algal events. Combined with increasing demand in the network supply area, there is an urgent need for capacity and process upgrades at Mount Pleasant. To avoid expensive capital upgrades requiring significant civil works, the purpose of this investigation was to find a solution capable of processing larger volumes compared to polymeric membranes, without the need to increase the plant’s footprint. It was equally important that any option demonstrate excellent resistance to fouling, even with highly variable source water quality, while also being efficient and robust. A solution needed to offer flexibility in dosing the necessary chemicals upstream to meet current and future water quality objectives.
A pilot plant using silicon carbide (ceramic) membrane technology was set up at Mount Pleasant to assess flux rates and product water quality under various source water challenge scenarios. To increase the membrane capacity from 1.25 ML/d to 4 ML/d without significant civil works or increased footprint, a minimum flux rate of 300 L/hr/m2 (LMH) is necessary.
Table 1: Mt Pleasant Water Quality Data
Pilot design
Membrane selection
Cembrane silicon carbide (ceramic) flat-sheet membranes were selected for the trial. With a slightly larger pore size of 0.1 μm (as compared to the current polymeric membrane at 0.04 μm) and made from a highly hydrophilic material, they offer higher flux and lower transmembrane pressure (TMP), providing a compact solution with lower energy consumption. Their chemical resistance enables more intensive cleaning when necessary, reducing downtime and operator intervention, while also extending membrane life.
Pre-treatment and pilot arrangement
Raw water, sourced from the River Murray via the Mannum-Adelaide pipeline, is delivered to the WTP from the Mount Pleasant pumping station. The inlet pressure to the plant was found to be adequate to consistently supply raw water to the pilot plant and ultimately a slightly elevated flocculation tank. The pilot pre-treatment equipment (Figure 1) was designed to resemble the existing Mount Pleasant membrane pre-treatment operation.
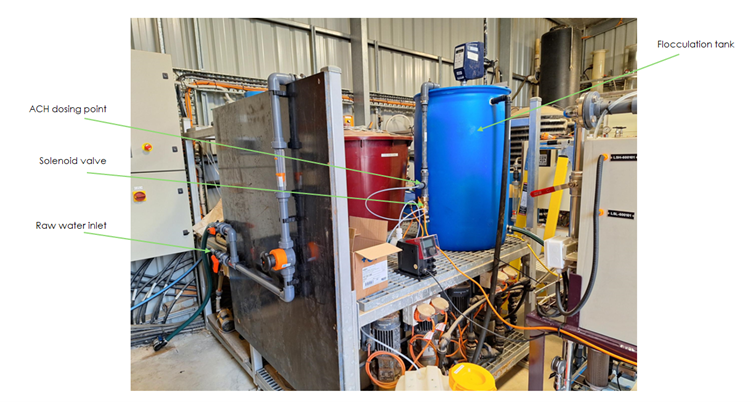 Figure 1: Pilot arrangement
A globe valve at the inlet to the pilot plant regulates the flow, followed by ACH coagulant dosing and static mixing. The coagulated flow is directed into the top of the flocculation tank, with a residence time ranging from 30 to 60 minutes, dependent on flow rate. The flocculated water gravity feeds the membrane tank (Figure 2), containing six submerged ceramic flat-sheet membranes. Filtration takes place from the outside in using suction pressure. Suspended solids and particulates are rejected on the membrane surface forming a cake layer, while clean water permeates through the membrane. The filtrate collects into the two end blocks and is directed to the filtrate tank via a common manifold pipe.
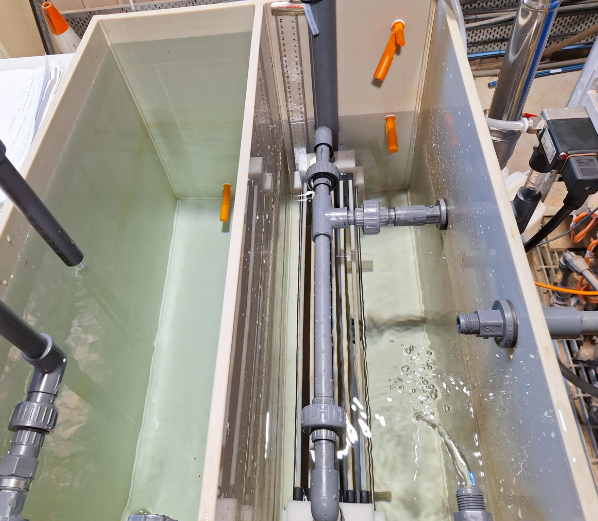 Figure 2: Membrane and filtrate tank
Periodically, a small volume of filtrate is reversed and back-pulsed from the inside to the outside of the membrane, dislodging the solids that have accumulated on the membrane surface. To improve the recovery rate, this backwash water remains in the membrane tank to be refiltered, rather than being wasted from the system.
Following a pre-defined number of back-pulses, the membrane tank is automatically drained, disposing of the concentrated solids. The number of cycles between tank drains controls the recovery of the plant. Both the excess filtrate and membrane tank waste are indirectly pumped back to the head of the main plant for recycling.
The membranes are routinely chemically cleaned with varying combinations and concentrations of sodium hypochlorite, sodium hydroxide, citric acid and sulphuric acid to remove stubborn fouling and reset between trial scenarios. Chemical waste is disposed of to the site lagoons.
Trial methodology
Baseline permeability
Measuring the permeability of new membranes on treated water provides a reference point for the duration of the trial. The pilot was operated for two days using potable water to establish this baseline.
Comparison of permeability before and after cleaning allowed for the evaluation of fouling and cleaning effectiveness. Tracking permeability change over time, as compared to baseline, offered insights into potential irreversible fouling. The accumulation of irreversible foulants, especially under varying source water conditions, will provide guidance on likely membrane life at Mount Pleasant.
Baseline operation
To compare the fouling rate without coagulant dosing, the pilot was operated for seven days using only raw water. Adjustments were made to the flux rate, filtration time, back-pulse frequency and tank drain cycle until a stable state was reached. Grab samples were collected and analysed on site to assess turbidity performance.
Operation with optimal ACH coagulant dosing of 20 mg/L commenced at a flux rate of 220 LMH. The flux rate was periodically increased to 470 LMH over several months. With a goal of achieving 300 LMH or better, TMP, backwash pressure, permeability and water quality performance were routinely checked. A TMP of 55 kPa would trigger an automatic shutdown of the pilot plant to prevent any damage to the membranes.
With each flux rate increase, chemical cleans were usually undertaken first, and back-pulse intervals were adjusted accordingly. At all times, a recovery rate of equal to or greater than 87% was targeted, to match or improve on the recovery during stable operation of the polymeric membrane plant.
Impact of coagulant dosing
After establishing operational performance, a moderate reduction in coagulant dosing was made to assess the effect on flux, fouling rates, recovery and TMP. A series of samples were collected and analysed in the laboratory to assess permeate quality.
Due to occasional unplanned disruptions to the pilot plant, such as raw water feed loss, coagulant dosing pump failures and extended outages, there was an opportunity to evaluate both short-term dosing failures and overdosing of ACH, as well as performance associated with returning membranes to service after an unexpected outage.
Fouling
Due to the problematic short life of the polymeric membranes at Mount Pleasant WTP, a critical aspect in the pilot trial was how effectively the ceramic membranes could be recovered with chemical cleaning. Throughout the pilot trial period, various combinations of clean-in-place (CIP) occurred on the polymeric membranes using sodium hypochlorite, sodium hydroxide, oxalic acid, citric acid and sulphuric acid. The irreversible rates of fouling on the polymeric membranes significantly increased during challenging water quality events and at flux rates greater than 22 LMH.
Throughout the trial, while maintaining a constant flux rate, TMP increase across time was used as an indicator of membrane fouling that could not be removed by back-pulse alone. Chemical cleaning combinations and concentrations were trialled for effectiveness. Following each clean, permeability measurements were compared to previous as-clean results as well as baseline results.
Challenging water quality
Prolonged high algal activity in the river can necessitate the need for powdered activated carbon (PAC) dosing to control taste and odour causing compounds. The current supplier recommendation at Mount Pleasant is to not dose PAC ahead of the polymeric membranes due to past evidence of plugging of the membrane pores and carbon deposition leading to rapid irreversible fouling. To trial the impact of carbon dosing on ceramic membranes, a PAC dose of 20 mg/L was applied directly into the flocculation tank. Continuous monitoring of foulant accumulation and physical membrane performance occurred.
Likewise, elevated algal cell concentrations have historically impacted the performance of polymeric membranes, leading to a rapid decline in permeability. An algae concentration of 15,000 cells/mL, representing 90th percentile concentration over last 10 years, was introduced into the pilot plant flocculation tank to assess the impact on flux, fouling and permeate quality.
Validation testing
Since Mount Pleasant is a drinking water treatment plant, any potential membrane must meet the log reduction requirements for virus, protozoa and bacteria as part of the multiple barrier approach to safe drinking water supply.
Onsite testing was conducted, with an approach supported by SA Health, using yeast and MS-2-bacteriophage as surrogate indicators to quantify the log reduction of protozoa and viruses, respectively, across the coagulation/filtration barrier of the pilot plant.
Discussion and results
Physical membrane performance
Raw water operation (without coagulant dosing) commenced at 220 LMH with an 83% recovery rate. As the rapidly increasing TMP neared the shutdown limit, operation became unsustainable. As a result, both the flux rate and filtration time were reduced, stabilising at 120 LMH with a 58% recovery. Efforts to increase recovery by making small adjustments to back-pulse frequency and filtration time were also unsustainable, as the TMP quickly approached the operational limit (Figure 3).
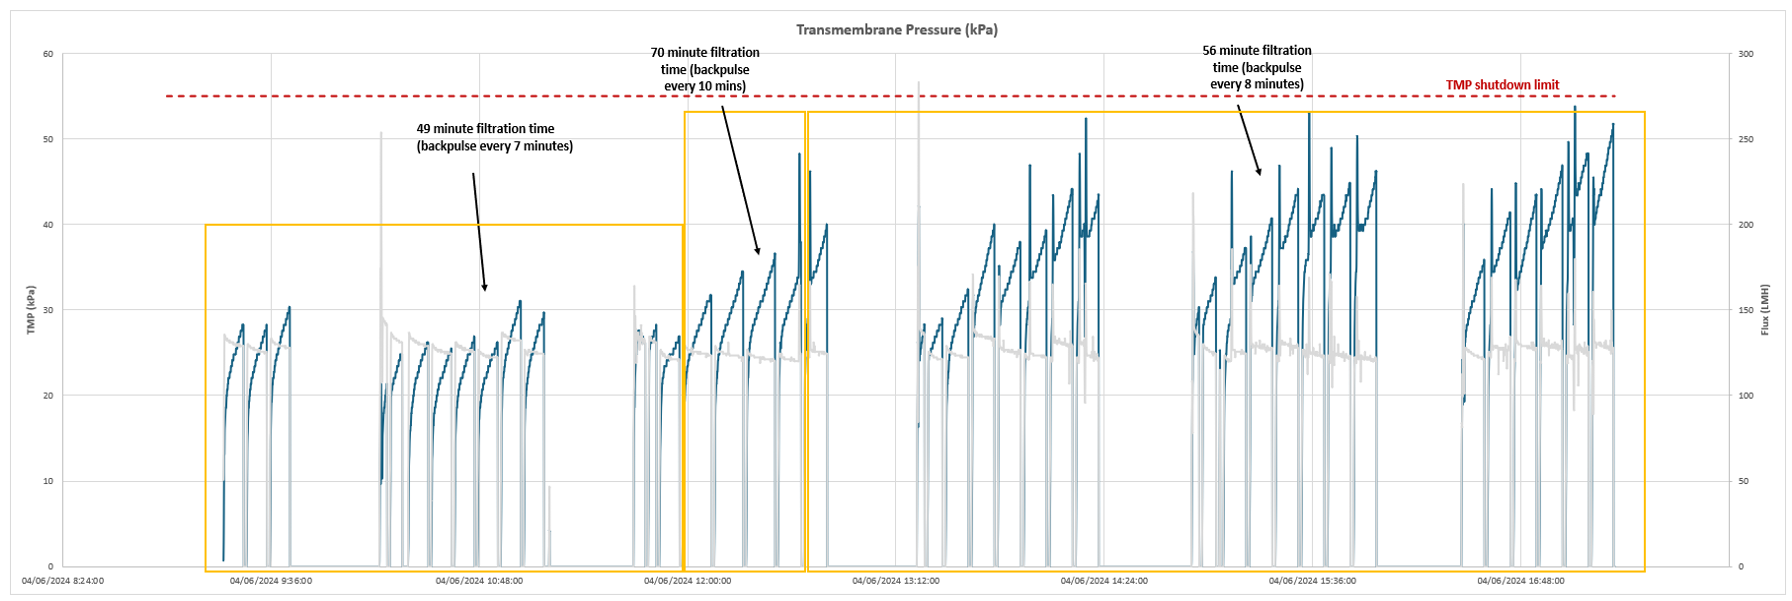
Figure 3: Raw water performance at different recovery rates
Coagulant dosing commenced at 20 mg/L of ACH and flux was increased incrementally from 220 to 470 LMH (200 to 430 L/hr) whilst maintaining a 90% recovery. As the flux was increased, the TMP also increased as expected. Up to a flux of 440 LMH (Figure 4), the TMP did not show any significant foulant accumulation that could not be managed by back-pulsing. Fluxes greater than 440 LMH did not appear sustainable at 90% recovery. At 440 LMH, the TMP immediately prior to back-pulsing increased but then stabilised, indicating this flux is likely the maximum achievable at these water quality conditions. A flux of 470 LMH was deemed unlikely to be sustainable without more frequent back-pulsing (less than 5-minute intervals) or a reduction in overall recovery.
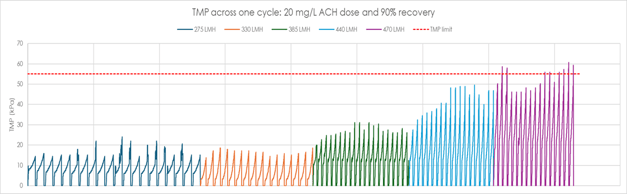
Figure 4: Transmembrane pressure at increasing flux rates (20 mg/L ACH dose and 90% recovery)
A decrease in ACH dose to 15 and 10 mg/L over the course of one month had a marked difference on membrane performance at 440 LMH. The TMP trend clearly identified an increase in initial fouling for each reduction away from optimum (Figure 5). Although the total solids buildup before each back-pulse was similar, the effectiveness of back-pulsing decreased at lower coagulant dose rates. This suggests that the optimal dose results in a better cake layer formation on the membrane surface. The coagulant dose also influenced the rate of TMP increase, indicating that lower coagulant doses would require more frequent chemical cleaning (Figure 6).
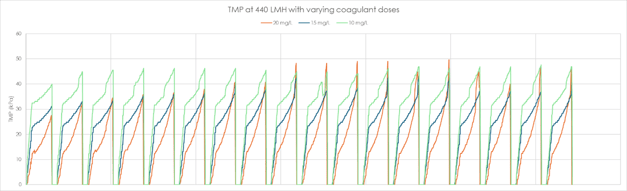
Figure 5: Transmembrane pressure response to sub-optimal coagulant dosing
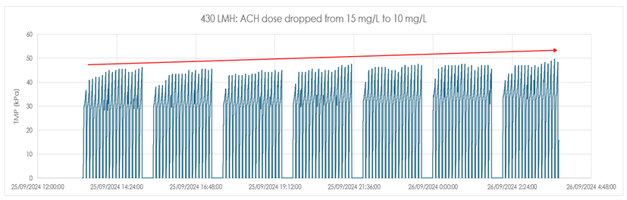
Figure 6: TMP as ACH dose reduced from 15 mg/L to 10 mg/L across a day
Throughout the trial, the pressure during the reverse flow (backwash pressure) was recorded to assess how fouling developed across back-pulses, between tank drains and after chemical cleans. Backwash pressure immediately after a clean commenced at around 45 kPa regardless of flux. At the optimal ACH dose the backwash pressure would gradually increase and stabilise around 60 kPa. When the coagulant dose was suboptimal, a slight increase in backwash pressure occurred (Figure 7) but a more pronounced increase in TMP and decline in permeability was observed.
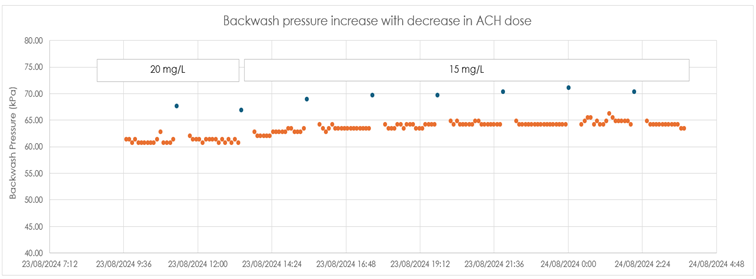
Figure 7: Increase in backwash pressure with decrease in coagulant dose
During the trial, an ACH overdose of approximately 90 mg/L occurred when ACH dosing continued during an unplanned overnight shutdown. The membranes were restored to usual performance with a brief 90-minute acid soak.
PAC dosing trials occurred over two days with an improvement in physical performance based on TMP (Figure 8), permeability and backwash pressure.
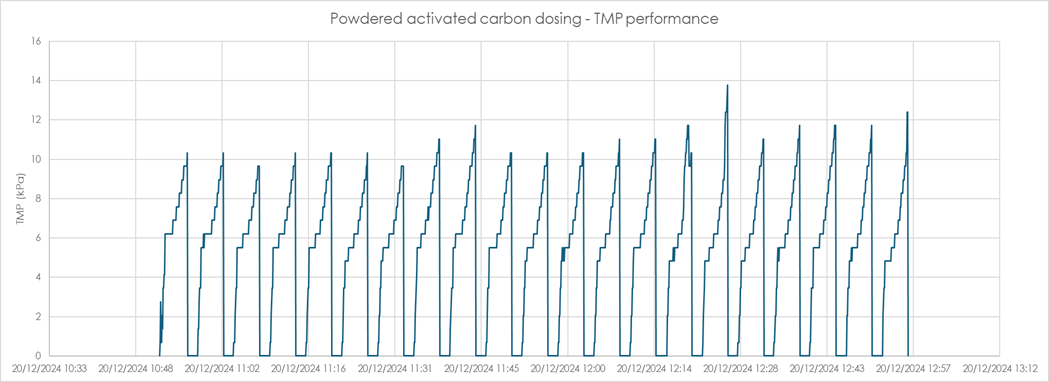
Figure 8: Transmembrane Pressure during PAC dosing (385 LMH)
A typical high algal cell concentration of 15,000 cells/mL was added to the flocculation tank at a flux of 385 LMH. No significant decline in membrane performance was observed. A single sample of the membrane tank just before the tank drain showed approximately 8,350 cells/mL. Zero cells were detected in the paired filtrate sample.
The cleans in the first month included sodium hypochlorite and sodium hydroxide to achieve a chlorine residual of 1,500 mg/L and a pH of 12 followed by citric acid at 0.2% w/w (approximate pH of 2.6). Lower permeability directly after the cleaning prompted a review of the cleaning chemicals and concentrations. As a result, the chlorine residual was increased to 1,800 mg/L, sodium hydroxide was excluded, and sulphuric acid was used to further decrease the acid clean pH to 2. The permeability performance improved with this combination of cleaning.
The permeability measured after each clean exceeded the ‘as-clean’ requirement of > 3,000 L/hr/m2/bar (Figure 9). There was minimal deviation from the baseline measurement across the trial, indicating irreversible fouling would not be a significant concern at Mount Pleasant.
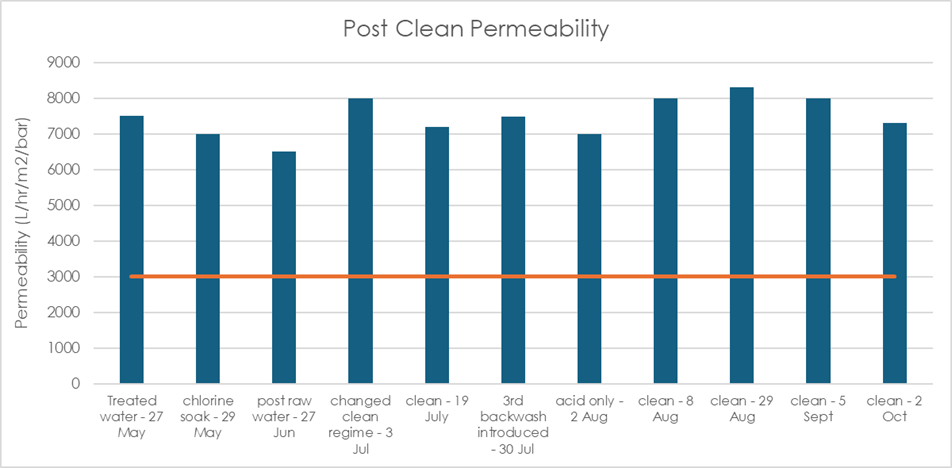 Figure 9: Permeability measurements directly after a chemical clean
Water quality performance
Water quality from grab samples analysed in the lab (Table 2) demonstrated excellent performance, with turbidity consistently below or equal to 0.1 NTU in all samples including with algae and reduced coagulant dose. DOC removal in the pilot plant typically outperformed the main plant (Figure 10) during the trial period.
Onsite turbidity profiling during a single raw water cycle with no coagulant consistently achieved turbidity of less than 0.33 NTU.
Table 2: Grab sample results at different scenarios operating on coagulated raw water
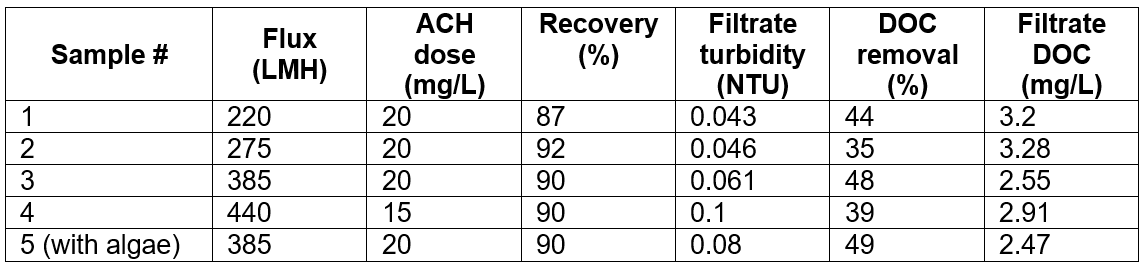
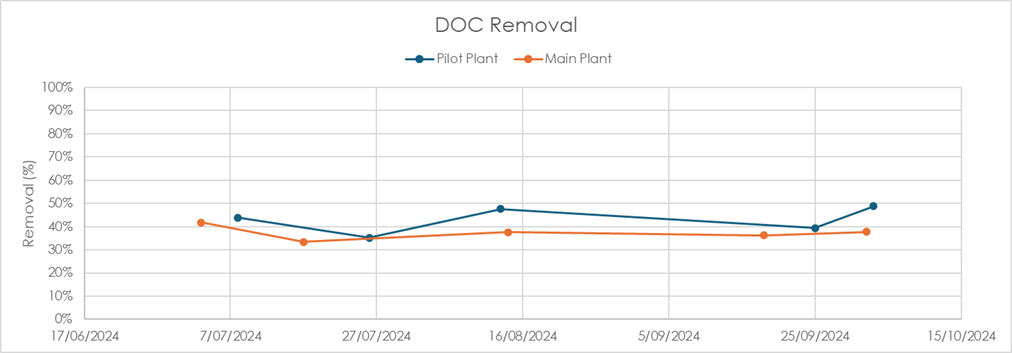 Figure 10: DOC removal in main plant vs. pilot plant
Validation testing results
Validation testing using separate surrogates on two separate days for protozoa and virus removal returned log reduction values of ≥ 4.5 and 5.5 respectively. However, grab turbidity results at times throughout the testing exceeded 0.15 NTU requiring further investigation.
Conclusion
A flux greater than the required 300 LMH was successfully achieved at the Mount Pleasant pilot plant. Turbidity performance based on grab sampling at both optimal and sub-optimal ACH doses was excellent. The membranes operated successfully with PAC dosing and moderate algal concentrations.
Backwash pressure remained well within the maximum limit of 120 kPa, while TMP proved to be a more sensitive indicator of fouling.
While membrane operation without coagulant was physically possible at a lower flux rate and recovery, turbidity above 0.15 NTU would prohibit operating in this mode.
The membranes were able to tolerate a brief failure in ACH dosing, with only a moderate decline in permeability. Membranes were easily recoverable following an ACH overdose.
After each clean, permeability returned to an ‘as-clean’ baseline, indicating that with optimal coagulant dosing, irreversible fouling would not be a concern - even with higher algal concentrations and upstream PAC dosing.
Acknowledgements
The Central Operations team is gratefully acknowledged for their support in maintaining and operating the pilot plant during the trial.
We gratefully acknowledge the Water Science and Environmental Biological Sciences teams for their assistance with validation testing, as well as sample and results analysis throughout the trial.
The Authors
Elizabeth Quarrell
With 19 years’ experience at SA Water and a civil engineering background, Elizabeth’s current role is Treatment Specialist Water. Her responsibilities include scoping and managing pilot plants, conducting field trials and providing process expertise for capital projects. Elizabeth is dedicated to ensuring a safe, sustainable and affordable future water supply.
Craig Dickson
With over 30 years experience in the water sector, Craig has worked across industries and across the globe, working on some of the most difficult water challenges with major corporations in the municipal, mining and oil and gas space. Craig founded AquaVoda in 2018; an Australian company, specialising in providing transformative technologies to the water treatment sector in the APAC region, with a particular focus on technologies that drive water efficiency, recycling and re-use.
Share