


Self-Cleaning Screen Reduces Desalination Plant Operating Costs
Screen flushing mechanism enables reliable continuous operation of screen filteras an alternative to disposable cartridge filters for reverse osmosis
DOWNLOAD THE PAPER
ABSTRACT
A unique screen flushing mechanism enables reliable continuous operation of a very fine screen (≤20µm) filter, placing an interesting alternative to the conventional use of disposable cartridge filters for RO pre-treatment. Pilot results from a seawater desalination plant in Israel show that the desired filtrate quality can be obtained while the automatic self-cleaning screen alternative can achieve a significant savings in the operating costs of energy, manpower and consumables. Analysis and breakdown of O&M costs indicate a potential OPEX savings of 80-92% compared to cartridges. For a medium-size desalination plant with a RO feed of 10,000 gpm (2,270 m3/h), this savings can add up to US$94,000 annually. Protecting RO membranes by a fine automatic screen appears to be a feasible and sustainable alternative.
INTRODUCTION
Reverse Osmosis (RO) membranes are commonly used as a main technology for the separation of salts and other dissolved materials in desalination of seawater (SW), brackish water (BW) and treated effluents. The RO membranes are known to be sensitive to fouling by organic and inorganic particles naturally present in the intake water. If allowed to enter the RO membrane, these contaminants will gradually accumulate in its feed spacers and the membrane surface leading to clogging and reduced performance (lower flux, higher differential pressure, etc.). As such, the fouling of RO membranes is a major consideration in desalination plants design and operation, and much effort is devoted to protecting the membranes and pre-treatment of the RO feed water. Generally, RO membrane manufacturers require feed water with a Silt Density Index (SDI) < 5 at RO inlet [DOW (2013)], and a level of SDI < 3 is preferred for extended membranes lifespan and reduced cleaning frequency.
The most common process to achieve the desired RO-feed quality is a pre-treatment by multimedia filters (MMF), with or without prior treatment stages such as coagulation and dissolved air flotation (DAF). An alternative pre-treatment process by either ultrafiltration (UF) or microfiltration (MF) membranes has become more common in the last few years [Davis (2010); Voutchkov (2010)]. Both processes, when properly designed and applied, are capable of removing most suspended solids and producing the desired SDI level, but additional membrane protection is required.
Occasionally, some of the finer media from multimedia filters may break through into the RO feedwater [DOW (2013)]. Detachment of mineral scaling or biofilm from pipelines and tanks are another possible source of course particles in both MMF and UF processes (especially with a RO feed tank). These coarse solids may have very little effect on measured SDI but can physically block the flow channels in the lead-end membrane elements, leading to high differential pressure and mechanical damage. Similarly, energy recovery devices (ERD) in seawater reverse osmosis (SWRO) systems are also sensitive to solids in feed water that may damage their moving parts [Danfoss (2013)]. Therefore, it is very common for the pre-treatment scheme of the RO feed to include a final filtration stage, usually a disposable cartridge filter with a nominal filtration grade of 1-20μm.
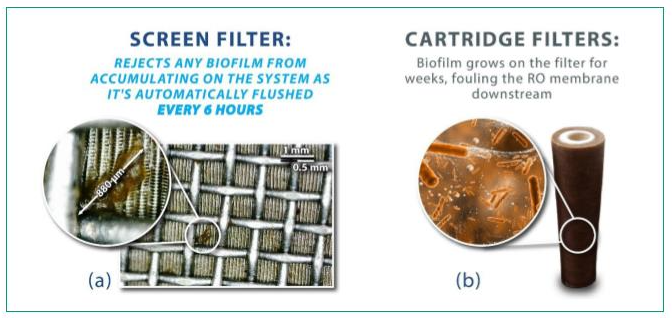
Figure 1: RO Protection by the two alternatives. (a) Close-up on un-flushed screen, covered by solids removed from the RO feed. A large biofilm particle is magnified. (b) Illustration, a used cartridge
Within most current SW and BW RO plants the main pretreatment processes (MMF, UF etc.) are automatically cleaned using backwash techniques, and in the case of UF, also chemicals. However, the cartridge filters used as final protection are disposable and must be replaced manually when clogged. The frequency of cartridge replacement is highly dependent on the feed water quality and effectiveness of the main pretreatment stage. Replacing cartridge filters more often than 1 – 3 months usually indicates a problem with the pretreatment, but even when a well-designed UF pretreatment produces SDI<1, the cartridge filters are recommended to be replaced at least every 3 months [DOW (2013)]. Such practice is labor-intensive and adds to the plant's overall OPEX and environmental footprint. In fact, at modern BW or SW desalination plants the final cartridge filtration stage is the only major process that is manually operated with no automation. Each single cartridge is designed for a flowrate of only a few m3/hour so that many cartridge units are required for handling feed water capacity. In large desalination plants the cartridge replacement process may include hundreds and even thousands of cartridge units, each must properly fit into place, while any miss-fit enables filter bypass and compromises the RO protection.
Another OPEX related aspect of cartridge filters is their contribution to the overall energy consumption of a desalination plant. While less-frequent cartridge replacement can save manpower and consumable costs, long operational periods of cartridges may result in the development of high differential pressure (ΔP) due to the accumulation of solids and/or microbial growth upon their surface. The energy required for overcoming this ΔP is included in the cartridge related OPEX. In desalination plants energy is a major factor of overall water cost, so reducing ΔP in all process areas is a major OPEX target of plant designers and operators in both BW and SW desalination plants.
Except for protecting RO membranes from coarse particles, the cartridge filters play another role in final pre-treatment and SDI reduction when needed. MMF may not obtain the required SDI<3 in situations of low raw-water quality or operational complexities, and the same applies to damaged or unproperly designed UF system [Voutchkov (2010)]. In such events, while providing final filtration and improving RO feed quality, these cartridge filters are subject to increased occurrences of clogging and more frequent replacement [Glueckstern & Aharony (2011)], with implications on plant’s OPEX. In some BW cases, cartridge clogging may be enhanced by the presence of oxidized metals (e.g Fe, Mn), while in surface water and effluents clogging is often caused by organic matter originating from algae or other biological sources [Voutchkov (2010)]. All may lead to rapid clogging of the cartridges that may happen in few weeks time, with significant O&M costs and plant down-time.
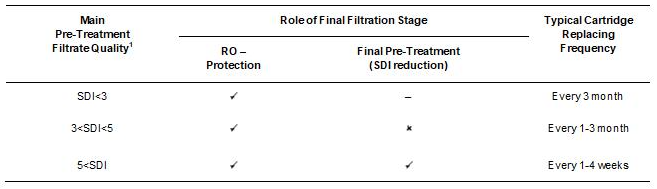
Table 1: Differentiating the Actual Roles of the Final Filtration Stage, Commonly Done by Cartridges, as Function of Pretreatment Water Quality.
Besides being made of non-degradable polymers, which directly impact a plant's OPEX, another environmental issue related to disposable cartridges is the ever increasing solid waste of used filters which requires proper disposal.
There is a clear need to evaluate automatic alternatives to disposable cartridges that will provide comparative filtration results while reducing OPEX and maintenance requirements associated with this stage of the process.
To date, automatic screen filters are commonly used in desalination installations as coarse filtration, in the range of 100-500µm, mainly for UF membrane protection. The main obstacle for automatic filters from being considered as a feasible RO protection candidate, at degree of ≤ 20µm, is the limited capability of previous iterations of the technology to successfully perform an efficient automatic backwash of a screen. It is of note that some non-screen automatic filters exist for ≤10µm (e.g. thread filters or back-washable pleated cartridges). However, these tend to be too complex & expensive to be an economic alternative to disposable cartridges, especially at large-scale BW & SW desalination plants. As a result, the industry continues to use disposable cartridges as a default final filtration prior to RO, despite their operational shortcomings.
Considering the prominent role of MMF as a main pretreatment method in SW & BW desalination plants, a pilot study was designed to evaluate the performance of an automatic screen filter when placed side-by-side to cartridge filters after MMF. The study was conducted in a major SWRO desalination plant in Israel, to investigate if indeed screen filters with filtration degrees of ≤20µm can perform efficiently & reliably as RO-protection and final pre-treatment, and to explore their OPEX advantages compared to cartridges.
METHODS OF PILOT STUDY
Site and Process
The pilot study was conducted at Via Maris Desalination (VMD), a large-scale SWRO desalination plant located on the Mediterranean coastline in Israel. The plant produces annually 90Mm3 (~46,000 gpm, 65MGD) of desalinated water [Hermony et. al (2015)]. Work on the RO-protection concept has been continuous since March 2018 with the deployment of a pilot fine filtration system.
The desalination process onsite consists of 4mm coarse traveling screens, followed by gravity and pressurized media filters, and cartridge filtration. Main desalination is done by SWRO membranes with ERD, followed by 2-pass RO and post treatment for pH correction and re-mineralization prior to supplying to the national water grid.
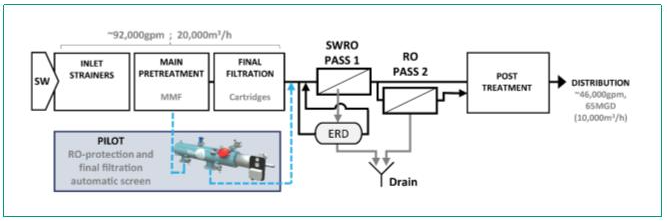
Figure 2: Desalination Plant Process Scheme
The Pilot System
The pilot system includes a Filtersafe BS-025 automatic screen filter equipped with a smartweaveTM sintered stainless steel screen treated for high salinity applications. A unique self- cleaning technique of the screen, known as EverclearTM is the key element to enable the filter’s successful operation in fine filtration degrees of ≤20μm. When the designated ΔP set-point is sensed, an automatic self-cleaning process is triggered in which a rotating suction scanner with patented proximity nozzles (nozzleXTM) [Filtersafe (2019)] scans the inside of the screen. A pressure gradient of 2.5 bar is sufficient to direct a fraction of the filtrated clean water to reverse the flow though the screen and into the proximity nozzle, applying significant turbulence and sheer force opposite to the filtration direction. The solids are forced to detach from the screen surface are carried away with the flushing stream. Unlike other common backwashing processes this flushing process does not require an external source of pre-treated water nor additional high-pressure pumps. The flushing is carried out automatically while filter productivity is maintained with zero down time.
Onsite, the pilot system is connected to a feed line from the clearwell (CW) of the desalination plant's media filters (Figure 2 above) to operate side-by-side with the cartridge filters of the plant, receiving same feed water quality and pressure.
The ongoing pilot operation is monitored using analog measurement devices, as specified in Table 2. Data is logged with a 5 sec-1 sampling rate. Grab samples are taken periodically from feed and filtrate streams for particle size distribution analysis. SDI measurements are done manually according to ASTM D4189 - 07(2014) by tapping in to the filter's inlet and outlet lines.
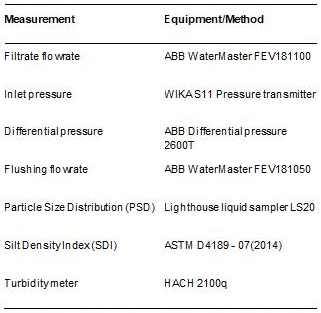
Table 2: Analytical Equipment, Measurement Devices and Test Methods
Throughout the experimental period, two sets of screens were examined, namely 10μm and 6μm (nominal) screens, for a total period of 21 and 10 weeks respectively. Water samples were also collected from the plant’s 5μm (nominal) cartridge filters for a comparative analysis.
RESULTS
Operational Feasibility – Backwashing of 10μm and 6μm Screens
The condition of a screen inside the filter, like other filtration technologies, is assessed by monitoring the differential pressure (ΔP), or head-loss though the filter at a certain flowrate. As the filter is separating solids from the water, the internal pores and flow paths are gradually being blocked, causing higher local velocity and head-loss through the screen. When the sensed
ΔP reaches a pre-designed set-point of 0.2 bar, the flushing process is initiated, and the self-cleaning mechanism scans and cleans the screen. Effective screen flushing can be indicated
by a recovery of the screen hydraulic properties, i.e. ΔP.
Figure 3 below shows the ΔP values of a self-cleaned screen (30 seconds after flushing is completed and a new filtration cycle begins).
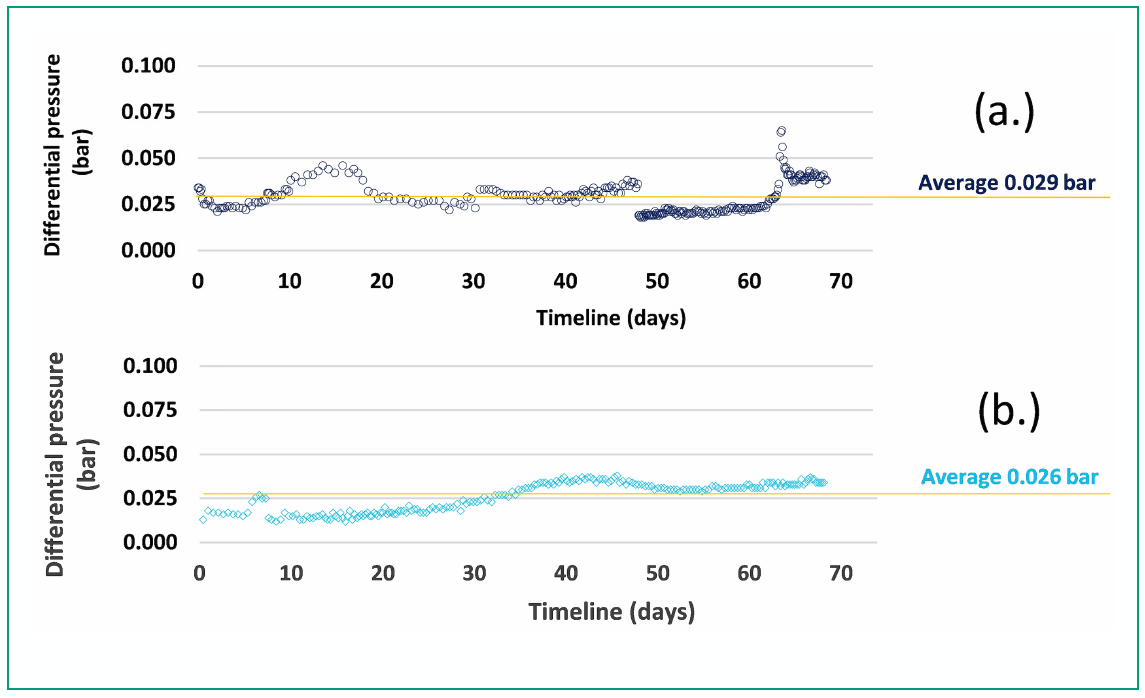
Figure 3: Differential Pressure of a Cleaned Screen. (a.) 10μm screen, April-August 2019; (b.) 6μm Screen, September – December 2019. Measured 30 Second After Completion of a Flushing Stoke.
When comparing automatic flush filters to disposable cartridge technology, water loss from the flushing process should be considered. Where cartridge filters throughput 100% of the inlet flow, in an automatic filter a fraction of the filtrate must be sacrificed to clean the filter and is discharged to drain. The ratio between accepted filtrate portion and the total inlet flow is known as Recovery Ratio and is expressed as a percentage (%RR). Figure 4 shows the %RR for the pilot's screen in two time periods with typical recovery of approx. 99.8%.
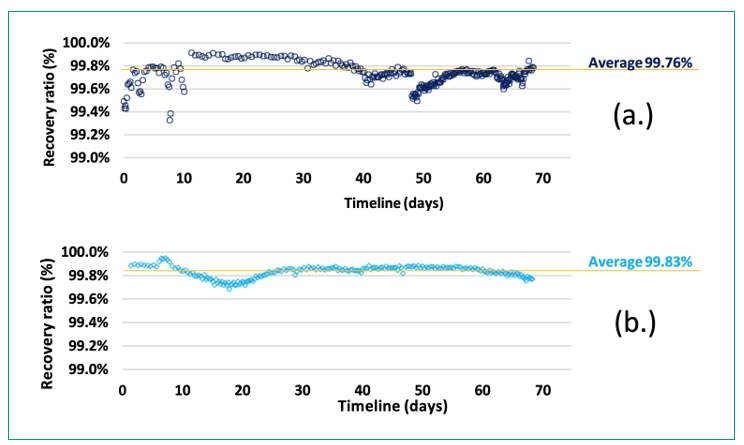
Figure 4: Water Recovery Ratio (%RR) Measured for Every Filtration Cycle. (a.) 10μm screen, April-August 2019; (b.) 6μm screen, September – December 2019.
Protection of RO Membranes from Coarse Particles
Largely, the function of RO-protection filtration is to protect membranes from mechanical clogging. According to the DOW FILMTECTM manual [DOW (2013)] occasionally some of the finer media from multimedia & carbon filters, ion exchange resins or diatomaceous earth pre-treatment filters may break through into the RO feedwater. Such coarse particles can temporarily settle in the flushing chamber of the automatic filter, as can be seen in Figure 5 below.
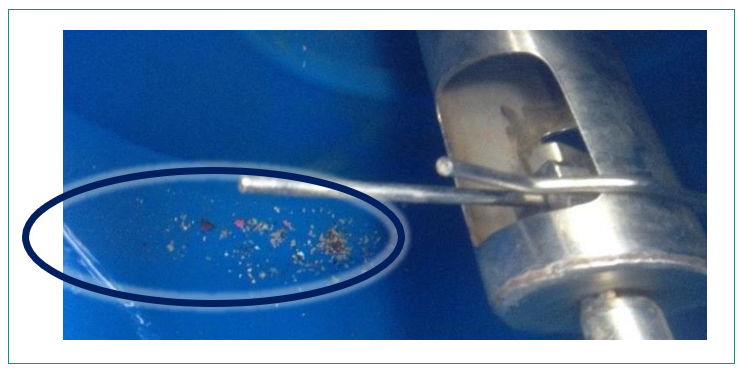
Figure 5: Demonstration of Coarse Particles Which Were Removed from RO Feed by the Automatic 10μm Screen Filter and Found in Flushing Chamber.
Filtration Performance in Comparison to 5μm Cartridge Filters
The quality of the pilot site's raw water is typical Mediterranean seawater quality, with salinity of ~38g/l, TSS <2.5mg/l, and turbidity of 2-3 NTU and SDI of >7. This pilot study however was done on MMF pre-treated water, with a typical MMF filtrate quality.
Typically, the product quality of a well-operating MMF can't be properly assessed by means of TSS, since values are below measurement range [ASTM int. (2013)]. While turbidity meters are a common online monitoring method, the grab sampling on site yielded a typical turbidity of 0.20-0.17 NTU of the MMF filtrate. The turbidity values of the two side-by-side final filtration stages (i.e. cartridge and screens) varied from this value by 0.01-0.03 NTU, which is within the accuracy and repeatability error of the method [HACH (2020)]. Hence, two more sensitive methods were used for comparing the MMF filtrate to better assess the filtration performance of final filtration alternatives, namely, SDI (Silt Density Index), and PSD (particle size distribution).
SDI
Figure 6 shows SDI values measured at the pilot filter's inlet (MMF filtrate), at the outlet of the pilot screen filter and from the outlet of the plant’s 5μm cartridge filters. Results are shown separately for summer and winter due to seasonal variation in raw feed quality.
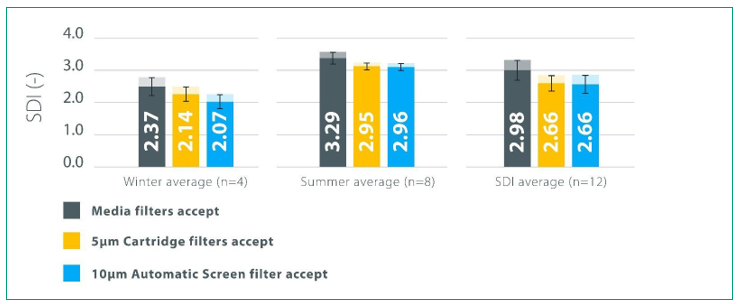
Figure 6: SDI Values of MMF, Cartridge and 10μm Screen Filter. Winter Results (n=4) and Summer results (n=8) are Presented Separately from the Total Average (n=12).
Particle Size Distribution (PSD) Analysis
The quality of the water going into the pilot filter (MMF outlet) and the filtrate quality of the plant’s 5μm cartridge and the pilot's 10μm and 6μm screen was assessed using a particle counter. The quality of the MMF filtrate is presented in Figure 7 as a numeric count of particles per 1 ml of liquid (a.) and as a volumetric load (b.) under the assumption that all particles are spherical.
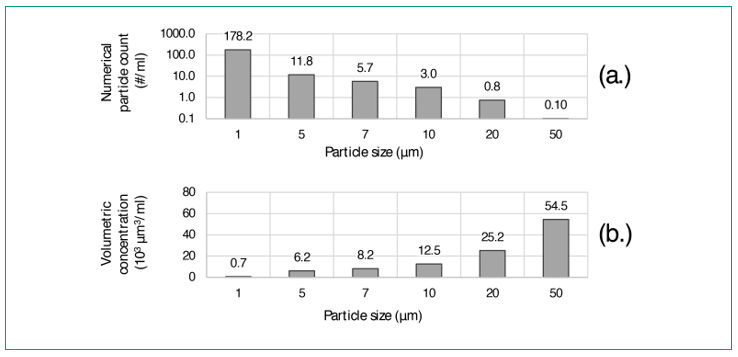
Figure 7: Water Quality of Multi-Media Filters Filtrate per Particle Size Segment. (a.) Numerical Count; (b.) Volumetric Concentration
The numerical abundancy of the smaller particle size (<10μm), as seen in Figure 7(a.), is much higher than of the larger particles (≥10μm). Still, in order to understand their actual
effect on RO membranes and significance of removal, particle volumetric concentration should be considered, as presented in Figure 7(b.).
The particle removal ratio of each final filtration alternative, i.e. 5μm cartridge, 10μm and 6μm screens was calculated by comparing the PSD count of inlet and outlet streams. A percentage removal bar chart is presented in Figure 8 below.
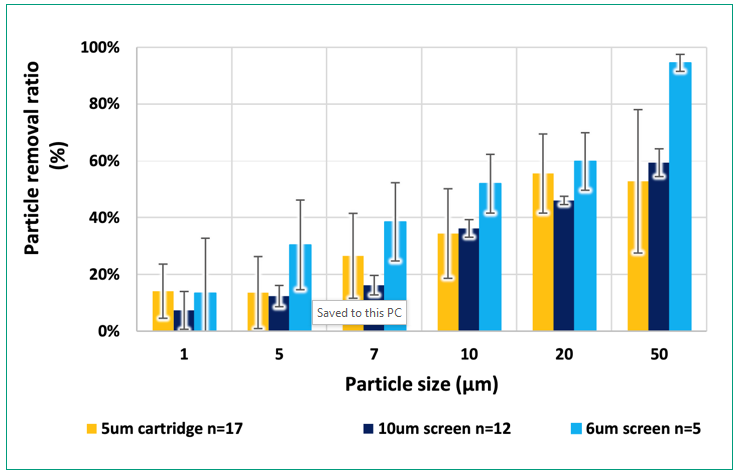
Figure 8: Particle Removal Ratio of the Three Compared Final Filtration Alternatives. Error Bars = SE.
The results show an increasing removal ability of larger particles for all three examined alternatives. The 10μm screen showed comparable filtration ability for particles of 5, 10 and 50μm. The variability of particles removal by the 10μm screen is smaller than the other filtration options tested, as indicated by smaller error bars in Figure 8.
The removal ratios of the 6μm screen seem to exceed those of the cartridge for all particle sizes larger than 1μm. However, a significant advantage is hard to be argued, due to the level of uncertainty that is demonstrated by the error bars. However, it is safe to argue that the 6μm screen is at least comparable to the 5μm cartridge filter in filtration performance.
FEASIBILITY OF AUTOMATIC ALTERNATIVE
Comparable Filtration Ability
In evaluating filtration performance between automatic screen filters and conventional cartidges, comparing RO feed quality is a key parameter that needs to be considered. It is a natural assumption that a 5μm rated cartridge's filtration performance will exceed what a 10-6μm screen can provide. The results of this study, however, show otherwise.
The 10μm screen was tested for a longer period than the 6μm option (21 weeks, over two seasons) which enabled the collection of sufficient SDI measurements (Figure 6). The results indicate a seasonal variance in the performance of the MMF, with the winter average SDI of 2.4 vs. the summer average of 3.3. This can be attributed to the natural characteristic of the Mediterranean Sea water which feeds the plant. In the summer higher water temperatures promote biological growth and solids loads are typically higher. The MMF seems to react to this occurrence, with accepted water SDI to be higher by approx. 0.9 SDI units (-) compared to winter.
Ability of the final filtration stage to further polish the MMF filtrate can also be seen. Both the 5μm cartridges and the 10μm automatic screen show comparable performance, removing 0.2-0.3 SDI units (-) on average throughout the year.
The Particle Size Distribution (PSD) analysis in Figure 8 also details the performance of the 6μm screen, beside the 10μm screen and the 5μm cartridge.
It is of interest to note that the error bars of the 10μm screen are smaller than the other two alternatives, suggesting a very stable filtration performance. In fact, despite lower average removal ratios, it is hard to determine that the performance of the 10μm screen is exceeded by the cartridge filter due to the variability in the performance of the latter, as indicated by the error bars (Figure 8).
The data presented suggests that the performance of the 6μm screen is equal to if not better than that of the 5μm cartridge. However, when taking into consideration the error bars, it becomes more difficult to conclusively identify the better performing technology, though the average removal ratio of the screen filter does exceed that of the cartridge in every size segment above 1μm.
In light of a 6 & 10μm screen outperforming a 5μm cartridge, several explanations can be suggested, most of which were already described as inherent properties of the cartridge filter. There is a risk of bypass in case of the improper installation of any single cartridge candle, therefore the accumulation of mineral solids and microbial growth on the cartridge surface can both contribute to the variability of filtrate quality of the cartridge filter.
Feasibility of Automatic Screen to Serve as Final Filtration Alternative
When considering an automatic alternative for the current market best-practice of protecting RO-membranes by cartridge filters, the first restriction is the workability of the automatic alternative, or its ability to automatically restore its hydraulic characteristic by the self-flushing mechanism.
While automatic screen filtration of >100μm is a known and proven technology, the self-cleanability of a ≤20μm screen is questionable. The operative results given in Figure 3 show that the pilot filter has been cleaned effectively over the pilot test period. Triggered at a ΔP of 0.2 bar, the flushing process recovered repeatedly the ΔP to the values of 0.02-0.05 bar.
The self-cleaning process of the automatic filter is based on using a fraction of the filtrated water, as explained previously. An inefficient flushing process will result in large volumes of rejected water. The automatic pilot screen, however, rejects only 0.17-0.24% of its feed water.
Materials of Construction
The pilot filter, like other Filtersafe offerings, is designed for marine applications and more particularly for ballast water treatment systems. The carbon steel filter housing is coated by an approved triple epoxy-phenol coating with optional cathodic protection. Internal metallic and wetted parts of the pilot system were of screen is made either 904L or SMO 254 stainless steel. The smartweaveTM is made of multiple mesh layers fusion-bonded in a tailored technique, providing superior strength and zero-relative movement between the layers, which result in high screen durability and lifetime of at least 5 years. Anecdotally, the screens tested in this pilot were treated for high salinity applications by a proprietary method to be presented in future publications.
Footprint
Filtersafe’s product offering has been designed for easy installation and footprint efficiency, which is a clear requisite in the ballast water treatment market and marine industry. A single multi-screen filter can treat a capacity up to 2,250 - 2,700 m3/h with a 10-20µm filtration degree respectively. The footprint of the filter, including its service space, is 9.5 to 14.5 m2 for vertical and horizontal orientations respectively.
OPEX AND O&M BENEFITS OF AUTOMATIC FILTERS ALTERNATIVE
While the final filtration stage of a pre-treatment system in a SWRO plant represents a small portion of overall CAPEX, the OPEX is usually far more significant over a desalination plant's lifetime. It is therefore interesting to compare the cartridge technology's OPEX to that of an automatic filter.
Head Loss and Energy
In order to minimize the frequency of cartridge exchange, plant operators tend to allow ΔP to build up on the cartridges, up to 0.5-1.5 bars, at which time the filters must be replaced. New cartridges typically have around 0.2 bar initial ΔP and a lifetime average of approximately 0.5 bar (5m). In contrast, the pilot results demonstrated that the automatic filter differential pressure span is 0.02-0.2 bar (from a cleaned screen to flush set point, respectively) with an average head loss of 0.06-0.09 bar (for 10μm and 6μm screens respectively). The screen head loss data from the pilot is presented in Figure 9 below.
The total energy required to overcome this differential pressure is a function of site capacity. A yearly calculation for a medium desalination plant with a RO feed capacity of 10,000 gpm (2,270 m3/h) is presented in Table 3 below. An energy savings of 82-88% can be obtained by the automatic alternative over cartridges. A cost estimation considering electricity price of 10 US-cent/kWh is presented in Table 3.
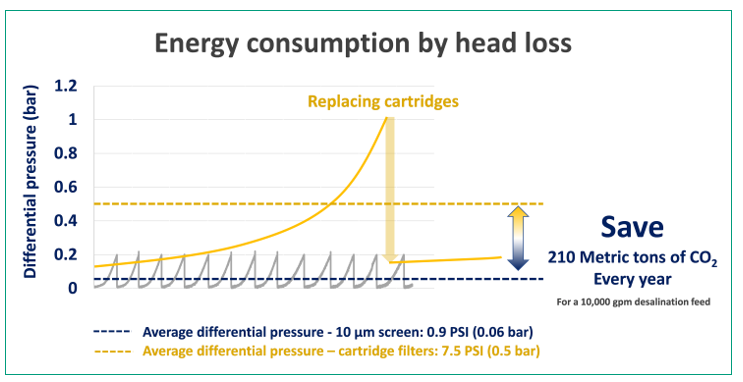
Figure 9: Comparison of Typical Average Differential Pressure of RO Protection Alternatives
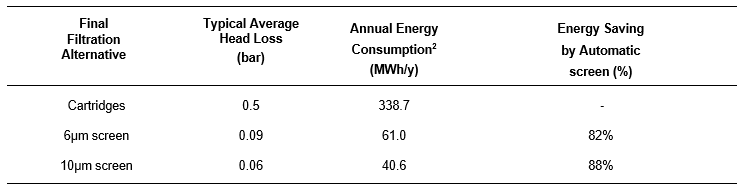
Table 3: Segmented and Total Energy Requirement of Final Filtration Alternatives for a desalination Plant with 10,000 gpm RO feed
Consumables vs. Spare Parts
The exact cost of consumable cartridges is subject to cartridge type, unit cost, MMF filtrate quality and policy of replacement frequency at each plant. From literature, it can be estimated that cartridge costs vary from US$0.64 to $0.95/1000gallons of RO feed (US$0.17 to 0.25/m3) [Glueckstern&Aharony (2011), Münk (2008), Sarai Atab et. al (2016), Voutchkov (2018)]. For a desalination plant with a feed capacity of 10,000 gpm the annual consumables expenses can be calculated to be about US$27,000-50,000/year.
The annual expenses of spare parts for an automatic screen filter of the same capacity was calculated to be about US$3,400/year when considering a routine fully preventive 2.5 year maintenance cycle. It is worth noting, however, that this routine assumes 20,000 flush cycles per year, whilst the pilot results indicate that in RO protection applications the filter flushes less than 10% of this assumed number. An even more conservative approach to automatic screen filter maintenance can consider a strict 5 year preventive maintenance routine including full replacement of all screens. This conservative approach will add up to another US$6,600/year in expenses.
Manpower Costs for Cartridge Replace vs. O&M of Automatic Screen Filter
Associating manpower costs related to cartridge replacement is difficult to estimate due to several factors. On top of the dependence of cartridge replacement on MMF filtrate quality, a very significant variation can be attributed to the model of cartridge housing complexity, how skilled is the labor and man-hour cost at various sites and countries. A total estimate was retrieved from the literature [Voutchkov (2018)], which include solid waste management expenses, presented in Table 4 below.
Solid Waste Management vs. Liquid Reject Discharge
Disposal fees for solid waste (used cartridges) is dependent on local environmental policy, which can vary significantly from place to place, as well as transport costs to an approved disposal site. A total estimate was retrieved from the literature [Voutchkov (2018)], presented in Table 4 below.
The costs related to automatic screen flushing were calculated under the assumption of liquid discharge back to the process. Therefore, the calculation includes the energetic factors which are involved in the flushing process: wasted pressure and operation of flush mechanism drive unit (motors). A calculation of the total annual energy cost of these aspects for a 10,000 gpm plant was extrapolated from pilot performance and calculated to be 500-600kWh/year, at typical screen filter recovery of 99.8%.
Summarizing O&M costs
An overall OPEX comparison between the final filtration alternatives for a medium-size desalination plant with RO feed of 10,000 gpm (2270m3/h) is provided in the following table.
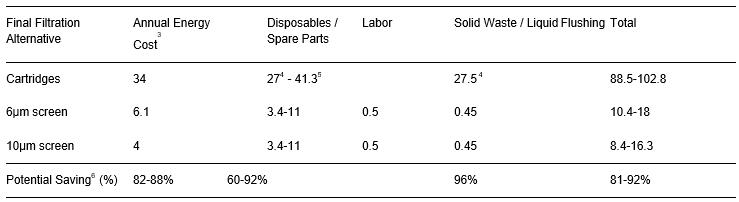
Table 4: Overall O&M Costs of Cartridge vs. Automatic Filters (1,000US$/y) and Potential Saving by the Automatic Alternative
SUMMARY
The pilot study results demonstrate a clear technical and economic feasibility of replacing disposable cartridges with an automatic screen filter as the final filtration stage of an RO desalination plant. A detailed examination of the results from this study demonstrate the reliable hydraulic behavior and self-cleaning ability of the screen filter, keeping differential pressure of the screen in the span of 0.02-0.2 bar, which is a key element in achieving low-energy consumption. In addition to this, there are other O&M cost benefits, namely in the reduction of consumables, labor and waste management. An overall OPEX comparison sums up to a potential savings of 80-92% over cartridges. Lastly, and perhaps most importantly, the pilot demonstrates through side-by-side water quality analysis that the filtration performance of a ≤20μm screen is comparable if not better than existing 5μm cartridges.
REFERENCES
DOW (2013) “Water & Process Solutions, FILMTECTM Reverse Osmosis Membranes: Technical Manual,”
Davis, M. L. (2010). Water and Wastewater Engineering: Design Principles and Practice. McGraw Hill.
Voutchkov Nikolaiy “Considerations for selection of seawater filtration pretreatment system,”
Desalination, vol. 261, no. 3, pp. 354–364, 2010
Danfoss. (2013). Installation, Operation and Maintenance Manual.
Glueckstern, P., & Anahory, D. (2011). Comparison of projected and recent actual cost of large desalination systems. 38–48.
Hermony Avner, Sutzkover-Gutman, Iris, Talmi, Yonatan., & Fine, Ofer. (2015). Palmachim Seawater desalination plant—seven years of expansions with uninterrupted operation together with process improvements. Desalination and Water Treatment, 55(9), 2526– 2535.
Filtersafe Automatic Filtration. Retrieved July 23, 2019, from https://filtersafe.net/
ASTM international. (2013). D5907-13 Standard Test Methods for Filterable Matter (Total Dissolved Solids) and Nonfilterable Matter (Total Suspended Solids) in Water.
HACH. (n.d.). 2100Q Portable Turbidimeter | Hach USA - Details. Retrieved January 6, 2020, from https://www.hach.com/2100q-portable-turbidimeter/product-details?id=7640450963
Münk, F. (2008). Ecological and economic analysis of seawater desalination plants. University of Karlsruhe.
Sarai Atab, M., Smallbone, A. J., & Roskilly, A. P. (2016). An operational and economic study of a reverse osmosis desalination system for potable water and land irrigation. Desalination, 397, 174–184.
Voutchkov Nikolay (2018), Desalination Project Cost Estimating and Management, CRC Press
Gido Ben, Levy Ravid, Dagan, M. Miyan, Weisbrood Anat and Ramot Matan (2019), Automatic protection of reverse osmosis membranes – feasible low-energy solution – pilot study, IDA World Conference.
THE AUTHORS
Miyan Mears
Miyan Mears Dagan, CEO Filtersafe. Miyan has been involved in the seawater filtration industry for his entire life, and eventually working at BallastSafe, the penultimate company founded before Filtersafe. He worked his way up through the company, starting as a Sales Coordinator, moving on to Business Development, and Commercial Director before being appointed as CEO.
Ben Gido
Ben holds a M.Sc. in Environmental Engineering from the Technion, Israel. As the manager of the R&D Department at Filtersafe, he has vast experience in the research and piloting of new products, technologies, and applications, with special attention to the environmental advantages of automatic screen filtration.
Jamie Pickford
Jamie’s worked for 30 years in the water industry, working across Australia, NZ and Indonesia. During that time he served in various management roles focusing on large industrial pumping and filtration projects for municipal, mining, aquaculture, agriculture, and industrial applications.
Ravid Levy
Ravid Levy is a consultant specializing in advanced water & wastewater technologies with >15 years' experience in various technological and commercial roles at leading water treatment firms. Ravid works with various Israeli and international organizations on commercializing innovative water and environmental technologies. Ravid hold a M.Sc degree in Environmental Biology from Tel-Aviv University.
Share