


Seawater desalination energy efficiency and emissions reduction at Gold Coast Desalination Plant
 and Machine Learning (ML)")
DOWNLOAD THE PAPER
Abstract
This paper investigates the implementation of Artificial Intelligence (AI) and Machine Learning (ML) in the operation of the Gold Coast Desalination Plant (GCDP) to optimise reverse osmosis (RO) membrane efficiency, reduce energy consumption, emissions, and operational costs. The study focuses on using historical and current RO operational data to train and utilise an AI algorithm that generates daily operational setpoints. These setpoints, namely RO Recovery (%) and Permeate Flow (m3/h), directly impact pump power consumption and energy requirements. The collaboration between Veolia and a cleantech start-up involves multiple phases, including system review, performance tests, and iterative optimisation.
Three (3) performance tests were conducted at GCDP, revealing unique challenges and findings. Performance Test 1 demonstrated energy savings despite rapidly increasing cartridge filters differential pressure (dP) in the test period. Performance Test 2 encountered underperformance of an energy recovery device (ERD), resulting in increased feed pressure and with it, power consumption. Performance Test 3 highlighted the impact of fluctuating feedwater temperature on energy consumption. Overall, the AI model showcased its ability to recommend setpoints within operational limits and achieve required permeate flow with reduced energy, even under unfavourable conditions.
The initiative at GCDP resulted in an estimated 1.1% energy reduction, corresponding to approximately 0.023 kWh/m3 and the potential to save up to 1044 MWh of energy and 762 tonnes of CO2-e per annum. The study suggests further exploring AI and ML applications to optimise treatment plant operations, including varying permeate flow setpoints and improving data transfer and setpoint implementation methods. These advancements hold promise for enhanced energy efficiency and cost reduction in desalination plants worldwide.
Introduction
The Gold Coast Desalination Plant (GCDP) is a climate-resilient solution deemed necessary during the Millennium Drought to combat drinking water shortage and increase water security. Desalination, in South East Queensland, is seeing higher use due to the water strategy and infrastructures in place, and more broadly being considered in other parts of the world as a way to diversify water sources and supply for the growing population. Compared to conventional water treatment plants or brackish water desalination processes, seawater desalination technology requires more energy due to the higher salinity of the source water. This energy is usually obtained through methods that contribute to climate change effects, which have become a norm rather than a crisis.
Veolia has engaged a cleantech start-up company to introduce and trial Machine Learning (ML) and Artificial Intelligence (AI) for the Reverse Osmosis (RO) membranes operation at GCDP to increase efficiency and reduce energy consumption, emissions (scope 2) and operational costs.
The RO operational data is analysed and used to train the algorithm which in turn outputs recommended operational to the operations team, e.g., RO Recovery (%) and Permeate Flow (m3/h). Both parameters affect the required feed flow and pressure, which in turn affects pump power consumption. Recovery is inversely proportional to Feed Flow whilst Permeate Flow is directly proportional (i.e., to increase Recovery at a consistent permeate flow target, feed flow is to be reduced, whereas at a consistent Recovery, feed flow has to increase for permeate flow to increase). Operational data includes temperature, pressure, conductivity, flowrates, valve positions and pump power, all fed into the algorithm to generate the setpoints.
Method
Before integration, the collaboration involves multiple phases, including an initial system review and tests. During these tests, setpoints are applied to compare against normal operation, without regular setpoint changes. The baseline power consumption is established to quantify any potential savings and improvements.
Initially, daily RO data was extracted and used to train the AI algorithm. Once the model was confirmed to be functional, the algorithm was fed with data to produce setpoints. The algorithm recommends target parameters to achieve the lowest combined Feed Pressure for the target permeate flowrate, which directly impacts pump power, hence energy consumption and emissions. User-set constraints ensure that the setpoints and anticipated operational parameters are within design and operational limits, maintaining asset integrity and water quality (e.g., Recovery to be between 43.5% and 46%).
A performance test involves a closed-loop process where data is extracted daily and fed to the algorithm, and it produces setpoints for daily implementation. In a typical RO plant, a performance test would involve running at least two RO trains with comparable membrane and pump performance. One RO train would run as normal with unchanged setpoints, and the other would have setpoints applied daily and be compared later. However, at GCDP, the pressure-centre system is unique, especially to this algorithm. Four (4) feed pumps service nine (9) RO trains through a common feed header, and feed flow and pressure to each train are controlled by a control valve on each RO train, which may allow or restrict flow (burning off energy this way) as required.
GCDP operates at only three capacities (33%, 66%, and 100%) with three seawater RO trains operating per 33% capacity. The current control system has limitations in terms of setting individual RO permeate flow targets due to a hard-coded average combined permeate flow. Despite the inability to alter individual permeate flows, the decision was made to test the system’s performance under these conditions to evaluate if any savings could be achieved without varying the RO permeate flowrates, which had never been done before.
The combined capacity of the SEQ Water Grid storage in the lead up to Performance Test 1 in July 2022 was abundant at 88% and remained above 80% until January 2023. GCDP was not producing water continuously because water is plenty. For this initiative, production at the lowest plant capacity was allowed up to 7 days and only upon supply grid approval. Due to these production limitations, it was decided that the best approach to observe and quantify efficiency gains at GCDP is to run a set of RO trains and obtain baseline data for up to three (3) days of continuous RO operation with unchanged RO trains and operational parameters. This is followed by up to three (3) days of continuous RO operation with AI-recommended setpoints implemented daily, and the feed pressures and power consumption of both periods compared.
For a successful performance test with reliable results at GCDP, the following need to be:
- Feedwater quality is stable, especially temperature and conductivity;
- The same set of RO trains are operating (i.e., no RO train swaps);
- Setpoints applied are met/achieved; and
- Stable uninterrupted operation throughout the test period.
Results
Between July 2022 and January 2023, GCDP conducted three (3) performance tests, summarised in Table 1, each with unique challenges and findings.
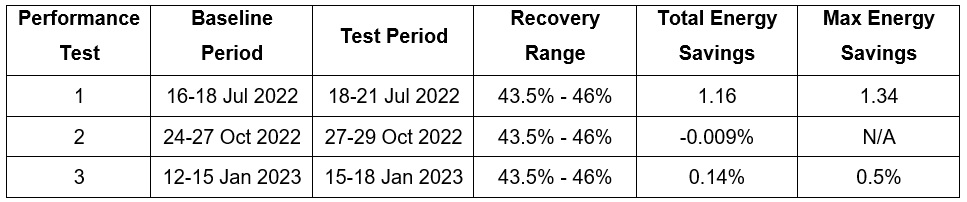
Table 1: Summary of Performance Tests 1, 2 and 3
Performance Test 1 had the same RO trains operating and had a stable run with stable feedwater conditions. It was however when the cartridge filters upstream of the RO membranes were nearing replacement due to increased differential pressure (dP), an indication of clogging and fouling. This was identified in the initial analysis and interpretation of the data when the energy consumption was increasing during the baseline period when all other parameters were stable. Despite this, there was still an energy savings (kWh) of approximately 0.55%. By isolating the final 15 hours of the baseline period as a reference (due to the increasing energy use), the test observed an energy savings of 0.81% by the end of the period (refer to Figure 1).
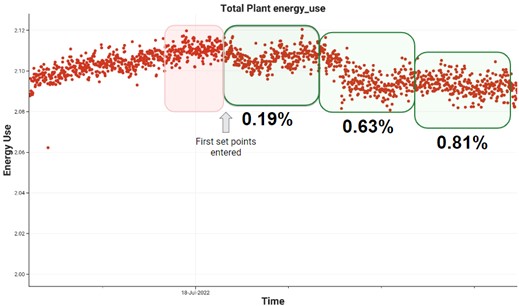
Figure 1: Energy use in Performance Test 1
Normalising the energy savings to account for the high cartridge filters dP resulted in a 1.16% energy savings (refer to Figure 2). Since the cartridge filters were scheduled for replacement during the annual shutdown the following month, a second performance test with a lower and more stable cartridge filter dP was recommended and planned, this time ensuring the cartridge filter dP is also monitored and verified to be unchanging (or significantly indifferent) during the test period.
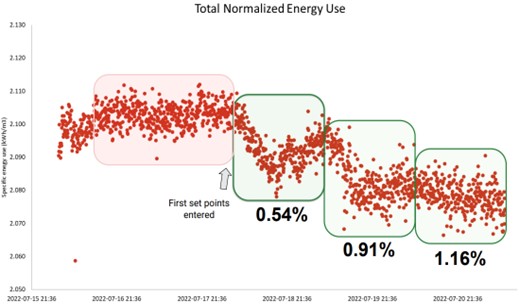
Figure 2: Normalised Energy use in Performance Test 1
Performance Test 2 demonstrated no energy savings, rather a slight increase in specific energy consumption (0.009%). It was conducted with stable feed water quality and low cartridge filter dP after a replacement prior to the run, however the energy recovery device (ERD) of RO Train 2, which utilises the brine stream and its residual pressure to pressurise feedwater, had underperformed and affected the energy recovery and the train’s overall performance. In normal operation, the permeate flow should be relatively steady, as shown in Figure 3.
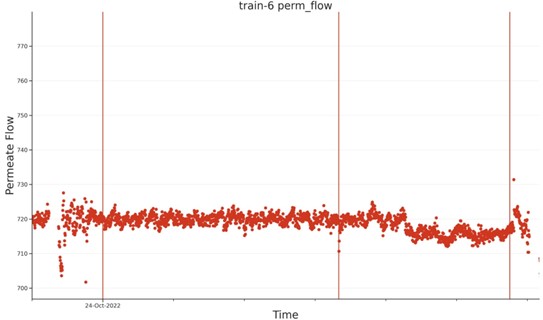
Figure 3: Permeate flowrate of RO Train 6 (normal) during Performance Test 2
RO Train 2 had both Recovery and Permeate flow fluctuations, failing to meet permeate flow setpoints (Figure 4), which is believed to have contributed to the increase in overall specific energy consumption.
During Performance Test 3, the temperature decreased from 26°C to 23°C overnight and continued to fluctuate between 21°C and 26°C for the rest of the test period (refer to Figure 5). The RO feed pressure increases as temperature decreases because of the higher viscosity of water at lower temperatures. Due to the constant temperature swings, AI was being fed unstable operational data, and energy savings were limited. Additionally, only one batch of setpoints was applied daily. Despite the lower average temperature and aggressive fluctuations, there was still a 0.5% energy savings observed with setpoints applied.
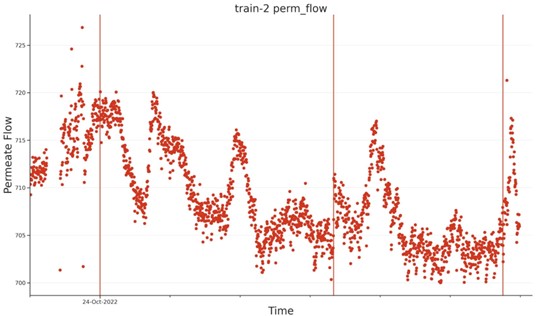
Figure 4: Permeate flowrate of RO Train 2 (underperforming ERD) during Performance Test 2
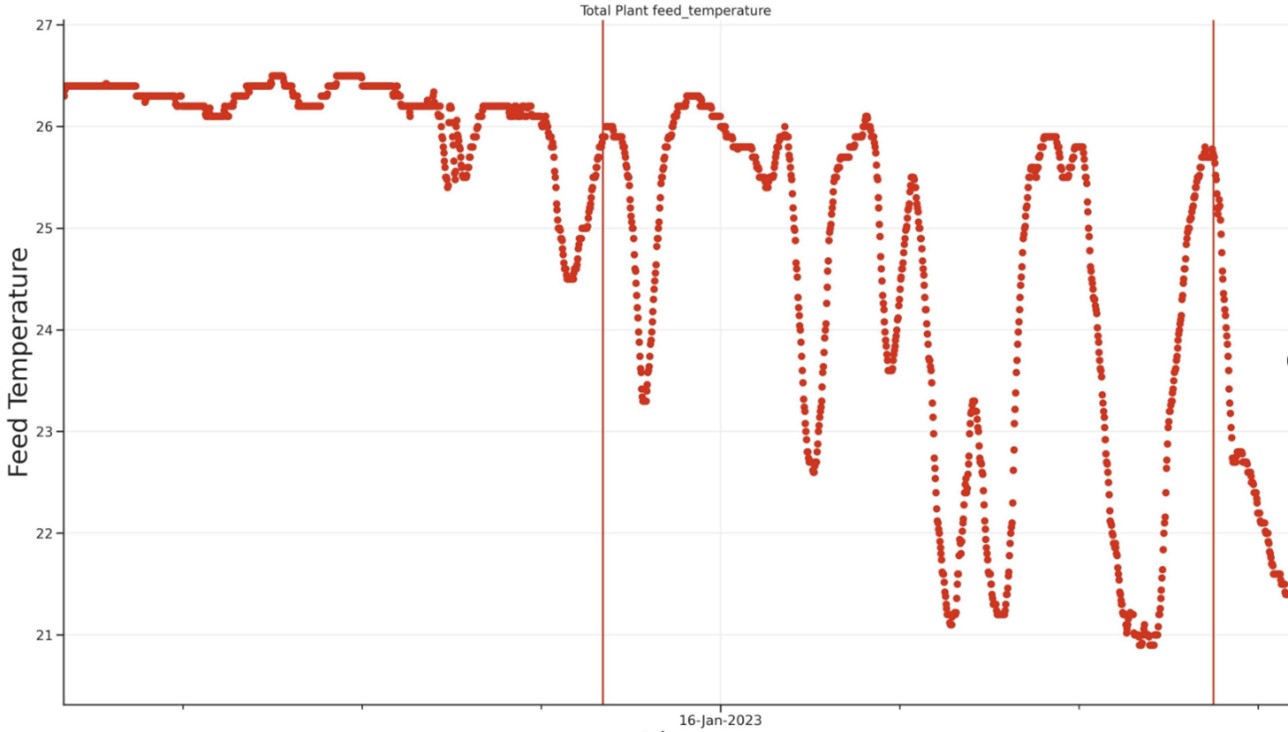
Figure 5: Feedwater Temperature in Performance Test 3
Discussion
Performance Test 1 resulted in reduced power consumption despite high and rapidly increasing cartridge filters differential pressure (dP). In Performance Test 2, although no energy savings were observed, the increase in power consumption was minimal, limited to 0.01%.
Performance Test 3 showed that changes in the feedwater temperature has a higher impact on energy consumption than increased cartridge filters dP, for the given operating range/magnitude observed in Performance Test 1.
When an energy recovery device (ERD) underperforms, it is possible for the RO reject/brine to leak through to the feedwater stream. Recirculating higher salinity water into this RO train increases the pressure required to produce the same target permeate flow due to the higher salts concentration, hence a higher osmotic pressure that needs to be overcome, as seen in Performance Test 2. Historically, feed conductivity can increase from 52 mS/cm to 65 mS/cm at GCDP, depending on the type and severity of the failure, increasing feed pressure from 50-51 bar to 54-55 bar, sometimes up to 58 bar.
Without setpoint changes, the energy required to produce the same volume of water under such circumstances would be higher. Historical events showed that when one of six operating RO trains had an elevated feed conductivity, increasing the train’s feed pressure to approximately 55 bar, the RO pumps saw an increase in energy consumption by 3-4%. Although there were no savings in Performance Test 2, the increase in energy was limited to 0.009%, showing the algorithm was still working to achieve its goal to reduce and ultimately minimise power consumption within the set operational constraints.
Maintaining the assets in the RO building, especially the ERDs, has been and continues to be a challenge due to a combination of the high-pressure restrictions and a dynamic production demand at GCDP. Strictly no access is allowed into the RO building during RO operation, except during ramp down when the pumps and the overall systems are all under 10 bar. This makes it difficult to respond to the aforementioned issues, especially during continuous operation where performing maintenance tasks is out of the question.
The AI model has demonstrated its capability to process RO data and recommend setpoints within the design and operational limits, achieving the required permeate flow with less energy even under abnormal and unfavourable conditions. The performance tests at GCDP, with the agreed method, confirmed that energy savings can be achieved with AI only by altering Recovery on a pressure-centre system.
Conclusion
Veolia’s initiative to utilise AI and ML for operational decision-making at GCDP demonstrated value by reducing the electricity consumption (kWh/m3) required for RO operation, thereby reducing the associated cost ($/m3) and emissions (CO2-e/m3) for producing potable water. The observed 1.1% savings translates to an estimated energy reduction of approximately 0.023 kWh/m3, with the potential to reduce up to 1044 MWh of energy or an estimated 762 tonnes of CO2-e per annum.
Where possible, it is recommended to explore the application of AI and ML to optimise treatment plant operation and processes through a more dynamic and data-driven approach. At GCDP, further improvements to the system are being explored in order to capitalise on more energy savings. Enabling variation of permeate flow setpoints for individual RO trains could result in an additional 1-1.5% theoretical savings. However, this has not been proven or tested at GCDP with the pressure-centre and current control system in place. There is also an opportunity to improve data transfer and method of implementing setpoints – automation and increasing the frequency of setpoint changes to respond to varying conditions.
Acknowledgements
I thank Scott Murphy (Veolia) and Mike Dixon (Synauta) for the initial engagement to launch this collaboration. I thank Gilles Beurton (Veolia), Stuart Rutledge (Veolia) and Vinay Muppala (Veolia) who supported the initial feasibility assessment – providing operational data and establishing system constraints. I thank Nick Herold (Synauta), Miller Truby (Synauta) and Kristy Dixon (Synauta) who have made the collaboration as smooth as possible and have just been fantastic to work with. I also thank Filippo Vico (Veolia), Amy Mitchell (Veolia), and the GCDP Operations Team (Veolia) who were very supportive throughout and took care of plant operations in these periods, enabling the study and performance trials to take place.
The Author
Jonathan Jo
Jonathan Jo is the Process Engineer at the Gold Coast Desalination Plant. He has worked in various professional roles across Veolia’s desalination and recycled water assets. He is an integral member of the Veolia team and industry advocate, demonstrating technical excellence, integrity, and a passion for sustainability and innovation.
Share