


Scum Accumulation Represents Unutilised Methane Potential and Revenue Opportunity in Anaerobic Lagoons

Highlights
- Floating solids comprise a negligible amount of sewage feedstock volume
- Biogas production leads to settled solids floatation, forming a scum layer
- Scum is highly degradable but has little methane producing microorganism activity
- Most methane producing microorganism activity is located in the top layer of sludge
- Scum accumulation represents unutilised methane and energy potential
Executive Summary
Settling tests, pilot systems and full-scale sampling were used to evaluate development of solids and biological dynamics in anaerobic lagoons (ALs), including how spatial distribution of solids and activity evolves as solids accumulate and age. Results show that in absence of biological activity, floating solids comprise a negligible fraction of feedstock volume. Biogas production was shown to result in the floatation of settled solids due to particle attachment to rising gas bubbles; forming a scum layer. Scum was found to be highly degradable but with very little methane producing microorganism activity; representing unutilised methane potential and revenue opportunity in ALs.
Introduction
Anaerobic Lagoons (ALs) are a low-cost technology for the biological treatment of wastewater and when combined with geo-membrane covers that enable biogas collection, they also provide low-cost renewable energy. ALs represent a pathway to more sustainable wastewater management, enabling capture of organics to produce renewable electricity through anaerobic digestion at around 25% of the cost of alternative technologies. As ALs are relatively cheap and simple, the number of installations is on the rise in both municipal and agricultural applications. Approximately 70% of Australia’s dairy production (excluding pasture), 60% of piggeries and over 50% of meat processing capacity use ALs or slurry pits to treat their waste. ALs are also installed at major municipal plants in Victoria, Queensland and South Australia.
The treatment process in traditionally operated ALs relies on physical removal of organics via sedimentation and floatation of suspended solids, and the subsequent anaerobic digestion of organic material in those removed solids as well as those remaining in suspension. In this way, ALs effectively decouple the hydraulic retention time (HRT) from the solids retention time (SRT). Solids accumulate as sludge (settled solids) and scum (floating solids). Scum accumulation in ALs can lead to cover failure, increasing maintenance costs and reducing the operating life of cover assets. Similar to sludge, scum must be periodically removed from AL installations to maintain system performance. Accumulated solids contains both the degradable material and active microorganisms that facilitate biogas production. The goal is to allow sufficient SRT to produce a stable and well digested sludge, maximising gas production, as well as minimising sludge odour and greenhouse gas emissions during subsequent sludge drying processes. However, the distribution of biological activity and degradable substrate in sludge, supernatant (bulk-liquid) and scum have not been investigated. This leads to uncertainty on where digestion takes place and how biomass-substrate contact occurs in ALs, and therefore appropriate operating practices aimed at optimising biogas production and solids stabilisation in ALs is unclear.
Methodology/Process
Settling tests were used to assess the phase separation (settled solids, floated solids, and supernatant) behaviour of an AL sewage feedstock (screened to 30 mm). A novel pilot plant reactor was used to emulate solids sedimentation and sludge accumulation in ALs (Figure 1). The pilot was inoculated with sludge and fed raw sewage daily. The number of daily feed events was increased during each stage of operation to reduce HRT / increase loading rate. Pilot samples were regularly collected to study the long-term effect of accumulation and aging on physical and biological properties of sludge and scum. Samples of scum were also collected from a full-scale AL in VIC (AL-1); at the same location where the pilot was stationed. AL-1 is a large-scale lagoon treating a mixture of municipal and industrial wastewater, with a theoretical HRT of 2 days.
Results/Outcomes
Settleable Solids were found to comprise just 1.7% v/v of the sewage feedstock tested, while floated solids accounted for <0.1% v/v after 24 hours settling time (Table 1). These results indicate that in the absence of biological influence (e.g. biogas production), floating solids comprise a negligible fraction of sewage feedstock volume. While settled solids account for a relatively small volume fraction, this phase accounted for approximately 45% w/w of total chemical oxygen demand (COD) and total biological methane potential (BMP; a measure of degradable material present in sample) in the sewage feedstock tested (Table 1).
Scum was observed in the pilot during all stages of operation and was observed to be due solids being carried with rising gas bubbles to the surface (Figure 2). The impact of entrained gas on scum buoyancy was tested during lab Specific Methanogen Activity (SMA; a measure of biological activity present in sample) tests, whereby physically breaking up the scum matrix (releasing entrained gas) caused most solids to resettle (Figure 3). However, biogas production during SMA tests then caused solids to refloat. These observations, along with settling tests, indicate that scum formation is the result of biological (biogas) and transport (gas bubble entrainment) processes. Pilot and lab results also show that scum buoyancy, at least initially, is due to gas bubble entrainment and that disrupting the scum layer, allowing gas bubbles to be released, causes most solids to resettle. Scum volume significantly declined in the pilot during 2 day HRT; believed to be due to increased water surface disturbance from increased daily feed events.
The majority of pilot methanogen activity was found to be located in the top 0.1 – 0.2 m of the sludge layer and decreased with depth (Figure 4). Sludge BMP was also found to decline with depth, indicating sludge ageing and stabilisation. Pilot scum samples showed consistently high BMP at ~300 – 350 L CH4 kg VS-1. Pilot results show an inverse relationship with scum accumulation and SMA, whereby when scum volume is at its highest (4d HRT; 400 days) SMA is at its lowest, and when scum formation was at its lowest (2d HRT; 512 days) SMA is at its highest. This indicates that scum initially contains some activity, but as scum accumulates degradable material and ages, microbial imbalances occur and SMA declines. While the majority of system methanogenic activity (~70 – 80%), is consistently located in the sludge layer, scum accumulation can represent as much as 50% of total degradable COD in the reactor (Figure 5). Given the low SMA of scum, scum appears to represent a significant amount of unutilised methane potential in ALs. Mature scum samples collected from a full-scale AL (AL-1) confirmed pilot findings; showing a highly degradable material with average BMP of 534 L CH4 kg VS-1, but with almost non-existent SMA at 0.00001 gCOD gVS-1 d-1. Scum samples were also found to comprise ~21% w/w of rags, plastics and large floating debris, which may contribute to material bouyancy (Figure 6). Approximately 80,000 m3 of scum was removed from AL-1 in 2020 during cover replacement works as a result of scum accumulation. Based on BMP results and electrical conversion efficiency at this plant, the total methane potential and electrical cost saving opportunity of this removed scum is estimated at approx. 3,800,000 m3 CH4 and $3,000,000, respectively.
Conclusion
Scum removal requires removal of AL covers, which is costly and risks damage to covers. AL scum was shown to be highly degradable but have very low to almost non-existent methanogen activity, meaning scum represents unutilised methane potential in ALs. Given the energy and revenue potential of scum, consideration could be given to actively disrupt scum formation and digest scum for optimal biogas production and energy recovery in ALs, rather than the more traditional approach of removal and disposal of scum.
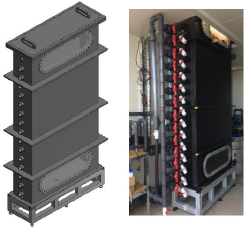
Figure 1: Pilot plant reactor; showing as constructed CAD drawing (left) and as-built reactor onsite (right). Reactor dimensions: 2.5m Height x 1.2m Long x 0.3m Wide
| Supernatant | Settled Solids | Floated Solids | |
| Phase Volume (% original feedstock) | 98.3 ± 0.3 | 1.7 ± 0.3 | < 0.1 |
| Suspended Solids (% original feedstock) | 29 ± 3 | 69 ± 9 | - |
| Suspended Volatile Solids (% original feedstock) | 27 ± 3 | 66 ± 9 | - |
| Total COD (% original feedstock) | 50 ± 3 | 47 ± 8 | - |
| Methane Potential (% original feedstock) | 49 ± 1 | 45 ± 8 | - |
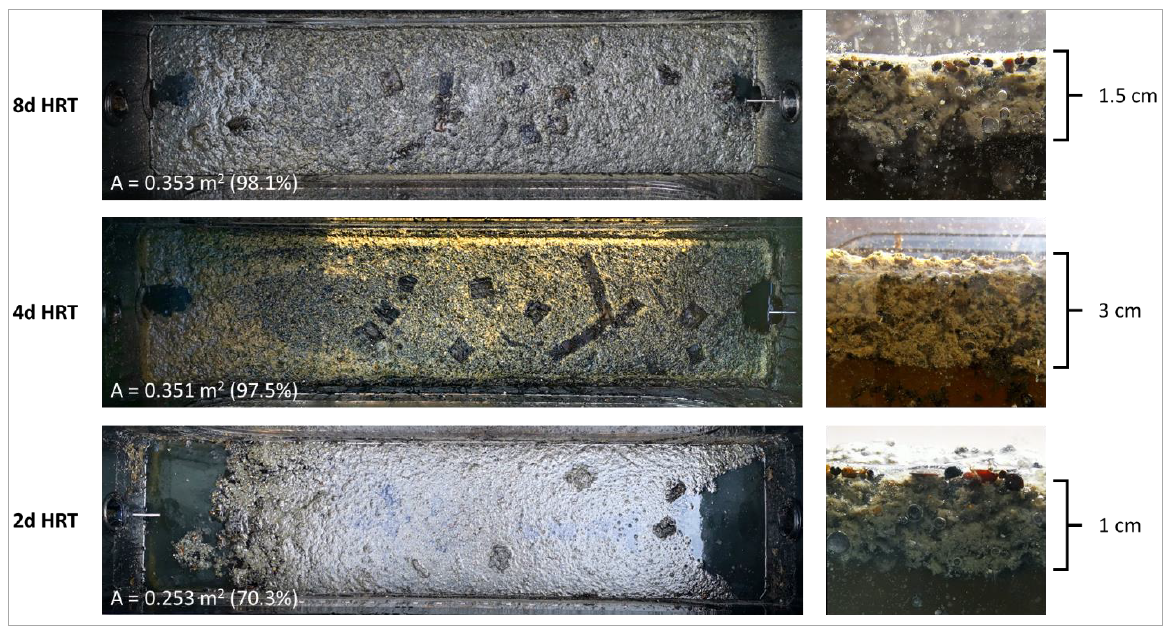
Figure 2: Images of pilot plant scum formation at the end of each stage of semi-continuous operation; showing scum coverage (left images), and scum thickness and entrained gas bubbles (right images).
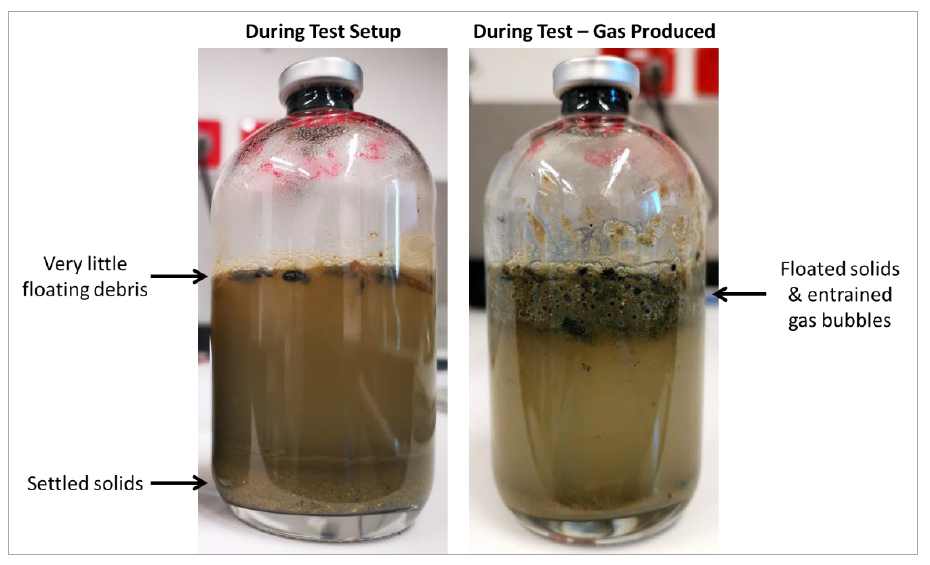
Figure 3: Images of pilot scum (8d HRT sample) behaviour during Specific Methanogenic Activity tests (SMA; a measure of methane producing biological activity). When samples were diluted and mixed during test setup (breaking up the scum matrix), most solids settled out (left image). Once tests began producing biogas, solids refloated forming a scum layer (right image).
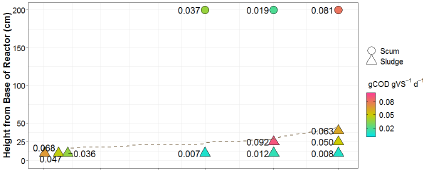
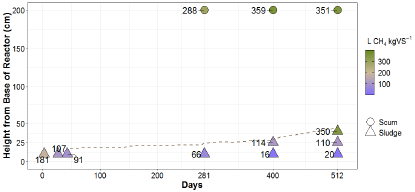
Figure 4: Biological test results for pilot plant scum and sludge samples plotted as a function of reactor height and days since start-up; showing A) SMA, and B) biological methane potential (BMP; amount of methane produced through digestion of degradable material present in sample; normalised to per mass volatile solids). Dashed line represents accumulated sludge height.
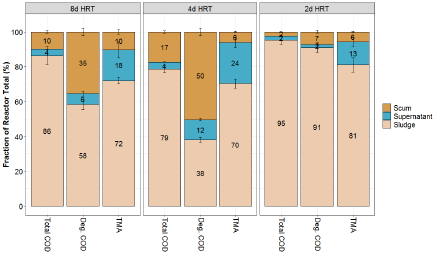
Figure 5: Relative phase (scum, sludge & supernatant) contribution to reactor total COD, degradable COD (Deg. COD), and total methanogen activity (TMA) at the end of each stage of pilot operation.
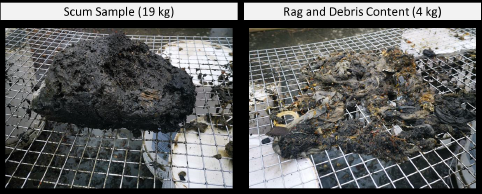
Figure 6: Rag and debris content of AL-1 scum. A 19 kg sample of scum was washed down on 25 mm steel mesh to remove the sludge solids fraction and collect the rags, plastics and other large debris. The rag and debris content comprised ~21% wet weight.
| Estimated Potential in Removed Scum from AL-1 | |
|
Total Volume of Scum Removed (m2) Scum VS (kg m-3)1 Scum Methane Potential (L CH4 kg VS-1) |
80, 000 89 ± 22 534 ± 28 |
| Total Methane Potential Removed (1000m3 CH4)2 | 3,802 ± 1,141 |
|
Average Electrical Conversion (kWh m-3 CH4)2 Electricity Cost ($ kWh-1) |
3.9 ± 0.1 0.2 |
| Estimated Revenue Opportunity ($) | 2,996,546 ± 975,577 |
1 Scum VS is based on average VS of all pilot and AL-2 scum samples and assuming a rag and debris content in scum of 21%
2 Electrical conversion is the average from provided operational data for the onsite power station, equating to a conversion efficiency of 37 ± 1%
Share