


Pumping Sewage Sludge

A challenge for the future.
DOWNLOAD THE PAPER
Abstract
A large portion of the total energy consumption in any wastewater treatment plant is used for pumping wastewater and sewage within the treatment processes. But the efficient operation of sewage pumps requires an accurate calculation of friction losses for which sludge rheological parameters are involved as a control. This work determines the usual variations of rheological parameters of anaerobic digested sludge, waste activated sludge and primary sludge in a wastewater treatment plant over one year of sampling. The impact of model selection and data fitting on the pressure drop calculation is also investigated. The pressure drop calculation for a sludge pipeline using the novel Re3 model was successfully validated with 10% errors against the site observation. The pressure drop calculations for higher solid concentration suggested high variations of pressure drop, which requires further study.
Introduction
Wastewater treatment is an integral part of the sustainable development of modern cities. According to the International Water Association, only 20% of all wastewater is treated globally. Meanwhile, this figure is projected to increase substantially by 2030 as part of the UN Sustainable Development Goals. Additionally, factors including population growth, water shortages and stricter environmental regulations demand a considerable increase in the capacity as well as the efficiency of current wastewater treatment plants (Munro-Smith 2018).
Wastewater treatment plants collect wastewater from municipalities and industries, separate the biosolid fraction (sludge), which still contain water, and treat it in a series of biological processes. Transporting sludge consumes a lot of energy in wastewater treatment plants and its failure can be significantly costly, leading to whole process shut down. Because of that, the transportation systems need to be accurately designed and well operated using sludge flowability or rheological parameters as a control. In this respect, the main challenges are the variability of the rheological data and the inaccurate prediction of sludge pipe flow.
Although the energy usage of the sludge transportation systems is critically important, sludge pumping systems are not commonly operating in their best efficiency points. This is because of the inaccurate calculation of pressure drop for sludge pipeline. By improving the pumping systems, better energy efficiency for wastewater treatment processes can be achieved. Several reasons underlie inaccurate calculation of pressure drop, which results in inefficient operation of sewage sludge pumping systems. This will be investigated in this study and appropriate measures for accurate calculation of pressure drop will be proposed.
Materials
All sludge samples were collected from Eastern Treatment Plant (ETP) in Victoria and sent in sealed plastic containers to RMIT University on the same day for rheological testing. During the travel time, samples were kept in cool boxes to prevent any temperature change. Digested sludge (DS) samples were collected from the sampling point of one of the digesters during two processes:
- Feeding cycle when the digester is fed simultaneously with fresh sludge, and
- Internal circulation of the digester.
The concentration of DS samples was around 2 wt.%, and its temperature was about 37°C. Digested sludge was subsequently thickened using vacuum filtration to 4% and 5.5% total solid concentration. Primary sludge (PS) samples were collected from a sampling point on the gravity belt thickeners. The concentration of the sample was around 4 wt.%, and its temperature was about 20°C. Thickened waste activated sludge (TWAS) samples were collected from the exit line of the dissolved air flotation (DAF) tank. The concentration was around 3.5 wt.%, and its temperature was about 20°C. DS samples were measured on the day of sampling, but PS and TWAS samples were stored in the fridge before the measurement, which was performed within 1 – 5 days of the sampling.
The pipeline selected for validation of results is 900 m long with 100 mm diameter and it carries 25 l/s DS. The pressure at the beginning of the pipeline was recorded manually during the sampling, and the pressure at the end of the line was extracted from the process data.
Results and discussions
Typical variation of sludge rheology
Composition of sludge can change seasonally. In rain season there is more water in the influent of a wastewater treatment plant. In hot summer the sludge microorganisms are more active and the biological treatments are more efficient (Mahmoud, Zeeman et al. 2004, Water Environment 2008). So far, no research has shown the variation of sludge flow properties due to the season changes or process changes. Because of that, the pumping systems are designed based on over assumptions of the sludge flow properties to accommodate such variations. To address this issue, we have determined the variation of the flow properties of the three types of sludge DS, TWAS and PS over one year of measurements in a wastewater treatment plant in Melbourne, Victoria. Rheological properties were obtained using the Herschel-Bulkley model (Eq.2) composed of three fitting parameters of τH (yield stress [Pa]), k (consistency [Pa.sn]) and n (power index). Figure 1 shows the relative variability of sludge rheological parameters as well as its composition determined by chemical oxygen demand (COD) and total solid tests.
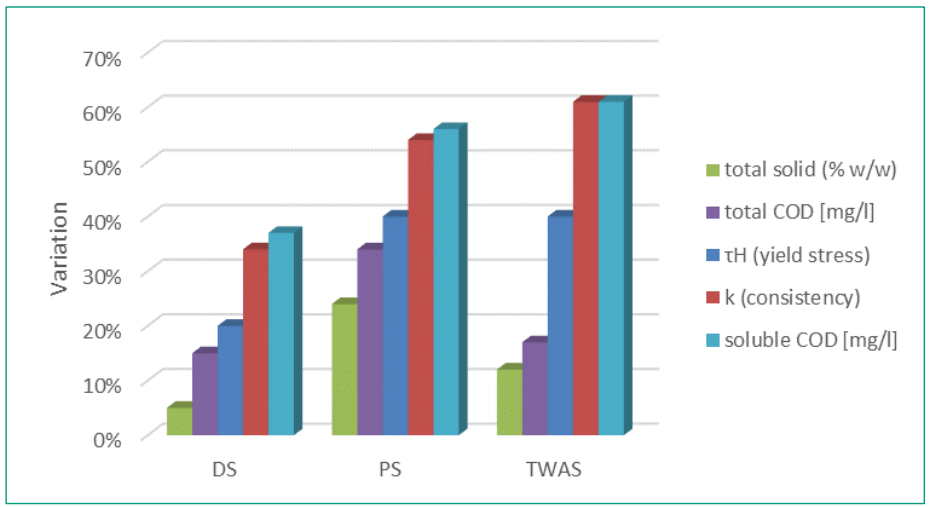
Figure 1: Typical variation of sludge rheological parameters as well as solid content and organic matter over one-year experiments
Among the Herschel-Buckley parameters, variation in k impacts more than others on the variation of pressure drop in the pipeline. k shows 34% variation in DS, 54% in PS and 61% in TWAS, while, τH shows 20% variation in digested sludge, 40% in PS and 40% in TWAS.
Previous work (Farno, Baudez et al. 2015, Hii, Farno et al. 2019) suggested a possibility of predicting rheology from the variation of organic matter. In this method, variation of solubilised COD with thermal treatment was correlated to the variation of rheological parameters. These works also showed that the percentages of sludge solubilisation and its solubilisation kinetic rate were not influenced by sludge concentration.
Figure 2 compares the variation in rheological parameters of PS and the variation in average minimum ambient temperature throughout the measurement. As can be seen, the change of seasons (indicated by ambient temperature) cannot be directly correlated to the variations in rheology although τH and k showed a significant variation, with τH slightly smaller than k. The big variation in τH was probably because of the flocculated nature of the PS. The presence of large particles is an important factor in the yielding behaviour of a suspension-like sludge.
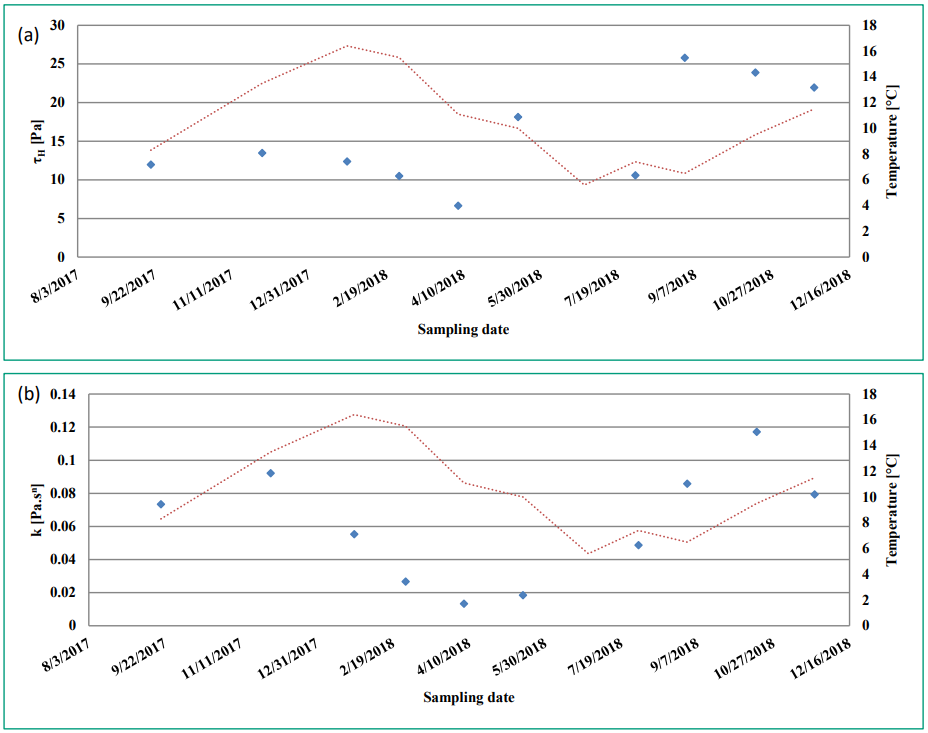
Figure 2: Variation in rheological parameters of the primary sludge (markers) with mean ambient temperature (dashed line) over one year of measurement (2017-2018); (a) τH , (b) k
Pressure drop calculation
To calculate the pressure drop in pipeline, one requires viscosity value, however, for non-Newtonian material like sewage sludge there is no single viscosity value other than a flow curve model. The flow curve model describes the relationship between shear stress and shear rate in which the ratio of shear stress over shear rate is called apparent viscosity. Because the apparent viscosity, unlike Newtonian viscosity, varies with material flow rate, the pressure drop calculation for non-Newtonian material becomes complex, and sometimes inaccurate (Malkin, Masalova et al. 2004, Slatter 2004). To obtain the flow curve model of sludge, one needs to fit the sludge flow curve data (shear stress versus shear rate) with a rheological model (Mulbarger, Copas et al. 1981, Carthew, Goehring et al. 1983, Eshtiaghi, Markis et al. 2013). Three models mostly used for sludge are Bingham Plastic (Eq.1), Herschel-Bulkley (Eq.2) and modified Herschel-Bulkley (Eq.3):

Where τ [Pa] is shear stress, ͘γ = -dv/dr [s-1] is shear rate, v [m/s] is velocity along the flow direction (e.g., along a pipeline), r [m] is flow cross section distance (e.g. radial distant from pipe centre), and τB [Pa], τH [Pa], k [Pa.sn], n [-] and α [Pa.s] are fitting parameters of the models.
As the parameters increase in the model, the model becomes non-linear, while the predictions are more accurate, the fitting procedure and the pressure drop calculation become more complicated.
Regression analysis
To find a model that best describes the sludge flow curve data usually the minimum of the squared distance between the data and the model curves is calculated. This method, which is called least-squared errors, results in an exact answer for linear equation (e.g. Bingham Plastic, Eq.1), however, for non-linear equations (e.g. Herschel-Bulkley, Eq.2 and modified Herschel-Bulkley, Eq.3) it involves a minimisation process in which the best answer is not necessarily achieved by minimising the least-squared errors. As such, in common fitting software, the operator can choose between different objective functions, algorithms as well as model equations (Dochain and Vanrolleghem 2001).
Ideally, for the best model, the experimental data from several measurements is distributed identically and normally around the predictions. However, this is not always the case. For sludge, we showed that the residual error of flow curve fitting using Herschel-Bulkley and Bingham models is not normally distributed and increases with shear rate (Farno, Coventry et al. 2018). To improve curve fitting for this system, one solution is to give a weighting to residual errors. Alternatively, and to avoid subjective judgments; one can use robust algorithms. In a robust fitting, outlier data do not impact on the estimation of model parameters (MathWorks 2016). Another approach is to cut the data posing large residual errors at the high shear rate where the pumping system is not operated. In fact, no perfect algorithm exists for the estimating non-linear model parameters. Through residual analysis on a broad set of sludge flow curve data, the best scenario for sludge parameter estimation has been identified in Table 1 (Farno, Coventry et al. 2018).
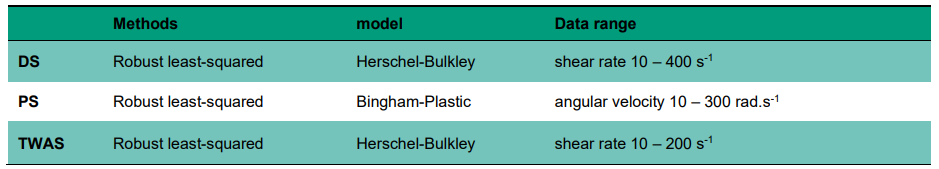
Table 1: Regression scenarios with the best performance for each sludge sample
The Herschel-Bulkley model best fit sludge flow curve data between 10-300 s-1 with a robust fitting method, while modified Herschel-Bulkley best fit sludge flow curve data between 0.1-1000 s-1 with either robust or conventional fitting method. The Bingham Plastic model only shows acceptable performance for PS.
Model parameters which are estimated through the non-linear parameter estimations can be calculated slightly differently for each repeat of the flow curve data (Dochain and Vanrolleghem 2001). Because of that, each parameter is determined with a confidence region (commonly 95% confidence is selected) in which true model parameter exists. The calculation of pressure drops using the fitting parameters within the confidence region results in a range of pressure drops and not a unique value. To investigate the impact of variation of rheological parameters on pressure drop calculation, critical pressure drops (transition point from laminar to turbulent) were calculated by integrating Eq.1 to 3 with respect to pipe radius (Eq.4) and using Re3 friction model (Slatter 1995).

Eq.4 has an analytical solution for α equals zero, but the numerical approach is required for n and α ≠ 0. Re3 friction loss model proposes dimensionless Re3 number (Eq.5) for predicting laminar / turbulent transition in the pipe flow of viscoplastic materials including sewage sludge.
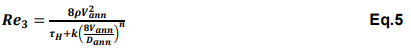
Where Vann [m/s] and Dann [m] are annulus velocity and annulus diameter, ρ [kg/m3] is sludge density and τH, k and n are model parameters of Eq.2. The critical pressure drop was calculated at Re3 equals to 2,100.
Fig.3 presents the probability distribution of critical pressure drop calculation in a typical sludge pipeline (900m length and 100mm diameter) when the model parameters vary in the 95% confidence region.
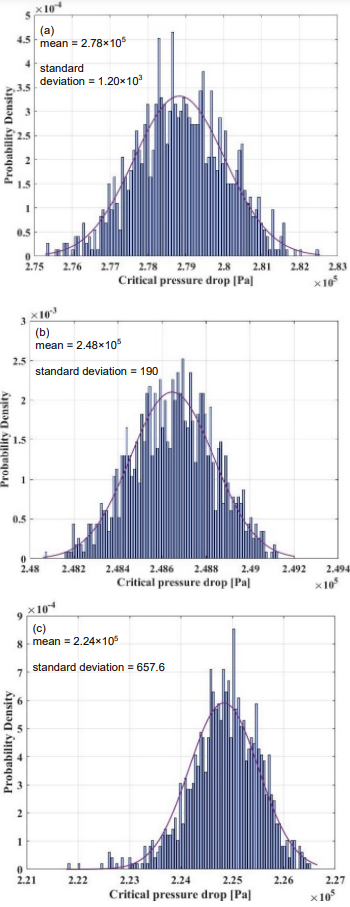
Figure 3: Probability distribution of calculated critical pressure drop using three models, (a) Bingham Plastic (b) Herschel-Bulkley (c) modified Herschel-Bulkley, in a typical sludge pipeline (2% DS in a pipeline composed of 900m length and 100mm diameter) (With permission from Water Research for this Fig. published in Farno et al. 2018)
Comparing the variation of the pressure drops showed that among the studied models, the Herschel-Bulkley model performed best (least standard deviation); it fits a reasonably good range of shear rates but does not induce uncertainty overpressure drop calculations. Whereas, modified Herschel-Bulkley fits better but produced large standard deviation over the pressure drop calculation.
Also, the Bingham-Plastic model was shown unable to fit most sludge flow curve in addition to the wide variation in calculated pressure drop.
We also performed a sensitivity analysis to compare the impact of variation of each parameter on pressure drop calculation which showed for all models, k has the highest sensitivity (see Table 2).
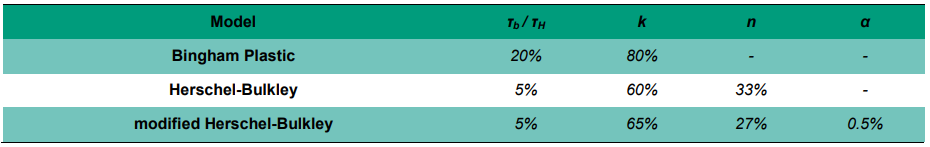
Table 2: Sensitivity analysis of pressure drop calculation (With permission from Water Research for this table published in Farno et al. 2018)
Re3 friction loss model
Table 3 compares the calculated pressure drop by Re3 friction loss model with the pressure drop observation for the 900m pipeline from which DS was sampled over one year. Because of significant viscoplasticity (yield stress) in sludge, Re3 friction loss model was used for this calculation. In the original version of Re3 friction loss model, there are parameters appropriate for mineral slurries, one of them is roughness determined based on the size of mineral particles.
In Table 3, we set up optimisation to change the roughness values of the model to achieve the least average of errors. The result suggests a roughness of 256 μm provides the least error between the calculations and the observations. But the accuracy of this optimisation needs to be verified in future investigations. Generally, because the sludge is opaque, it is hard to measure the sludge particle size. Also, sludge is composed of large structural units called flocs, which themselves are composed of smaller structural units. Applying any shear stress results in destroying the larger units to smaller ones depending on the shear stress intensity. Therefore, the size of these flocs is a function of the applied shear force. Furthermore, this roughness value was used for calculating pressure drop at a higher solid concentration, which again is not verified whether this assumption is correct or not.
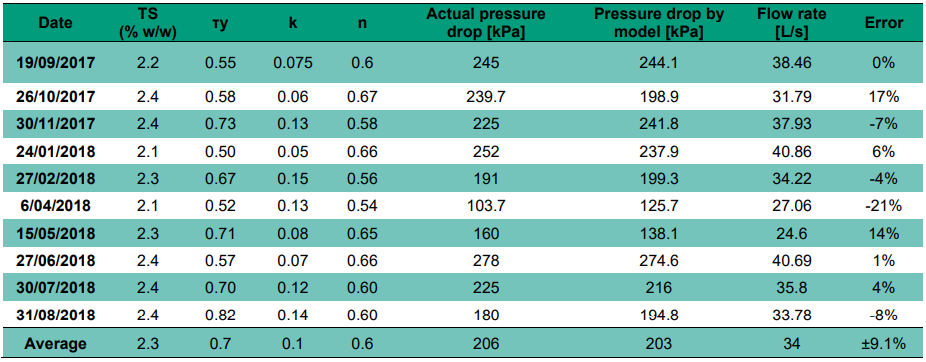
Table 3: Comparisons between calculated pressure drop and recorded pressure drop for 2% digested sludge flowing through the nominated pipeline at 37°
Yield stress of sludge increases substantially with concentration (a power-law relationship exists typically). Because of that, any variation in sludge rheology creates significant variation in the pressured drop, which creates substantial operational challenges, including operating the pumps below the best efficiency point. For example, considering the same variation as demonstrated in Fig.1 exists at higher DS concentration, then the average pressure drop for the measured sludge pipeline (Table 3) will increase significantly as presented in Table 4.
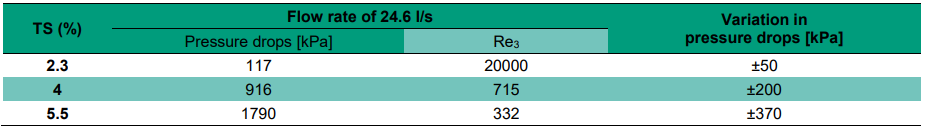
Table 4: Pressure drops predictions at the average flow rate of 24.6 l/s through the pipeline
As tabulated in Table 4, the pressure drop increases by almost four times when the TS increases from 2.3% to 4%. However, an increase in TS from 4% to 5.5% nearly doubles the pressure drop. As can be seen, the flow regime will change from turbulent to laminar because the value of Re3 drops to 715 and 332 for 4% and 5.5% DS, respectively. Laminar pipe flow may result in pipe clogging in long-term operations. 50 kPa variations in the pressure drops of dilute DS pipeline translates up to 200 kPa and 370 kPa variation in the pressure drop over the pipeline if 4% and 5.5% DS is to be transported, respectively.
A design gadget to meet the demands
We have developed a gadget software for the industry to design and optimise the pipeline systems. This tool will be further developed in collaboration with Melbourne Water and Water Corporation (Perth) under the recently funded Australian Research Council (Linkage) Scheme. The gadget provides pressure drop calculations based on a commonly used model of Metzner and Reed (1955) as well as the Re3 friction loss model which was successfully used in mineral industries. For dilute sludge pipelines, the common model is adequate for calculating pressure drop, and the laminar/turbulent transition point.
However, for sludge at high concentration which exhibits significant viscoplastic property, a precise calculation based on Re3 friction loss model is required. This adoption is based on the similarities between the rheological behaviour of thickened sludge and thickened mineral slurries. The gadget is also capable of fitting the three models to any raw flow curve data by implementing the best regression methods mentioned above. It predicts the pressure drops of a combination of pipes with different diameters and provides the pressure drops verse flow rate for each pipe (see Fig.4).
By utilising this gadget, engineers are not only able to use our specialised regression method to obtain rheological properties, but they can also visualise the laminar/turbulent transition point. This way, they can optimise the system to prevent laminar settling as well as inefficient heat transfer in heat exchangers.
Another exciting feature of this platform is that it can predict the rheology of three types of sludge (DS, TWAS and PS) from TS, soluble COD, total COD and volatile solids using a fully trained Artificial Neural Network (ANN) model. ANN modelling has been successfully used in some biotechnological applications (Dochain and Vanrolleghem 2001). The ANN model included in the current version of the gadget only provides predictions at the range of collected experimental data in this work. But in the future version, the ANN model will be developed as such to accurately interpolate sludge rheology from sludge composition at any sludge composition and concentration.
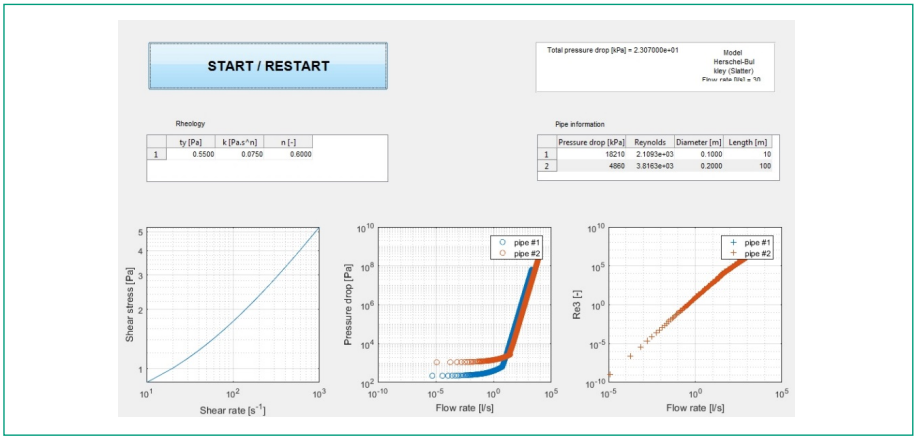
Figure 4: Design gadget for sludge pipeline
Conclusion
This study provided the rheological parameters for DS, PS and TWAS as well as their typical variations over one year which can be used to predict pressure losses in practical sludge pumping systems reliably. The study also investigated a reliable method of analysis and model fitting for sludge flow curve data. The variations in the rheological parameters were determined and compared with the changes in the sludge compositions. The result showed the rheological parameters of sludge weakly correlated to factors such as ambient temperature (season indicator) and wide variations were observed in the parameters over different seasons. Pressure drops calculations using Re3 friction loss model showed a good agreement with the onsite observation confirming the reliability of the methods used for the characterisation and the regression analysis. Also, the rheological parameters of DS at 4% and 5.5% solid concentrations were measured, and a new platform for designing sludge pipeline was introduced.
Acknowledgement
The authors would like to acknowledge the financial support of Melbourne Water and South East Water in partnership with Water Research Australia for this study. Also, the authors would like to acknowledge Dr Kris Coventry, Melbourne Water, for his support for data collection from the wastewater treatment plant.
About the authors
Dr Ehsan Farno | Ehsan Farno is Research fellow, Chemical and Environmental Engineering, School of Engineering, RMIT University. He completed his PhD on the rheology of thermally-treated sewage sludge at RMIT University in 2016. He holds Masters and Bachelor of Chemical Engineering, and he is the author of more than twelve journal papers and eight conferences articles. Dr Farno has developed exceptional expertise in suspensions rheology and pipe flow of non-Newtonian fluids evidenced by eight first-author journal papers in this field. During his postdoctoral research, he has worked in several collaborative projects with industry, and he has contributed to several successful research grants.
Associate Professor Nicky Eshtiaghi | Nicky Eshtiaghi is an Associate Professor in the chemical Engineering discipline of RMIT University. A./Prof. Eshtiaghi is one of the leading researchers in Australia in the area of sludge rheology evidenced through her Scopus h-index of 19, with more than 1280 Scopus citations, Vice-President of Australian Society of Rheology, and her industrial impact in project development and continuing engagement and 3 successful ARC Linkage grants. She investigates the flow behaviour of solid residue (sludge) from wastewater treatment plants with the aim of optimizing the energy efficiency of the process in the sludge treatment lines. She is the recipient of several prestigious awards including 2015 Engineers Australia’s Victorian Professional Engineer of the Year for engineering competence, leadership skills, creativity, innovation, and conspicuous service to the industry, the profession and society, and the 2017 Australian Awards for University Teaching (AAUT) for outstanding contribution to students learning. Before moving to Australia and commencing a PhD at Monash University, she completed her Master’s degrees and worked for six years in the industry. She received her PhD degree in 2010 and started her academic life in the same year at RMIT University as a lecturer. Currently, she is a Fellow of Engineers Australia (EA) and a Fellow of Higher Education Academy (UK), Engineers Australia Chartered Engineer and an Editor in Chemical Engineering Research and Design Journal (Q1, Elsevier).
References
Carthew, G., C. Goehring and J. Van Teylingen (1983). “Development of dynamic head loss criteria for raw sludge pumping.” Journal (Water Pollution Control Federation) 55(5): 472-483.
Dochain, D. and P. A. Vanrolleghem (2001). Dynamical Modelling & Estimation in Wastewater Treatment Processes, IWA publishing.
Eshtiaghi, N., F. Markis, S. D. Yap, J.-C. Baudez and P. Slatter (2013). “Rheological characterisation of municipal sludge: A review.” Water Research 47(15): 5493-5510.
Farno, E., J. C. Baudez, R. Parthasarathy and N. Eshtiaghi (2015). “Impact of temperature and duration of thermal treatment on different concentrations of anaerobic digested sludge: Kinetic similarity of organic matter solubilisation and sludge rheology.” Chemical Engineering Journal 273(0): 534-542.
Farno, E., K. Coventry, P. Slatter and N. Eshtiaghi (2018). “Role of regression analysis and variation of rheological data in calculation of pressure drop for sludge pipelines.” Water Research 137: 1-8.
Hii, K., E. Farno, S. Baroutian, R. Parthasarathy and N. Eshtiaghi (2019). “Rheological characterization of thermal hydrolysed waste activated sludge.” Water Research 156: 445-455.
Mahmoud, N., G. Zeeman, H. Gijzen and G. Lettinga (2004). “Anaerobic stabilisation and conversion of biopolymers in primary sludge—effect of temperature and sludge retention time.” Water Research 38(4): 983-991.
Malkin, A., I. Masalova, D. Pavlovski and P. Slatter (2004). “Is the choice of flow curve fitting equation crucial for the estimation of pumping characteristics?” Applied Rheology 14(2): 89-95.
MathWorks, T. (2016). “Matlab Documentation.” Disponıvel em.
Metzner, A. and J. Reed (1955). “Flow of non‐newtonian fluids—correlation of the laminar, transition, and turbulent‐flow regions.” Aiche journal 1(4): 434-440.
Mulbarger, M. C., S. R. Copas, J. R. Kordic and F. M. Cash (1981). “Pipeline friction losses for wastewater sludges.” Journal (Water Pollution Control Federation): 1303-1313.
Munro-Smith, H. (2018). IBISWorld Industry Report D2921 Waste Treatment and Disposal Services in Australia.
Slatter, P. (2004). “The hydraulic transportation of thickened sludges.” Water SA 30(5): 66-68.
Slatter, P. T. (1995). Transitional and turbulent flow of
non-Newtonian slurries in pipes PhD thesis, University of Cape Town.
Water Environment, F. (2008). Pumping of Wastewater and Sludge. Operation of Municipal Wastewater Treatment Plants: MoP No. 11, Sixth Edition, McGraw Hill Professional, Access Engineering.
Share