


Optimising asset solutions in a capital constrained environment

Servicing growth and maintaining compliance in the sewerage network

Abstract
Infrastructure Victoria states - “Infrastructure is expensive. It takes time to plan, build and make it operational. It lasts a long time and is difficult to change or move afterwards”. Provision of sewerage infrastructure is no different and Greater Western Water needs to be confident in the decisions that we are making in what is being delivered and when.
The Youell Street catchment in Melbourne has challenges with spills and flood events during intense rainfall events. Greater Western Water looked to use optimisation techniques developed by a commercial optimisation framework provider to refine the timing and scope of infrastructure provision. The challenge is to construct the infrastructure at the right time and for minimal cost and disruption.
By utilising optimisation techniques such as genetic algorithms (GA), solutions could be found that would not necessarily be considered during a typical master planning project. These techniques have been used for several years, optimising solutions of water and wastewater networks in an academic context (Murphy et al, 1996, Duncker et al, 2005). Using a workflow that enables the integration of optimisation techniques to the traditional modelling process allowed the team to discover new solutions. Through these solutions it was possible to address first the most critical challenges of the catchment, resulting in splitting the required investment through different phases.
The catchment was studied and configured in an optimisation framework where initial solutions were compared with solutions generated with the help of genetic algorithms. The solutions were further analysed and manually adjusted to achieve a stepwise implementation plan for the catchment.
An optimised solution was developed and further refined, managing to reduce the overall estimated cost by 21% (from $9.5 million to $7.5 million), while achieving zero modelled spills by scenario year 2072 and staging the delivery of the infrastructure. The introduction of phases to the solutions’ implementation process enabled the deferral of more than half of the capital investment. This produced an outcome that was significantly improved when compared to the original preferred solution in terms of costs reduction and improvement of hydraulic deficiencies.
Introduction
Greater Western Water (GWW) is a water retailer in Melbourne providing water and recycled water supply and sewerage and trade waste services for approximately 630,000 residential and non-residential customers in Melbourne’s west and northwest. It manages 43 sewer catchments across 3,700 km2 and has a total sewer length of 6,400 km. As part of GWW’s efforts to manage its sewer network, it carries out regular system performance reviews and master planning on its sewer catchments. The aim is to highlight sewerage networks with constrained capacities and determine how to service growth into the future. This ensures that GWW meets its General Environmental Duty under the Victorian Environment Protection Act 2017.
A catchment that was reviewed in 2022 was the Youell Street catchment – see Figure 1.
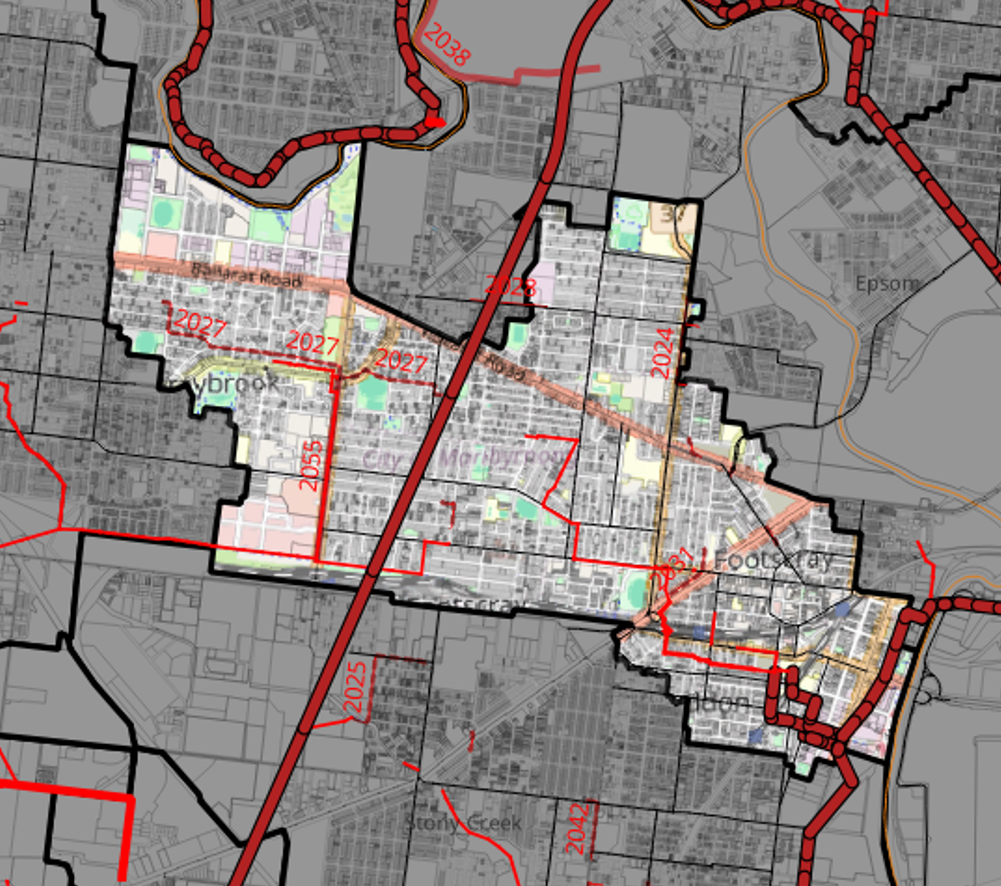
Figure 1 - The catchment of Youell Street, with upgrade projects marked in thin red and Melbourne Water (MW) assets marked in thicker dark red and black.
Catchment description
The Youell Street catchment is an inner western Melbourne catchment centred around Footscray. It currently contains approximately 20,000 residential customers and a further 2,000 non-residential customers. Based upon the Victoria in the Future 2023 and GWW’s growth projections, a further 33,000 customers are expected to move into the catchment over the next 50 years. In 2017 and 2019, the State Government of Victoria, as well as the Maribyrnong City Council earmarked both Footscray and Braybrook as growth areas for Melbourne.
As part of regular reviews, the Youell Street sewer catchment was monitored, and sewer hydraulic models were calibrated in 2013. It was identified that this catchment was non-compliant with required containment standards set by the regulator. Subsequently, later that year, options were investigated to address the catchment’s non-compliance issue. As a result of this work, several options were recommended, and business cases were developed.
Subsequently, the catchment performed well during 2018 and 2019 rain events and there were no significant sewer spills recorded during this period. It was decided to defer some of the capital work and long-term sewer network monitors were installed to gather further evidence of compliance status. These long-term monitors were in-place over 24 months and the catchment compliance status was assessed with long term monitoring data.
Based upon the long-term sewer monitoring, GWW updated and re-calibrated its hydraulic model, which confirmed deficiencies in the network and enabled solutions to be developed to resolve these compliance issues utilising the traditional master planning methodology.
Traditional Master Planning Methodology
At GWW, master planning is undertaken to assess works required to maintain the compliance of a sewer catchment. This generally follows a number of steps:
- Monitoring of the catchment to understand the dry and wet weather characteristics.
- Creation of a sewer model to replicate the catchment. This is generally done in a sewer modelling software package.
- Verification and calibration of the model against the sewer flow monitoring results. This identifies areas where there are constraints and potential spills.
- Once the model has been developed, dry and wet weather scenarios are run on the model to see the impact and whether the network can contain the sewer flows.
- Where the model identifies spills due to rain events, the master planning develops solutions to minimise the sewer spills.
The identification of solutions is generally done iteratively and manually. Areas of likely constraints are identified and then solutions developed. The solutions are added to the model and the wet weather event scenarios are run again. If the wet weather events are contained by the sewer network, then these become the solutions to be delivered.
The 2022 master plan report indicated that under existing network and population conditions, non-compliant wet weather flooding is predicted at ten maintenance holes in the Tottenham branch sewer during a one-in-five-year weather scenario and a controlled spill at the emergency relief structure (ERS), ERS354, that would eventually discharge into Maribyrnong River. This was due to a hydraulic capacity deficiency in the 450 mm diameter sewer between TOT34A and TOY535-26G (over a length of approximately 1.3 km), posing a risk of a spill into the environment. These locations can be seen in Figure 2 below.
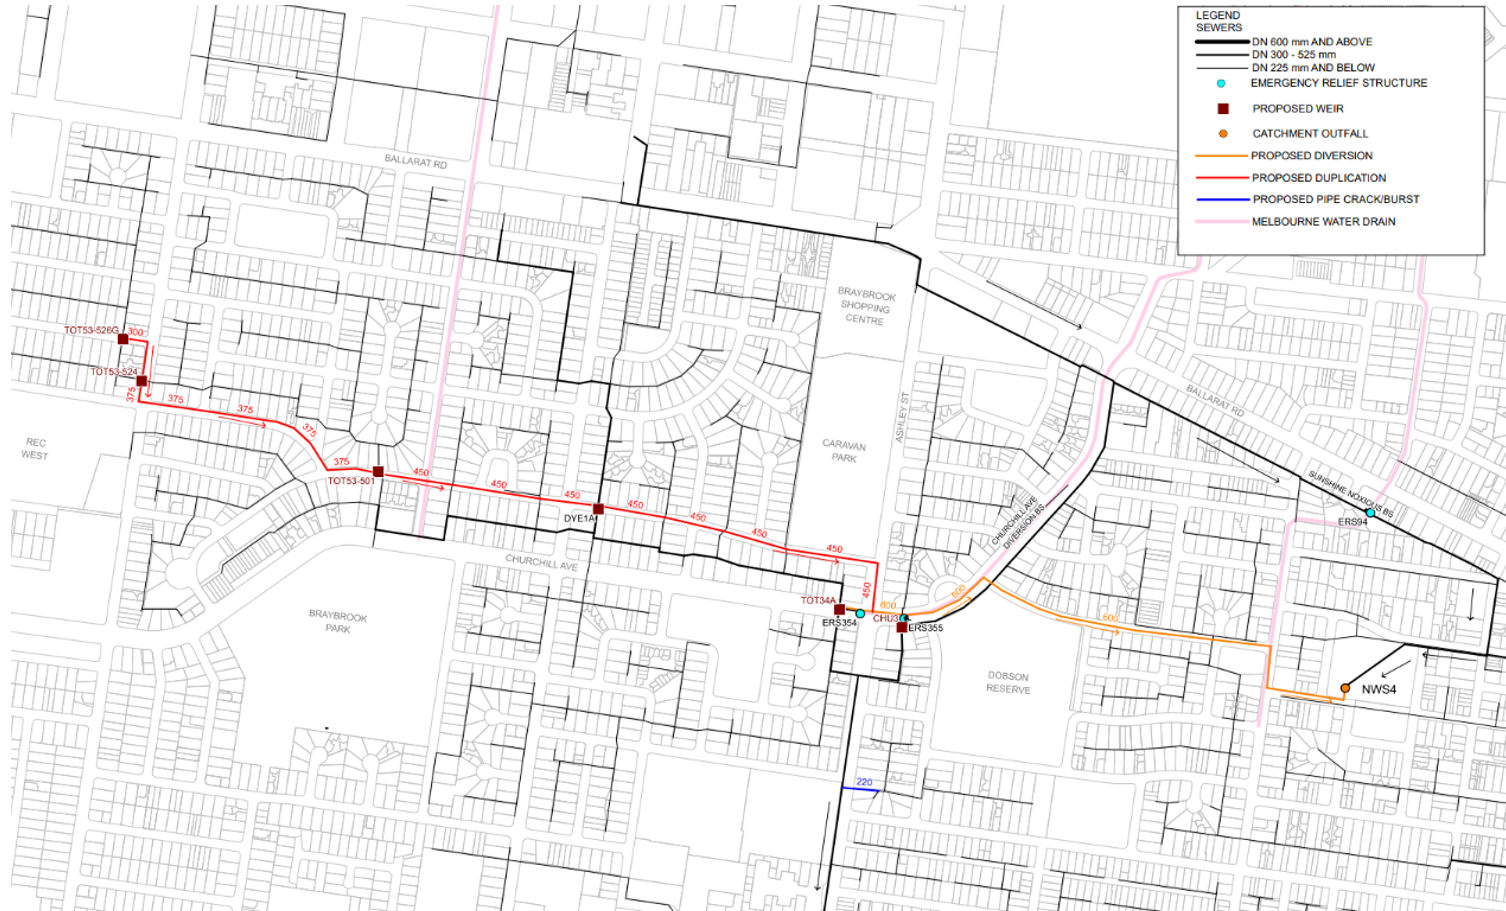
Figure 2 - Proposed 2.4 km of sewer that varied in size from 300 mm to 600 mm in diameter.
A solution was proposed using the traditional master planning methodology to resolve the identified flooding and spills in the catchment. This involved the construction of 2.4 km of sewer that varied in size from 300 mm to 600 mm in diameter. The sewer would be required to be constructed between 5 and 6 m deep, which would necessitate micro tunnelling due to it being in an established area. The proposed works are shown in red and orange in Figure 2.
Project investigation
Following the master planning results, an initial budget was developed which was estimated at $9.5 million. During the design phase the cost estimate increased considerably, due to an industry-wide escalation in cost of works. GWW operates in a capital-constrained environment where significant cost increases bring into question the viability of solutions. The delivery of the Tottenham branch sewer (as part of the Youell Street catchment) was no exception. A review of the project and an alternative solution needed to be found.
At this time, GWW started searching for options to re-evaluate the plans for the Youell Street catchment, and decided to test a commercial optimisation framework that could enable revision and investigation of alternative project solutions.
Method
The test project focused on addressing challenges related to sewer system performance under different scenarios in the Youell Street catchment, using a specialised multi-objective GA to identify alternative solutions. The study sought to identify critical pipelines, assess the impact of population growth and determine necessary interventions for both current and future scenarios.
GAs have been used for several years for optimisation of solutions in water and wastewater networks (Murphy et al, 1996, Duncker et al, 2005). GAs use several operators to curate and modify potential plans, including selection, crossover and mutation to solve complex search and optimisation problems (Liang et al, 2000).
The chosen optimisation framework integrated with the modelling software already in use and had built in options on how to set up the optimisation goals.
To investigate options for managing the compliance of the catchment, the study was split into two analyses: Growth and Master Planning. Firstly, in the Growth analysis, starting from the model’s base 2021 population scenario, population growth was projected for 2028, 2033, 2043 and 2072. The optimisation aimed to maximise growth while minimising hydraulic penalties. A hydraulic penalty is an assigned score based upon the impact that either a spill, flood or restriction has on the operation of the sewerage network. The higher the penalty, the greater the likelihood of sewage escaping the sewerage network. The goal was to identify critical areas where growth could not be accommodated without increasing hydraulic penalties.
Secondly, in the Master plan optimisation analysis, the population scenarios for 2023 and 2072 were chosen, and potential interventions evaluated, including new pipelines and upsizing existing ones. The objective was to minimise both total costs and hydraulic penalties, with results presented in Pareto curves.
Both analyses followed a similar approach that consists of 1) preparation of input data; 2) formulation of the optimisation problem, 3) optimisation evaluations in the cloud, and 4) analysis of optimisation results. These steps are described in the coming paragraphs, and Table 1 displays differences in how they were set up in each analysis.
1. Preparation of input data
The input data preparation included revision of the hydraulic model and determination of population scenarios. The population scenarios were provided from previous GWW studies. In both analyses, the hydraulic model of the Youell Street catchment was used with a wet weather scenario of a one-in-five-year storm event. For the interventions and upsizing of pipelines costs, standard costing functions from GWW were used (varying with length, material and diameter of pipelines).
2. Formulation of optimisation problem
When formulating the analyses’ optimisation problems, objective functions, penalty functions, planning criterion and decision variables needed to be adjusted in the platform to reflect the goals of the analysis.
Each objective function represents a goal of the optimisation, such as minimising costs or maximising efficiency. In a multi-objective optimisation, one or more objective functions can be utilised. In this optimisation framework, the optimisation goal is composed of several objective functions, which are minimised simultaneously by the evolutionary algorithms. The objective functions used in each optimisation analysis are shown in Table 1. In the growth analysis, the goal was to add as much population as possible to the sub catchments (according to population rates provided by the GWW team) while minimising the hydraulic penalties. In the Master Plan analysis, the goal was to minimise the intervention and upsizing costs while reducing the hydraulic penalties.
Table 1 - Differences between optimisation formulation of Growth and Master

Penalty functions were used to impose constraints to decision variables used in the objective functions. In this problem, they were used to push the optimisation away from high penalties for spill and flooding volumes and towards having similar ranges for both (to avoid too much priority being given to either spill or flooding volumes). Table 1 shows the penalty functions used in the Master Planning optimisation.
Decision variables are variables that can be controlled or adjusted within the optimisation problem. They can directly or indirectly influence the solution of a problem. For example, by choosing length or diameter options the algorithm can, indirectly, increase or decrease the upsizing costs of a solution. In this optimisation framework, the decision variables that directly affect plan settings are simply called “decisions”.
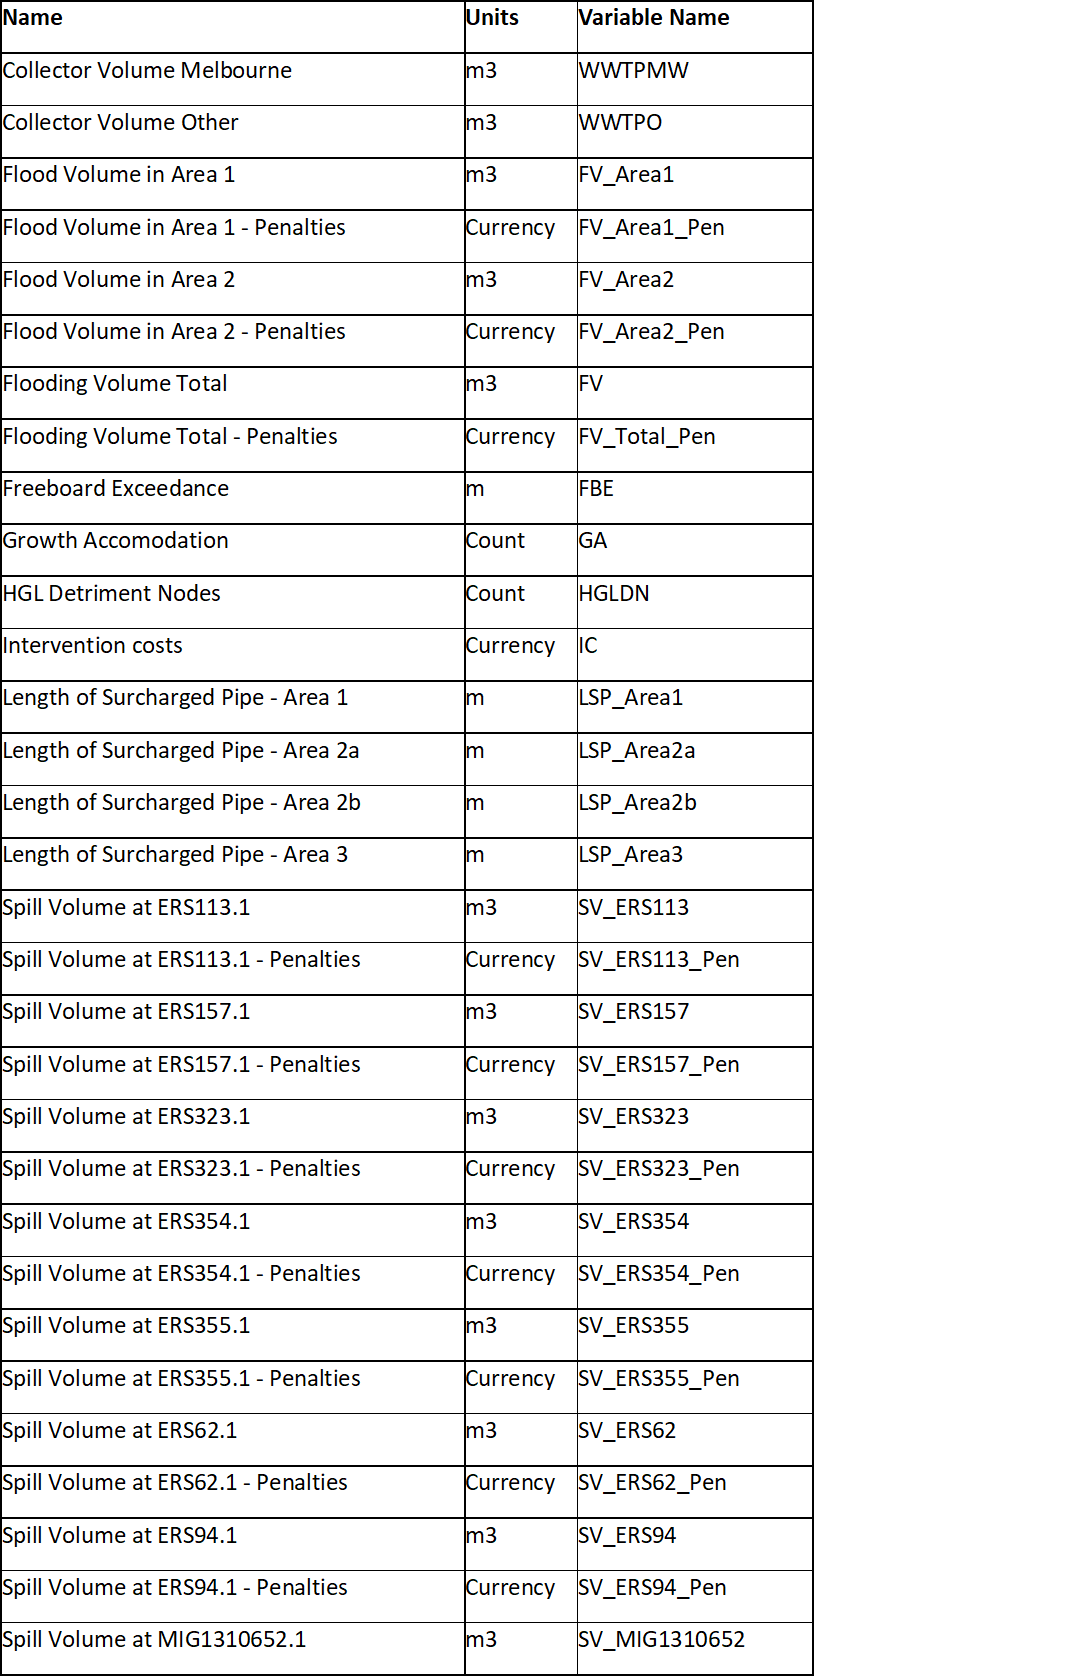
In addition to decisions, there are functions that express planning criteria whose purpose is to observe different aspects of the performance of a solution. Planning criteria are metrics that can contribute directly to the objective function to guide optimisation or simply act as probes that help the user assess the quality of a solution. Such criteria could be hydraulic parameters, costs, population size, etc. The main planning criterion tracked to assess hydraulic performance in both analyses was “spill volume” (calculated based on the spill volume generated at a particular outfall or in all outfall conduits of the catchment) and “flooding volume” (calculated based on the flood volume present at each junction of the catchment). Other planning criterion have been added to track other influencing factors but were not used in the objective equation. In Tables 3 and 4 of the APPENDIX, all planning criterion for both analyses are listed.
Other important criterion used as decision variables were “Growth Accommodation” (count of total population after additional inhabitants have been introduced) and “Intervention” and “Upsizing” costs (used to assess the costs associated with the decisions available of constructing or upsizing pipelines).
Decisions are options given to the optimisation problem that allow for changes in the configuration of the network or settings of the model. For example, for the Growth analysis, the decision was to change sub catchments’ inhabitants’ parameters in the hydraulic model to represent the addition of new inflows. For the Master Planning analysis, the decisions are to add, keep or upsize pipelines representing possible interventions in the network, each of these actions associated with respective costs.
Figure 3 shows the interventions’ alternatives added to the platform. Alternative 3A corresponds to the option designed in the traditional master planning approach and then evaluated as a final solution (estimated as $9.5 million).
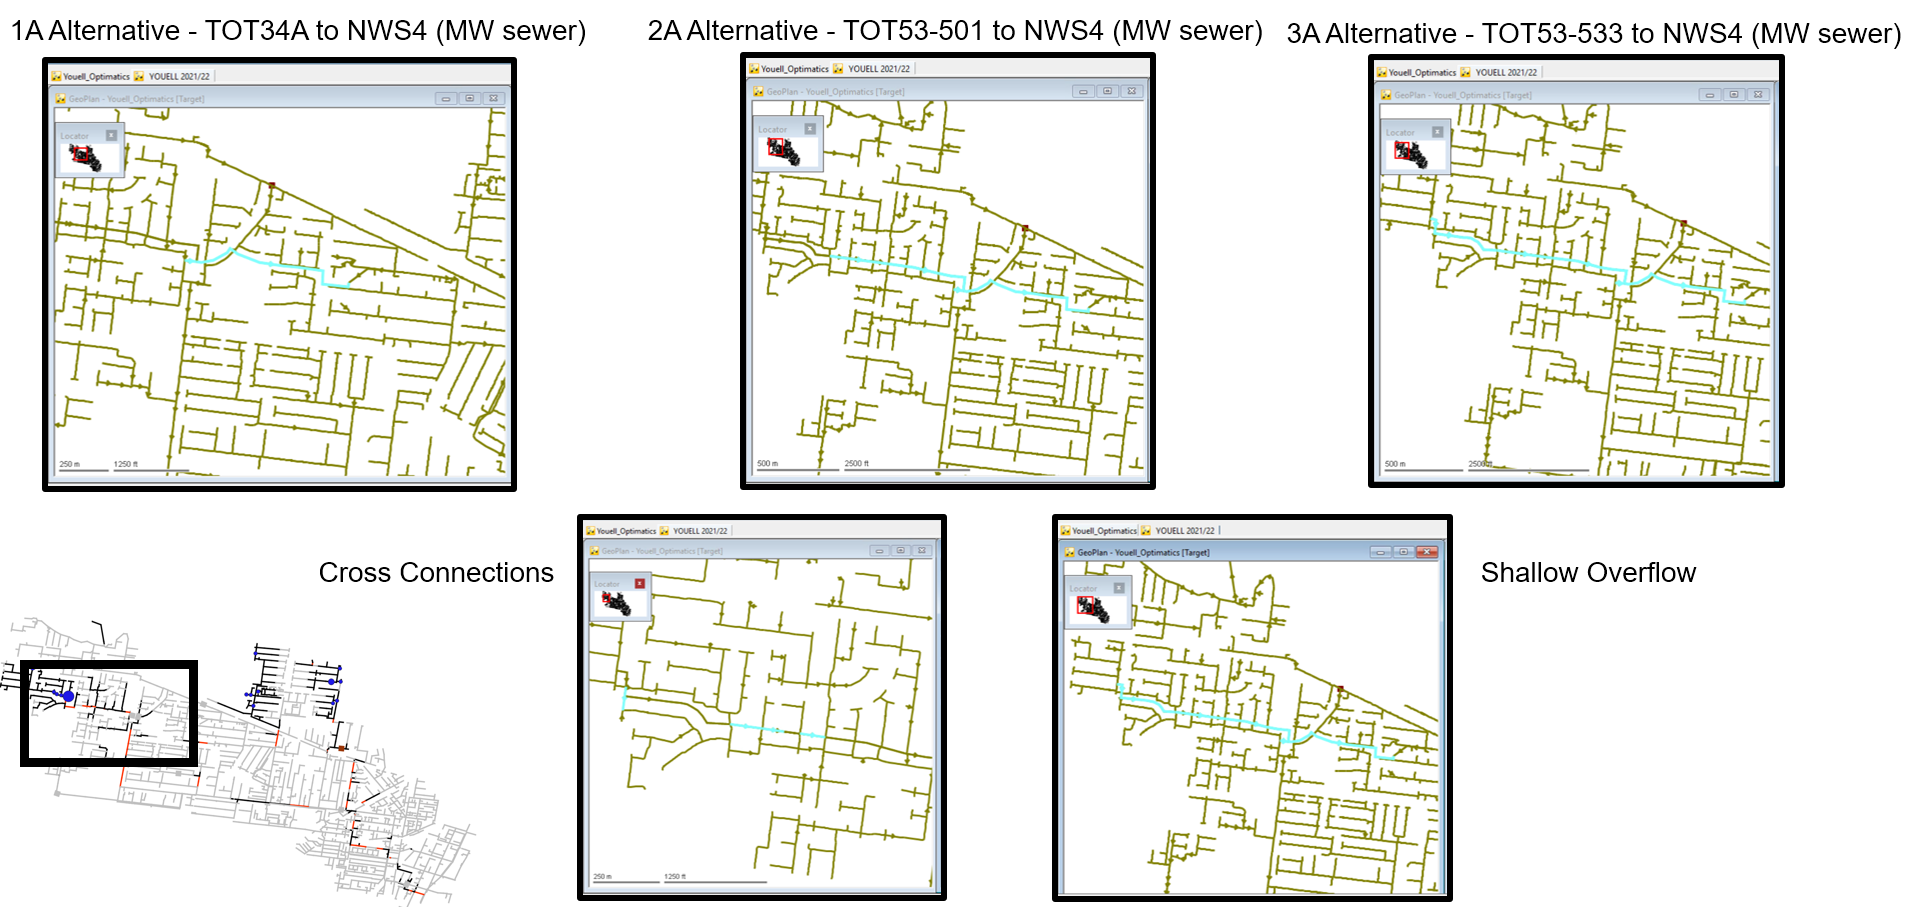 Figure 3 – The light blue pipelines are the alternatives introduced to the optimisation framework as possible interventions
For the optimisation study, Alternative 3A was also broken down to different options that varied from each other (1A, 2A, Cross Connections and Shallow Overflow). These alternatives were evaluated during optimisation runs and could be selected randomly by the platform to be kept or substituted.
Similarly, upsizing of pipes was also introduced as an option. Figure 4 displays which pipelines were selected for upsizing.
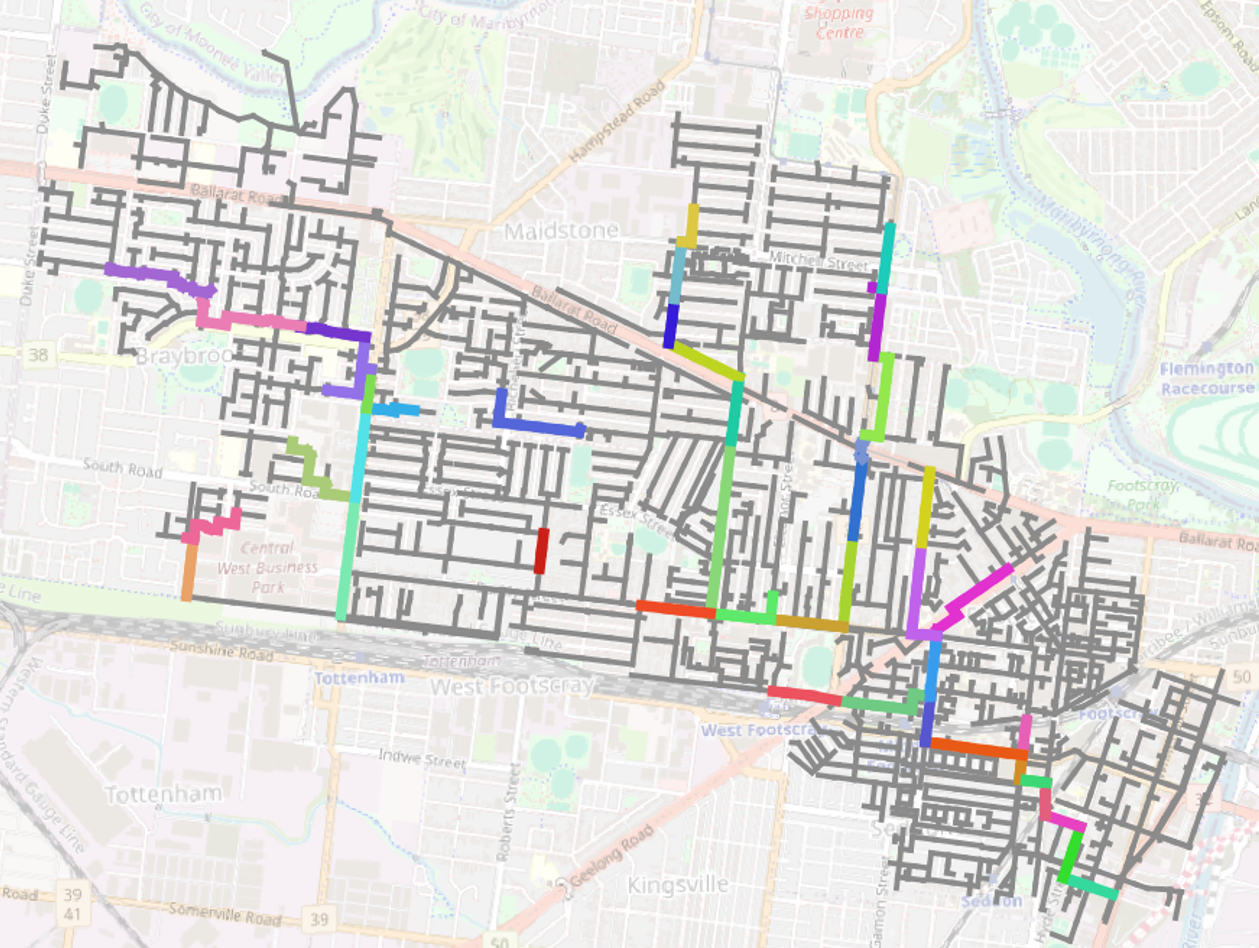 Figure 4 – Groups of pipes where the decision of “Leave Existing” or “Upsize” was available. Each colour represents a group of pipes in the network. Optimisation evaluations on the cloud.
Once the optimisation problem is formulated and set up in the framework, it can be uploaded to the cloud where, in several runs, thousands of solutions are evaluated. GAs assess the performance of those solutions in relation to the goals proposed by the objective function. Based on this assessment, the algorithms determine the next set of candidate solutions with the aim to evolving the solutions closer to the objective goals.
3. Analysis of optimisation results
The optimisation results are displayed in a Pareto front where the objective functions are displayed as axes. In a Pareto front, each point is a solution to the optimisation problem. Each solution on the Pareto front represents a different set of trade-offs in the performance of the solution in terms of the objective functions.
Some solutions are selected by the users and observed geographically and in terms of which interventions were included. A common way of analysing results is to assess which decisions were most often chosen throughout a selection of the solutions (as in the Growth analysis). Also, extra manual solutions can derive from further refined solutions (as in the example of the Master Plan analysis).
Comparison of methods
Traditional master planning methodology looks to carry out the solution identification and development manually, typically focusing on a small number of options (three to 12). On the other hand, the optimisation approach looks more holistically at a whole catchment to develop solutions, creating a massive number of solutions (1,000+), which are rapidly winnowed to a set of solutions that provide a reduced hydraulic penalty score at the lowest/acceptable total cost. However, the best results are achieved when solutions from traditional master planning were added as an input to the optimisation approach, creating more solutions with lower hydraulic penalty score and total cost.
Overall, the timeframes for delivering the solution through both methodologies is largely similar as both require the model to be updated and calibrated prior to the master planning work commencing.
Table 2 – Comparison between Traditional master planning and optimisation approach methodologies

Results
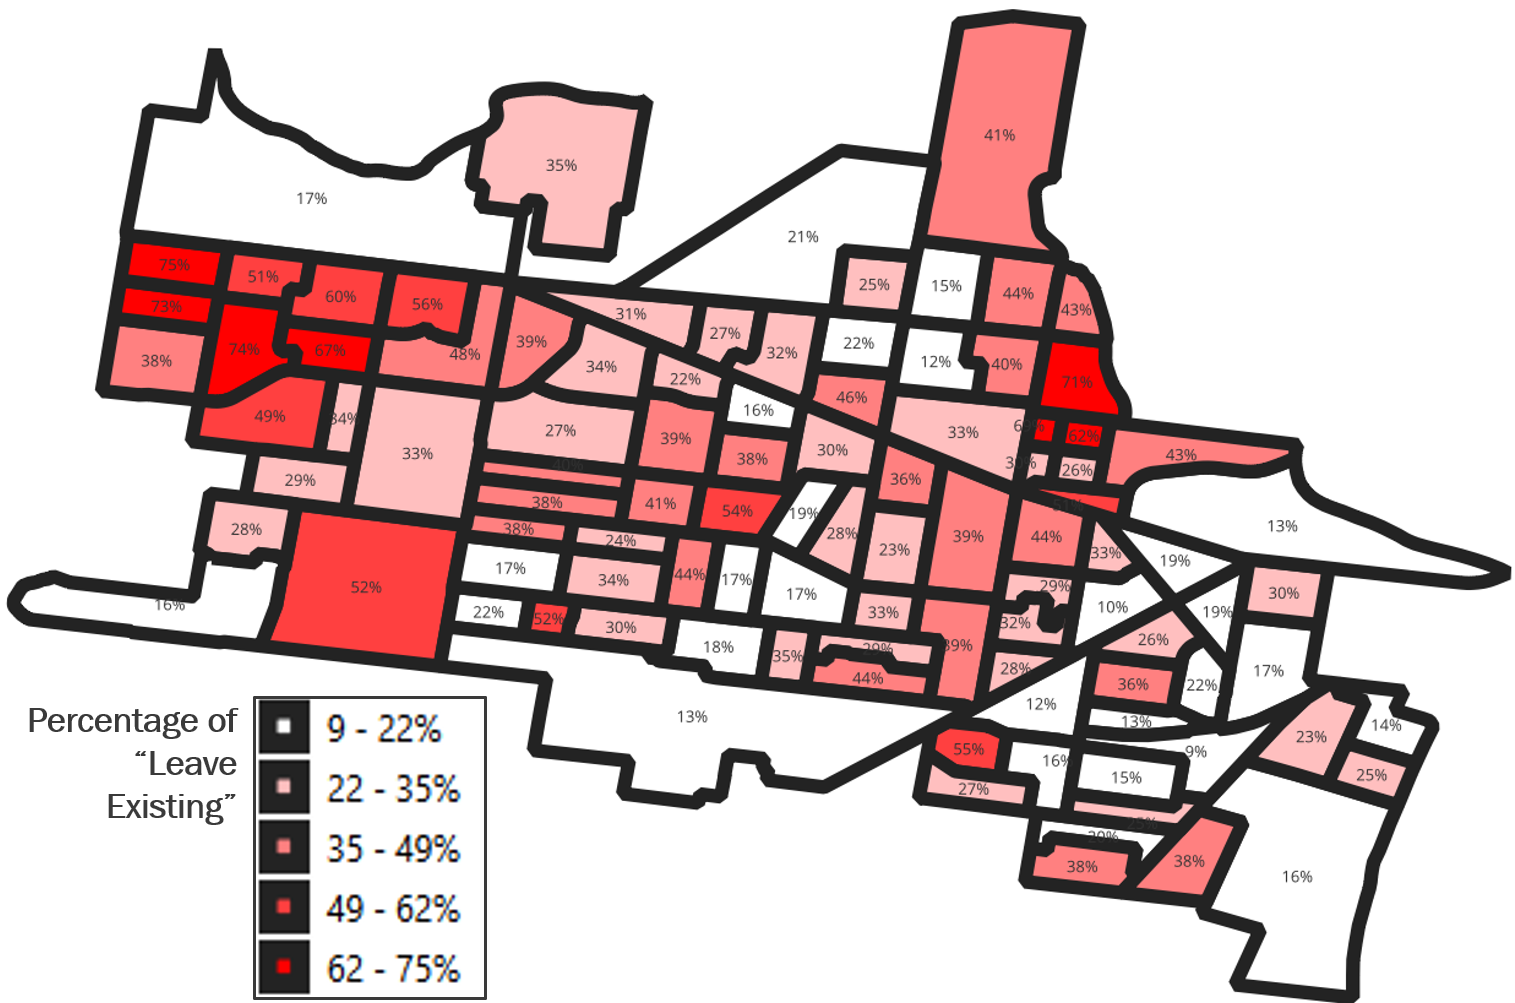
In the Growth analysis, sub catchments are assessed for their capacity to accommodate growth. Where solution decisions are frequently given as ‘Leave as Existing’, this indicates where additional growth could result in significant hydraulic penalties (Figure 5).
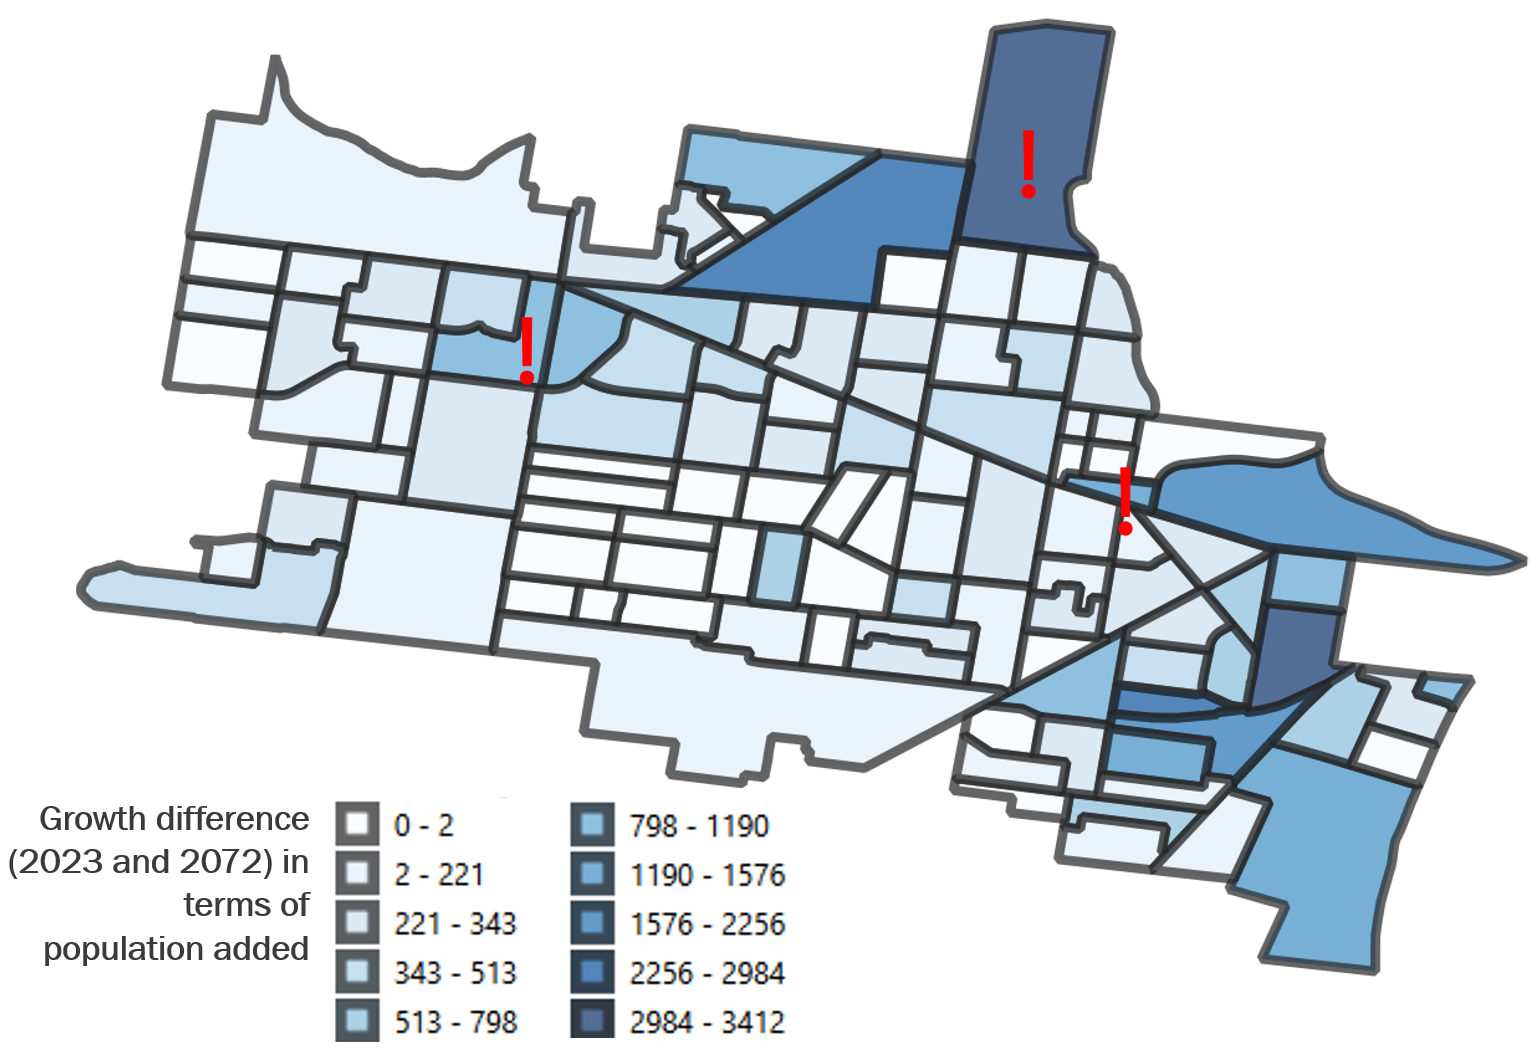
These results were compared with the growth projections provided by GWW, revealing that some high-growth sub catchments coincided with areas of high “Leave Existing” percentages, highlighting potential vulnerabilities (Figure 6).
|
|
| Figure 5 - Percentage of ’Leave as Existing‘ per sub catchment. Areas in dark red represent areas where optimisation analysis chose more often to ’Leave as Existing’, showing less hydraulic flexibility to accommodate growth. | Figure 6 - Growth difference (2023 and 2072) in terms of population added. Highlighted sub catchments have an increased growth projection based on GWW’s estimates and are within the area with low availability for population growth (based on growth analysis results). |
Additionally, growth scenarios for different years were mapped concerning flood and spill volumes, with the 2072 scenario showing increased spills at ERS157 and higher flood volumes in the northwestern and northeastern areas (Figure 7).
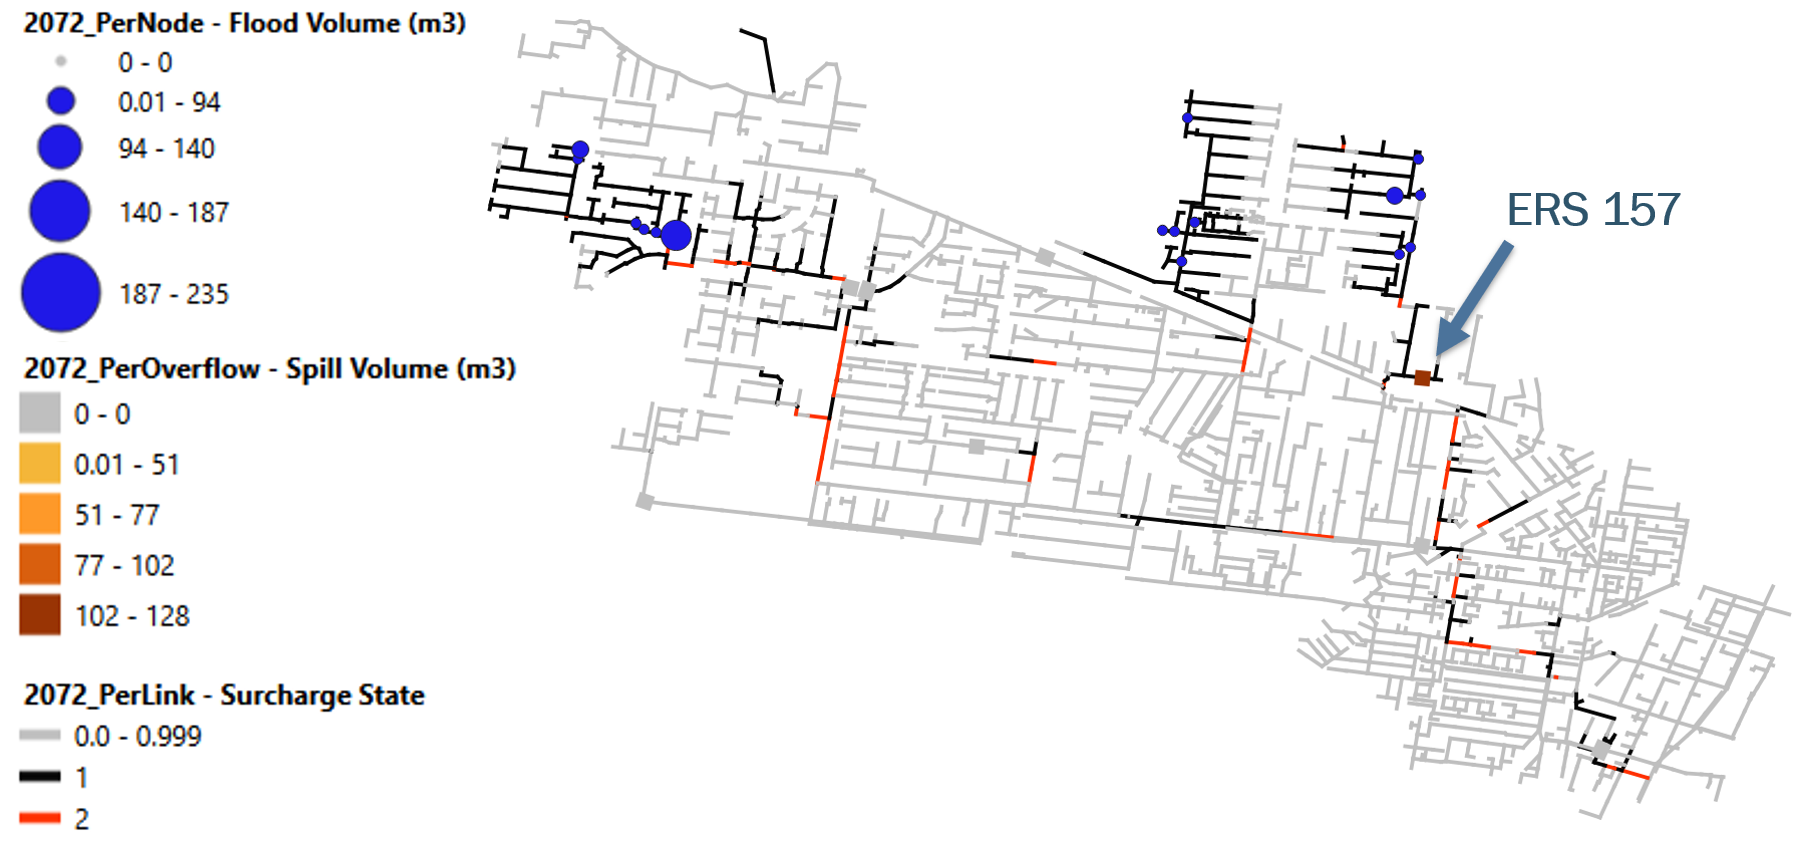
Figure 7 - Surcharge, flood and spill volumes | 2072. Scenario with 2072 projection presents several flood areas and intensification of spill volume at ERS157.
Master plan optimisation
The results from the Growth analysis were used to refine the interventions proposed by GWW. Optimisation runs were conducted for the 2023 and 2072 population scenarios. Optimal solutions were identified and further adjusted, showing lower costs and minimal hydraulic penalties compared to the main interventions considered.
In the optimisation evaluations, the solution plan initially developed by GWW corresponded to option “3A Alternative”. Other variations from these solutions were added to the evaluations (1A/1B Alternative, Cross Connections, Shallow Overflow, 2A Alternative) and were analysed against the optimisation plans, having penalties and implementation costs being calculated consistently with the same methodology throughout all solutions (both optimised and manually developed). The manually developed solutions and the optimised solutions were plotted in terms of hydraulic penalties and total estimated costs (Figure 8). Given the optimised solutions, a manual analysis of the results was performed where optimal solutions for the 2023 and 2072 scenarios were combined to create stepwise solutions (displayed in Figure 8 as blue and purple markers).
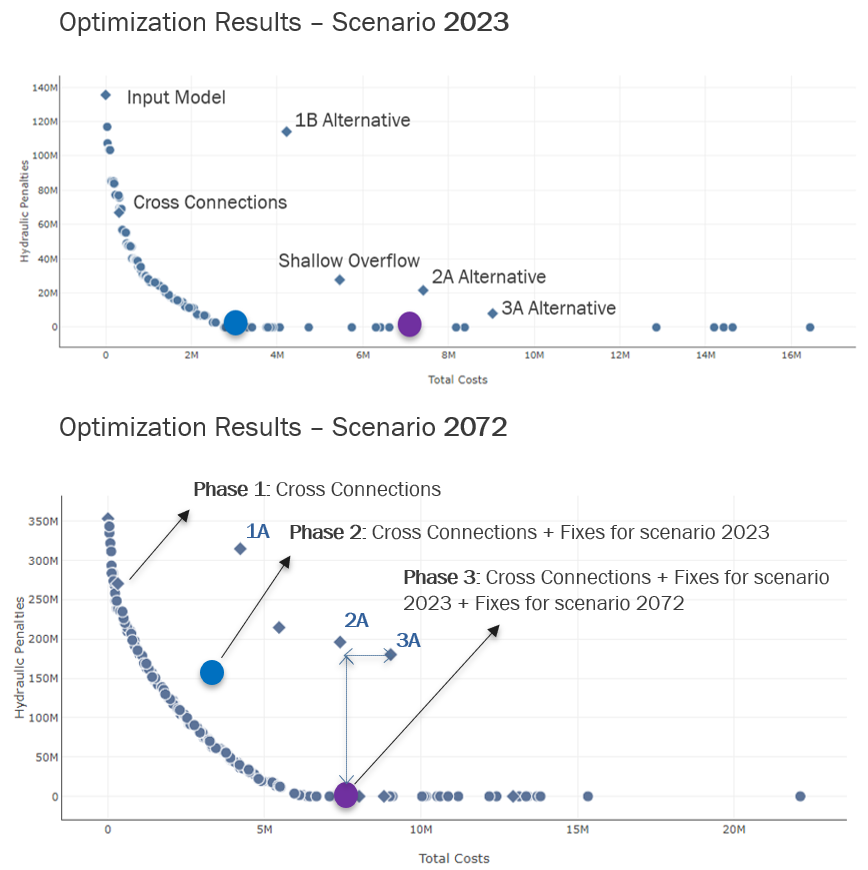 Figure 8 - Pareto fronts with optimisation results of scenarios 2023 and 2072. The ultimate optimal built solution (for 2072 scenario) costs around $7.5 million, $2 million less than the proposed solution with significantly lower hydraulic penalties (3A Alternative $9.5 million) while also solving the hydraulic penalties. The initial solution “3A Alternative” only solves half the hydraulic penalties occurring in the 2072 scenario.
Based on optimisation results, projects were built in a stepwise approach as Phase 1, 2 and 3 (Figure 8). The decisions chosen to be implemented in the network can be visualised in Figure 9).
- Phase 1 was within the initial proposed solutions as the “Cross Connections” option. It reduces hydraulic challenges of 2023 scenario by half when compared with the base 2023 scenario, with an investment of around $300,000. This project was within the initial proposed solutions as the “Cross Connections” option.
- Phase 2 corresponds to Phase 1 (Cross Connections) with the addition of upsizing options. It reduces the hydraulic challenges from the 2023 scenario to minimal with an investment of about $3 million, 68% less than initial proposed plan of $9.5 million (3A Alternative).
- Phase 3 corresponds to Phase 1, Phase 2 and additional length of pipe upsizing. It reduces the hydraulic challenges of 2072 scenario with additional investment of $4 million. Summing up to $7.5 million, this value is still 21% less than the initial plan (3A Alternative) which did not solve all hydraulic challenges present in scenario 2072.
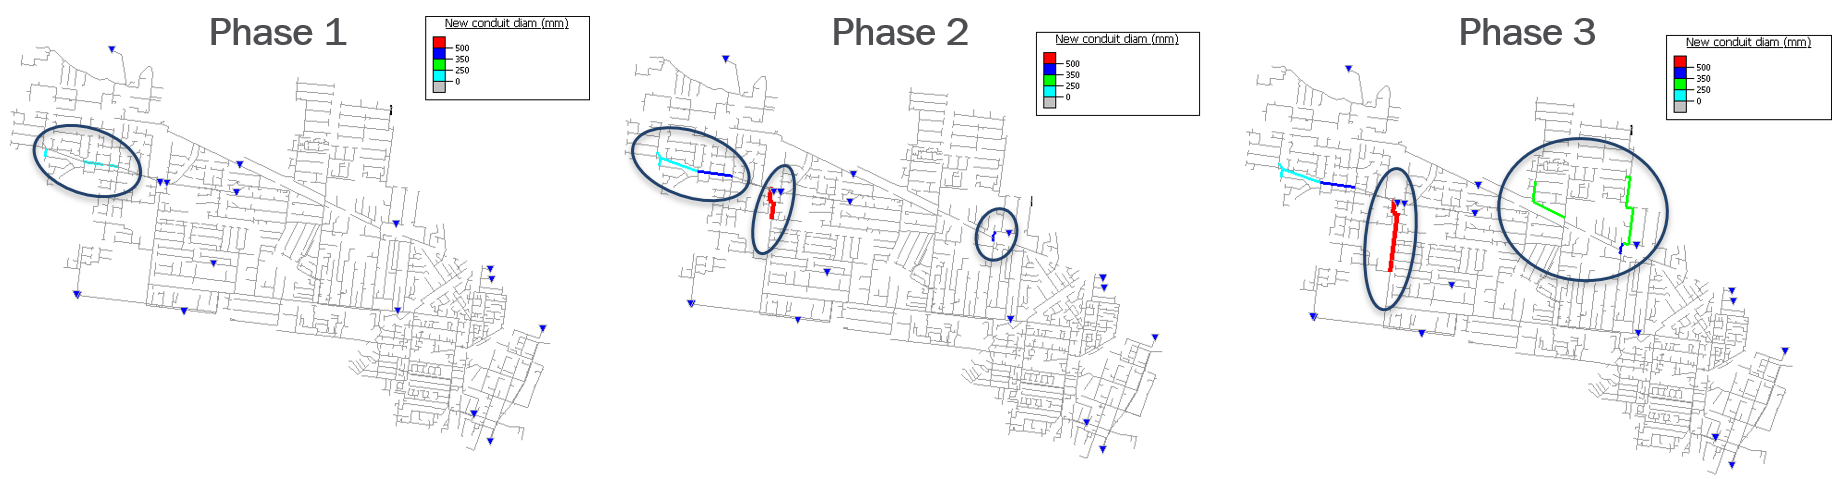
Figure 9 - Phases of works to mitigate non-compliant spills and flooding in the Youell Street catchment with ongoing growth to 2072.
Discussion
If compared with the solution developed during the traditional master planning approach, the optimised solutions presented lower cost alternatives while still reducing the hydraulic penalties. This was due to the choice of more alternatives of upsizing of existing pipelines, substituting some of the options initially thought of as extension of pipeline sections to new areas. These new upsizing options demonstrated the capacity of the network to create additional in-line storage by upsizing upstream pipeline originally installed in smaller diameters.
Since the optimised plans consist mostly of pipe upsizing interventions where the pipeline network already exists, instead of new pipeline augmentations, it is believed that simpler construction techniques can be applied to deliver these sections. The optimal plans will be shared with the design team for further refinement and planning.
Most importantly, besides providing alternatives that seem to require simpler construction techniques, the approach of splitting the investments across multiple years enables the deferral of high capital investment. Implementing projects incrementally per phase and with lower costs ensures that the projects can be delivered closer to when they are required to maintain compliance.
Conclusion
The test project identified critical pipelines and areas within the Youell Street catchment that require attention under both current and future scenarios. The final master plan optimisation and additional refinement revealed alternative pipeline combinations that, when compared to the most complete initial intervention (3A Alternative), offer 68% lower costs (from $9.5 to $3 million) for the 2023 scenario and 21% lower costs (from $9.5 to $7.5 million) for 2072, while also reducing modelled hydraulic penalties for the 2072 scenario to zero when compared with the base modelled scenario, besides enabling deferral of investments. This was not the case with the solutions developed through the traditional master planning methodology.
The modelling efforts during traditional master planning studies can be further enhanced and empowered with the use of optimisation techniques when finding cost-effective solutions to address system deficiencies. GWW is now investigating how these optimisation techniques can be further utilised in the future to support this and other project development.
Acknowledgements
Optimisation Engineer: Maria Alvarenga
Optimisation Advisors: Joshua Cantone, Andrew Erikson, Laurie Murphy, Bradley Alexander
GWW’s team involved in pilot’s technical meetings: William Gielewski, James Forss, Farhan Masud
The Authors
Will Gielewski
With a civil engineering degree from the University of Melbourne, Will has been working in the water industry for over 20 years moving between the asset management, project management and planning sides of the business. Will manages master planning for Greater Western Water’s sewer catchments to ensure that they maintain their compliance and are resilient to growth pressures.
James Forss
An Environmental Engineer from RMIT University, James has been working as a Water System Engineer and Sewer Planner for the last six years. James has managed the updating of numerous water and sewer models to ensure their compliance as well as the future requirements due to growth.
Maria Alvarenga
Maria is an Environmental Engineer with a Bachelor’s degree from the Federal University of Lavras in Brazil and Master’s in Sanitary Engineering from IHE Delft in the Netherlands. As a Senior Optimisation Engineer at Optimatics, she helps utilities leverage digital applications to enhance network efficiency and sustainable operations.
References
Infrastructure Victoria (2023). Choosing Victoria’s future (p. 11).
Master plan solution for the Youell Street Catchment (Greater Western Water, 2024).
Population growth projection (Greater Western Water, 2024).
Project final report results (Optimatics, September 2024).
Murphy, L. J., Simpson, A. R., Dandy, G. C., Frey, J. P., & Farill, T. W. (1996). Genetic algorithm optimisation of the Fort Collins–Loveland water distribution system. In Proc., Conference in Computers in the Water Industry, A WW A, Chicago, April (p. 2).
Liang, L. Y., Thompson, R. G., & Young, D. M. (2000). Designing wastewater collection systems using genetic algorithms. In PRICAI 2000 Topics in Artificial Intelligence: 6th Pacific Rim International Conference on Artificial Intelligence Melbourne, Australia, August 28–September 1, 2000 Proceedings 6 (pp. 415-423). Springer Berlin Heidelberg.
Duncker, A. M., Simpson, A. R., & Wozniak, T. (2005). Staging of master planning of water distribution systems using genetic algorithm optimisation. In Impacts of Global Climate Change (pp. 1-11).
Department of Transport and Planning (2021). Melbourne’s Future Planning Framework – Long term strategic plans to guide land us, infrastructure and development for the next 30 years in the 6 Melbourne Metropolitan regions (https://www.planning.vic.gov.au/guides-and-resources/strategies-and-initiatives/melbournes-future-planning-framework)
Appendix A
Table 3 - Planning criteria used to track results from the Growth optimisation analysis

Share