


New Guidance Values for Chlorine in Marine Waters
First published in Water e-Journal Vol 8 No 1 2022.
Using flow-through toxicity tests, instead of single-dose toxicity tests, to accurately ensure chlorine discharges do not adversely impact the marine environment.
DOWNLOAD THE PAPER
Abstract
Chlorinated seawater is discharged from coastal power plants, desalination plants and ship engines. A water quality limit for chlorine is required to ensure these discharges do not adversely impact the marine environment.
Chlorine decays rapidly in seawater. Field experiments carried out to measure the rate of decay of chlorine found that an initial chlorine concentration of 0.5 to 0.6 mg/L reduced to less than 0.1 mg/L in an hour. A higher initial chlorine concentration of 1.41 mg/L decayed by 50% in about half an hour and by 90% in two hours. Over all four tests, the decay rate was faster than 50% per hour.
Because of this high decay rate, it is impractical to carry out single-dose toxicity tests for chlorine in seawater as the chlorine will progressively decrease over the duration of a 4 hour test, and will be negligible after a 24 hour test. Instead, flow-through toxicity tests must be used.
A Species Sensitivity Distribution was developed using toxicity tests on 30 species from 9 taxonomic groups. The results of a recent sea urchin fertilization test in Sydney were included, replacing the 1981 sea urchin tests in Canada.
Using an application factor of 2, the resulting new Guideline Values for chlorine are
- For 99 % species protection, CPO of 12 µg/L; and
- For 95 % species protection, CPO of 18 µg/L.
Introduction
Seawater is used for a range of activities along the coast and at sea, including cooling water for power stations and ship engines, industrial processes and in desalination plants. Chlorine is often used in these systems to prevent the settling and growth of marine organisms in the pipes and heat exchangers, so that discharge of chlorinated water to the marine environment is common globally. A water quality limit for chlorine is required to ensure these discharges do not adversely impact the marine environment.
Most countries have a water quality limit, or guideline value, for chlorine, and usually the limit for marine waters is higher than for freshwater. This seems intuitive, as marine biota live, eat, reproduce and complete their life cycle in a saltwater environment that is about 2 percent chloride (19,400 parts per million). In comparison, freshwater has very low levels of chloride. Marine algae generate a range of chlorine and halide compounds and there are natural background concentrations of these compounds of up to 3 µg/L in coastal waters, bays and estuaries, as documented below.
The USA EPA recommends an acute limit of 13 µg/L and a chronic (4-day average) limit of 7.5 µg/L for marine waters (US EPA, 1996 and website Feb 2022). The UK has a 95 percentile limit of 10 µg/L for marine waters. British Columbia, Canada has a more stringent (chronic) limit of 3 µg/L for marine waters, based on the envelope encompassing 173 published test results, including the pioneering sea urchin tests by Dinnel et al (1981) and two tests examining the relaxation of oyster and clam muscles (BC, 2021). The Canadian water quality guidelines specify a limit of 0.5 µg/L for marine (and fresh) waters (Canadian Council of Ministers, 1999).
Recently, Batley and Simpson (2021) proposed guideline values for chlorine in marine waters based on short-term (acute) flow-through toxicity tests. Continuous flow tests achieve constant exposure to chlorine whereas static-renewal tests generate variable exposure and the effects depend on the renewal rate of the chlorine solution. They used published toxicity data from flow-through tests, together with data from two 15-min static tests, on 30 species from 9 taxonomic groups in a species sensitivity distribution (SSD) to derive the guideline values. They proposed a 95% species protection limit for chlorine of 7.2 µg/L and a 99% limit of 2.2 µg/L.
The SSD developed by Batley and Simpson is very sensitive to the results of the two sea urchin tests by Dinnel et al (1981). Including the sea urchin tests, the 95% chlorine limit is 7.2 µg/L; excluding just the sea urchin results, the 95% chlorine limit increases to 17 µg/L. Further investigation was necessary and the path followed involved: (1) establishing the rate of decay of chlorine with time; (2) checking whether this had been recognized in the Dinnel et al (1981) tests; and (3) repeating the sea urchin toxicity test with high quality controls to obtain new results for sea urchin toxicity.
Rapid Decay of Chlorine in Seawater
Chlorine dissolves in water as hypochlorite, which is a strong oxidant. In freshwater, the oxidant concentration (hypochlorite) remains relatively constant over time, with a slow reduction due to loss to the atmosphere. In contrast, in seawater, the oxidant concentration reduces rapidly with time due to inorganic reduction reactions as well as volatilisation to the atmosphere (ANZECC 2018, CEE 2018, CSIRO 2019, Jenner and Wither 2011, Saeed et al. 2015, USEPA 2017, Wahab 2012). The rate of reduction of chlorine oxidant is faster at high salinity and high temperature, with reduction of initial oxidant concentration by 70 to 85 % in seawater within 5 minutes of initial production (at 35 psu salinity and temperatures of 10 to 40oC, with faster decay at higher temperature).
Zeng et al (2009) showed that at 15 °C, an initial residual chlorine oxidant concentration of 2.35 mg/L could reduce to approximately 0.8 mg/L in less than 1 minute due to the oxidation by the chlorine oxidants of naturally occurring dissolved inorganic and organic substances. This is followed by a slower decomposition of oxidants to around 0.5 mg/L over 15 min and to around 0.3 mg/L at 15 °C.
In contrast, there was very little decay in the control case of freshwater (1 % decline in chlorine in 30 minutes).
Typically, the addition or generation of chlorine at the entry of a seawater cooling water system produces an initial chlorine oxidant concentration of 0.5 mg/L, sufficient to prevent growth of biota in the pipes. This oxidant concentration decays rapidly in the pipe network to less than 0.2 mg/L and by the time the flow has passed through pumps, pipes and heat exchangers (often over 10 to 15 minutes), the residual chlorine oxidant concentration is generally lower than 0.1 mg/L. This rapid decay is readily observed in laboratory experiments and is apparent at full scale in the cooling water systems of coastal power stations, desalination plants and re-gasification vessels.
Subsequent decay processes in seawater result in total loss of chlorine oxidants over a period of hours in well-mixed aerobic seawater (CEE 2018, Saeed et al. 2015, Water Technology 2017).
Field Measurement of Decay of Chlorine in Seawater
The rapid decay of chlorine oxidants with time has a significant influence on the conduct and results of chlorine toxicity tests. CEE measured the rate of chlorine decay from 0.5 mg/L in laboratory containers used for toxicity tests over 2 hours. It was found that the chlorine concentration in the containers decreased by 50% in 1 hour and by 75% in 2 hours. The experiments by Zeng et al. (2009) (using higher initial concentrations) showed a 40% decay rate in approximately 1-hour.
In the field, there is a combination of dispersion and decay reducing the chlorine oxidant concentration, with dispersion often causing the larger reduction in concentration. However, the loss to the atmosphere in the ocean is much larger than in the laboratory. DHI Environmental (2014) reported a chlorine decay rate of 80% per hour for a cooling water discharge at Scott Reef, WA.
To obtain a field measurement of the rate of chlorine decay, including losses to the atmosphere but without the effects of dispersion, the decay of chlorine was measured using a series of PE bins each 600 mm by 340 mm by 300 mm deep, with 30 L of seawater (approximately 150 mm deep). The bins were set up on the jetty beside the Geelong sea baths.
The seawater was filtered through a fine mesh. The chlorine was added as hypochlorite solution by pipette at initial concentrations in the range 0.5 to 1.4 mg/L. The seawater was lightly stirred to ensure a uniform solution was maintained. The concentration of chlorine oxidants was measured by an ALS chemist (a NATA-certified laboratory) every 5 minutes to monitor the rate of decay until no chlorine could be detected. The measurements took approximately 30 seconds to complete.
The results of the decay tests are plotted in Figure 1. Four initial doses of chlorine were used: 0.55 mg/L, 0.59 mg/L, 0.61 mg/L and 1.41 mg/L.
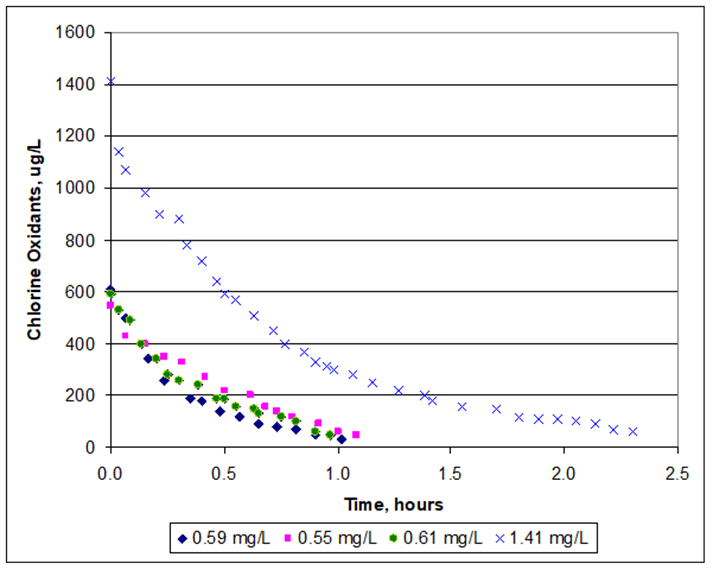 Figure 1. Decay of Chlorine at Corio Bay (CEE, 2021)
The results show that with an initial chlorine concentration of around 0.5 to 0.6 mg/L, the chlorine reduced to less than 0.1 mg/L in an hour. A higher chlorine concentration of 1.41 mg/L decayed by 50% in about half an hour and by 90% in two hours. Over all four tests, the decay rate was faster than 50% per hour. The decay rate is similar to that measured in the laboratory by CEE, slightly faster than measured by Zeng et al (2009) and less that the rate measured at Scotts Reef by DHI Environmental (2014).
Implications of Rapid Decay of Chlorine in Seawater
It is impractical to carry out single-dose toxicity tests for chlorine in seawater as the chlorine will progressively decrease over the duration of a 4-hour test, and will be negligible after a 24-hour test. Instead, flow-through toxicity tests should be used, where the solution of chlorine is constantly renewed in the containers with the test organisms.
For rapid toxicity tests, such as sea urchin fertilisation, it is critical that the chlorine concentration in the test solution is measured within a minute or so of the test. A delay in testing the chlorine concentration will cause the apparent concentration during the test to appear to be much lower than it actually was.
The rapid decline in chlorine-oxidant concentration with time means that a short-term guideline value is more appropriate than a long-term or chronic guideline value for chlorine in marine waters. With an initial concentration of 100 µg/L, and putting aside the initial loss of about 70% in seawater within 5 minutes, a decay rate of 50% per hour would result in 6 µg/L of residual chlorine in 4 hours and only 2 µg/L in 6 hours.
Chlorine and other Halides in Seawater
Seawater contains a range of elements and compounds at concentrations much higher than freshwater. Apart from hydrogen and oxygen as H2O, or pure water, the most abundant element in seawater is the halogen chlorine as the ion chloride. Sodium is the next most common element, followed by other metals (calcium, potassium, strontium), oxidised compounds (sulfate, carbonate, bicarbonate), other halogens (bromine, fluorine and iodine) and non-metals (carbon and boron). These elements and compounds in dissolved ionic form are known as ‘salts’ in water. Seawater comprises the combinations of salts, water, metals and other inorganic compounds.
Life on earth commenced in the sea. Naturally occurring chemical reactions involve transfer of electrons between elements, ions and compounds. These reactions are occurring in living things all the time. The range of marine biota present today have evolved in the presence of halogens. They are accustomed to exposure to chlorine and bromine as ions (chloride and bromide) and a range of related compounds.
Chlorine as dissolved hypochlorite can be easily produced in seawater by electron transfer from chloride. Hypochlorite reacts quickly with the bromide in seawater to create a wide range of brominated oxidants (hypobromite) and other compounds (Gribble, 2015), while the chlorine returns to the salt chloride. These reactions form the basis of the natural halogen cycle in the marine environment (see Figure 2).
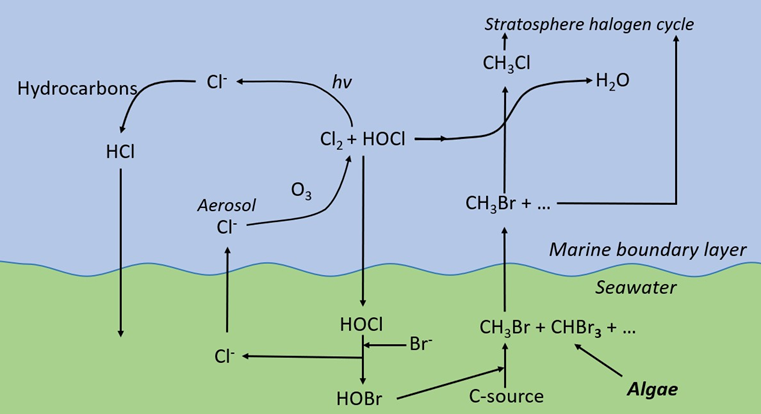 Figure 2. The natural halogen cycle in the marine environment (Source: Jenner and Wither 2011)
Chlorine oxidants can be introduced into cooling water by passing seawater through an electrolysis cell that converts the chloride naturally present in seawater to chlorine gas, which dissociates instantaneously to hypochlorous acid (HOCl) and hypochlorite ion (OCl-). The hypochlorite ion is the main initial equilibrium product in seawater.
Cl2 + H2O ⇔ HOCl ⇔ OCl-
In seawater, hypochlorous acid rapidly reacts with natural bromide (Br-) to create hypobromous acid (HOBr), while the chlorine component of the hypochlorite creates hypobromite (OBr-). In both cases the chlorine returns to the original chloride ion.
HOCl +Br- ⇔ HOBr + Cl-
OCl- + Br- ⇔ OBr- + Cl-
This series of reactions is rapid and almost complete within 10 seconds (ANZECC 2000, Jenner et al. 1997, Saeed et al 2015, Wahab 2012). Hypobromous acid represents approximately 80% of the oxidants at a seawater pH of 8.1. The antifouling and oxidative capacity of electrolysed seawater is therefore largely due to hypobromous acid. Residual chlorine products in the discharge from a seawater cooling system return almost entirely to seawater or are volatilised to the atmosphere.
Hypobromous acid also is naturally produced by marine algae and decays naturally to bromide, water and brominated organics as it oxidises dissolved inorganics and organics in seawater (Figure 2 and Figure 3).
The chlorine and bromine oxidation chemicals used to prevent biological growth in seawater are referred to as chlorine produced oxidants (CPO). The CPO are also referred to as total residual chlorine oxidants or simply residual chlorine, with concentrations expressed as mg/L or µg/L chlorine for consistency with the original form of the oxidant and its analytical measure. In this paper, chlorine and CPO are the same.
Other residual dissolved products of seawater chlorination are known as chlorination-produced byproducts (CPB). As discussed above, they are produced by the oxidation of organic and inorganic material by the CPOs and represent less than 6% of the chlorine concentration initially produced (Jenner and Wither 2011). Most of the CPB are present as trihalomethanes (THM), which are mostly tribromomethane or ‘bromoform’, with others such as bromoacetic acids and bromophenol in lower proportions (Abdel-Wahab, 2010, Alloniere et al 1999, Boudjellaba et al, 2016, Jenner and Wither, 2011, Satpathy et al, 2010). The concentration of byproducts (CPBs) is not measured in CPOs.
Biological Production of Halides
The oceans are a large source (and sink) of halomethanes which may volatilize to form atmospheric bromomethane, chloromethane and iodomethane. Figure 3 shows a simplified representation of the halide transfer from the ocean to the atmosphere. The biological sources in the ocean are widely studied because of the effect of halides in the atmosphere on ozone.
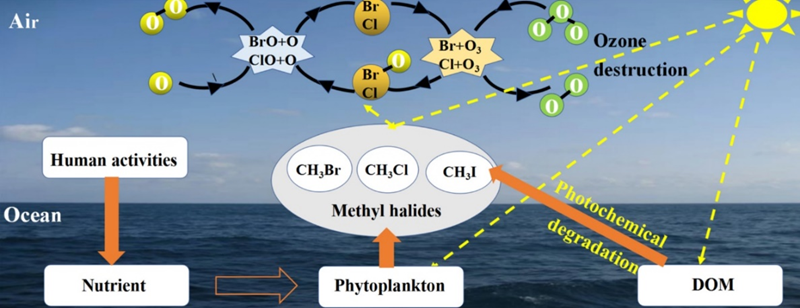
Figure 3. Transfer of Halogens from the Ocean to the Atmosphere
Halogen compounds are produced naturally by marine algae (kelp and the red alga Asparagopsis are noted producers). Organobromine compounds are produced naturally by many marine species including macroalgae, phytoplankton, sponges, corals, sea slugs, tunicates, sea fans, fungi, lichen, algae and bacteria (Gribble, 2000).
The mean fluxes of methyl halides in the western Pacific Ocean were measured by Liu et al, 2021 at 1,500 µg/m2/yr for CH3Cl, 160 µg/m2/yr for CH3Br and 180 µg/m2/yr for CH3I. Grose (2008) measured the mean concentration of methyl halides in Tasmanian coastal waters offshore from Cape Grim as 3 ng/L for CH3Br and 6 ng/L for CH3I.
Carpenter et al (2000) studied short-lived halocarbons in the coastal East Atlantic and measured the release rates of CHBr3, CH2Br2 and CHBr2Cl from ten species of brown, red and green macroalgae. Bromoform was by far the most abundant product produced by the macroalgae, being produced at a rate 800 times that of methyl bromine. Applying this ratio to the measurement of 3 ng/L for CH3Br at Cape Grim, the estimated bromoform level is approximately 2 µg/L.
Bromoform occurs naturally in seawater in bays, estuaries and coastal waters as a result of natural production by marine macro-algae and micro-algae found in all coastal marine environments (USEPA, 2012, Boudjellaba et al, 2016, Gribble, 2012).
Goodwin et al (1977) estimated that the production of bromoform along the coast of Orange and San Diego counties by Macrocystis pyrifera averaged 3,000 t/yr. Leedham et al (2013) estimated that the production of bromoform along the coast of Malaysia by algae averaged 2,400 t/yr.
Stemmler et al (2015) estimated that global bromoform production in the ocean is 53,000 t/yr while Grose (2008) estimated that global bromoform production in the ocean is 62,000 t/yr. Carpenter et al (2000) listed measurements of average and peak bromoform concentrations in various coastal locations. Figure 4 shows the peak concentrations measured at ten coastal locations.
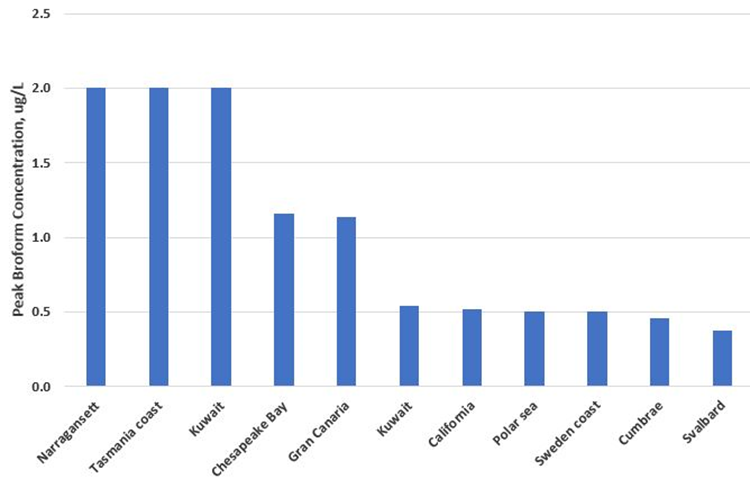
Figure 4. Peak Bromoform Concentration Measured in Coastal Waters
The peak bromoform concentrations range from 0.5 to 2 µg/L. In addition to bromoform, there are a range of other halides present in coastal waters including dibromomethane (CH2Br2), bromochloromethane (CH2BrCl), dibromochloromethane (CHBr2Cl), and dichlorobromomethane (CHBrCl2), (Quack and Wallace, 2003). It is apparent that natural background levels of halides in bays, estuaries and coastal waters can be in the range of 1 to 3 µg/L. As noted previously, these halides volatilize rapidly to the atmosphere and so the daily or annual flux load of halides through the coastal environment is considerably greater than the static load calculated from the concentration at a particular moment in time.
Recognising that marine biota is accustomed to the natural cycles of halides in the ocean, a marine water quality limit for chlorine should be above the natural concentration of dissolved halides in bays, estuaries and coastal areas.
Sea Urchin Toxicity Test
The sea urchin is a common species in southern Australia and adults are seen in patches amongst seagrass around the coast. Sea urchins are often used for fertilisation toxicity tests – for example the Environment Protection Licences issued to the Sydney Water coastal treatment plants have a requirement for regular toxicity testing of the effluents using the sea urchin Heliocidaris tuberculate (Sydney Water website, 2022). H tuberculata is a close relative of H erythrogramma.
The sensitivity of fertilisation of sea urchins to chlorine oxidants in seawater was tested by Ecotox Services in Sydney, following NATA-accredited methods in 2017 (CEE 2018). The test procedure is summarised in Table 1.
Table 1. Australian Sea Urchin Fertilisation Test Protocol
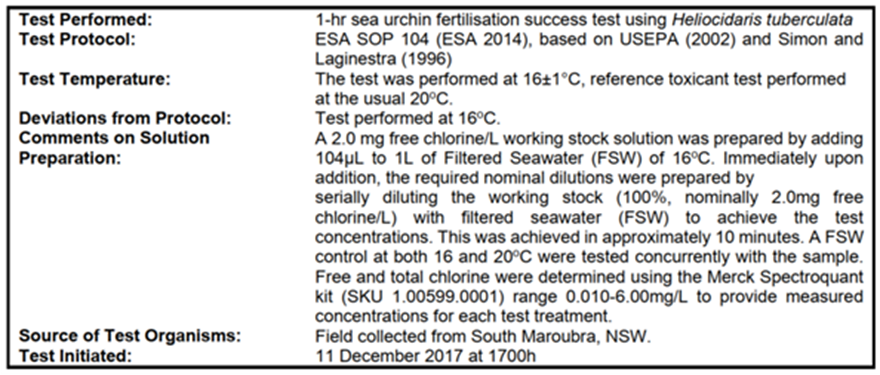
The nominal and measured chlorine concentrations are shown in Table 2. The measured chlorine concentrations in the test preparations were within the range of the test dilutions used in the test.
|
Nominal CPO mg/L |
Measured CPO mg/L |
|
2.0 |
2.02 |
|
1.0 |
0.95 |
|
0.5 |
0.46 |
|
0.1 |
0.081 |
|
0.05 |
0.038 |
|
0.01 |
0.021 |
The statistical outcomes are listed in Table 3. The No Observed Effect Concentration (NOEC) for fertilisation success of sea urchins corresponded to 38 µg/L chlorine, ie, fertilisation of Pacific Ocean sea urchins from southeast Australia were not affected by chorine oxidant concentrations of (or less than) 38 µg/L. The Lowest Observed Effect Concentration (LOEC) was 81 µg/L.
The Inhibition Concentration (IC10) was 59 µgCl2/L and within the range of test concentrations and so did not require extrapolation. The measured median Effect Concentration (EC50) was 133 µg/L.
|
Outcome |
Chlorine concentration, µg/L |
|
NOEC |
38 |
|
IC10 |
59 |
|
LOEC |
81 |
|
EC50 |
133 |
The results of these Sydney sea urchin toxicity tests are consistent with the field observations of substantial numbers of sea urchins thriving in Corio Bay in a habitat exposed to consistent CPO concentrations of 5 to 10 µg/L.
Derivation of the Marine Guideline Value for Chlorine
The derivation of the guideline value for chlorine in marine waters follows the procedures outlined by Warne et al. (2018) and used in the Australia and New Zealand Guidelines for Fresh and Marine Water Quality. Because of the high reactivity of chlorine, and short lifetime of the reaction products (several hours) with no persistence or accumulation in the environment, it was appropriate to propose a short-term guideline value rather than one based on longer-term chronic effects.
Batley and Simpson (2020) completed a very good review of all available toxicity data from various sources, including the Canadian Council of Ministers of the Environment (1999), US EPA Protection Agency (1985) and additional recent literature data including a quality assessment to meet the ANZG (2018) criteria score for satisfactory toxicity data. There were 16 different marine invertebrate bioassays, 11 fish bioassays and 2 chronic algae bioassays.
All the tests were continuous flow tests except for two short sea urchin/sand dollar fertilisation tests by Dinnal et al (1981). Figure 1 of Batley and Simpson (2020) shows that two sea urchin tests with EC50 values of 5 and 6 µg/L were included.
As they had such a large influence on the outcome, the experimental procedure of the Dinnal et al 1981 tests was reviewed. No information is provided in the publication on the gap between the test and the analysis of chlorine. The quoted reaction time in the sea urchin tests is listed as 24 hours and 48 hours (Dinnel et al, 1981). However, according to the chlorine decay rates described above, no CPO would remain in solution after such a long period. It also is noted that filtering the seawater increased the tolerance of sand dollars to CPO by a factor of three, which suggests that a component of the seawater other than chlorine may be causing the toxic response (the sand dollars were tested in parallel with the sea urchins).
The Canadian Council of Ministers of the Environment (1999) rejected the results of Dinnel’s sea urchin and sand dollar tests stating that, “the lowest reported acute effects thresholds, reduced egg fertilization success for sand dollar and sea urchin sperm … were not considered acceptable due to reservations with respect to the analytical methodologies and testing protocols”.
Considering these issues, it is concluded that the Canadian test results should be replaced by the more rigorous test using Australian sea urchins. Adding data from the 27 continuous flow tests listed by Batley and Simpson (2000), the species sensitivity distribution was plotted using Burrlioz software (see Figure 5) to determine chlorine concentrations corresponding to 99%, 95% and 90% species protection. Note that the concentrations plotted are the published EC50 values from the various tests.
Applying the Burrlioz distribution of best fit to all the test points in Figure 5, the threshold CPO concentrations are:
- For 99% species protection, CPO of 25 µg/L;
- For 95% species protection, CPO of 37 µg/L; and
- For 90% species protection, CPO of 47 µg/L.
Batley and Simpson (2000) applied a factor of 0.6 to convert the LC50 concentrations used in the SSD to a No Effect or Low Effect (LC5) concentration based on tests reported by Morgan and Prince (1977). In tests on eggs and larvae of 5 estuarine fish species, and the recent sea urchin tests, the LC10/LC50 ratio was 0.44, 0.50, 0.53, 0.55, 0.66 and 0.76.
For this assessment, a more conservative factor of 0.5 is adopted to convert the LC50 concentrations used in the SSD to a No Effect or Low Effect (LC10) concentration. This factor corresponds to the minimum Application Factor of 2 as recommended by the Canada Ministry for the Environment (2019).
Applying this factor, the resulting Guideline Values recommended for chlorine are:
- For 99% species protection, CPO of 12 µg/L;
- For 95% species protection, CPO of 18 µg/L; and
- For 90% species protection, CPO of 23 µg/L.
The recommended Guideline Values for marine waters are similar to, but higher than, the UK 95 percentile limit of 10 µg/L and the USA EPA acute limit of 13 µg/L.
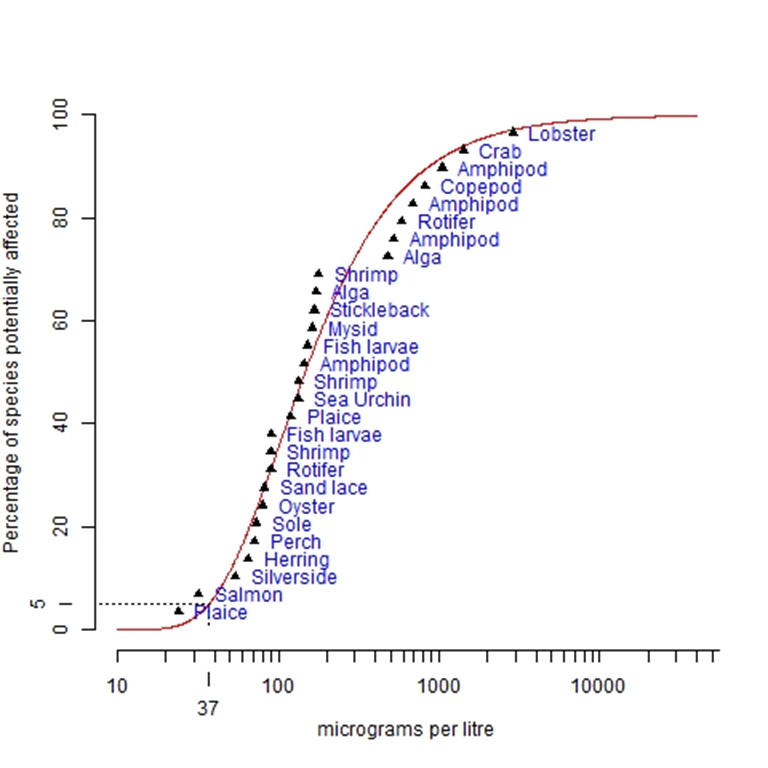
Figure 5. Species Sensitivity Distribution for Chlorine
Comparison to Marine Guideline Value for Bromine
As there is a transformation from chlorine to bromine in the discharge plume from a power station or desalination plant, it is pertinent to assess and compare the Guideline limit for bromine to the Guideline limit for chlorine.
The British Environment Agency (Lewis et al 1997) developed a similar list of the results of flow-through toxicity tests for bromine. Again, longer duration (48 or 96 hour) results of flow-through tests have been selected for analysis.
The species sensitivity distribution was plotted using Burrlioz software (see Figure 6) to determine bromine concentrations corresponding to 99%, 95% and 90% species protection. Note that the concentrations plotted are the published LC50 values from the various tests.
The most sensitive species in the bromine SSD are silverside fish and mysid shrimp, with impacts detected at the concentrations of 65 µg/L and 92 µg/L, respectively.
Applying the Burrlioz distribution of best fit to all the test points in Figure 6, the threshold bromine concentrations are:
- For 99% species protection, bromine concentration of 69 µg/L;
- For 95 % species protection, bromine concentration of 96 µg/L; and
- For 90 % species protection, bromine concentration of 118 µg/L.
Applying the same conservative factor of 0.5 to convert the LC50 concentrations used in the SSD to a No Effect or Low Effect (LC10) concentration, the resulting Guideline Values for bromine are:
- For 99% species protection, bromine concentration of 34 µg/L;
- For 95% species protection, bromine concentration of 48 µg/L; and
- For 90% species protection, bromine concentration of 59 µg/L.
Converting to a molar basis, the 99% and 95% Guideline Values for bromine become 15 µg/L and 21 µg/L, respectively, which are similar to the equivalent Guideline Values for chlorine. It is noted that the bromine data does not include test results for salmon and plaice, which were found to be sensitive to chlorine. If these tests were undertaken and included, it might close the gap between the guideline values for bromine and chlorine.
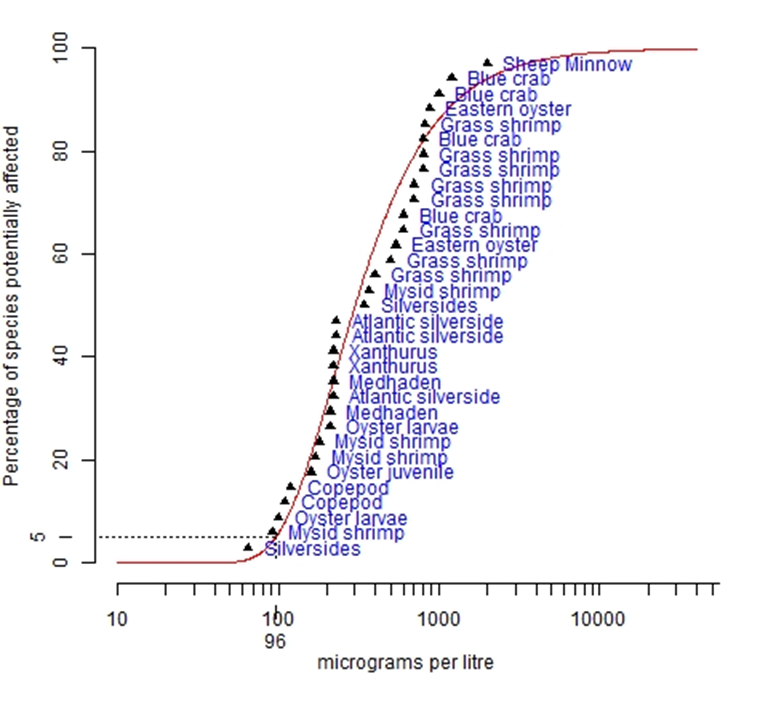 Figure 6. Species Sensitivity Distribution for Bromine
Chlorine produced byproducts
Chlorine produced byproducts (CPBs) result from the reaction of the CPOs with natural dissolved organic matter in the seawater. Hypobromous acid is the key CPO in chlorinated seawater. The bromine reacts with naturally occurring methanes, acetic acids, acetonitriles and phenols in seawater to produce the equivalent brominated hydrocarbons: bromoform or tribromomethane (TBM); dibromoacetonitriles (DBAN); di- and tri-bromoacetic acid (DBAA, TBAA) and; tribromophenol (TBP) in decreasing amounts (Allonier et al 2011, Jenner and Wither 2011). Bromamines may form if the molar ratio of ammonia to bromine exceeds 0.67 (Lewis et al 1997).
Unlike the equivalent chlorinated organocarbons, all these brominated organocarbons are produced and metabolised naturally in the marine environment by marine biota (Jenner and Wither 2011, Gribble 2015, Mata et al 2013, Whitfield 1997, 1998, 1999), which is not surprising considering the natural occurrence of all the precursors. They are not persistent in the environment. Dibromamine decomposes with a half-life of 30 minutes compared to the relative stability of chloramine formed by the reaction of chlorine with ammonia (Lewis et al 1997).
The sensitivity of sea urchin larval development to CPBs was tested using 48 hour exposure of larvae to various concentrations of three common CPBs: TBM (bromoform), TBAA and TBP (Lebaron et al 2019). The tests found that embryos of the sea urchins Parcentrotus lividus were sensitive to relatively high concentrations of each of the tested CPBs, with LOECs equivalent to: 50 μg/L of bromoform; 100 μg/L of tribromacetic acid and 1,350 μg/L of tribromophenol.
A review of the toxicity of chloroform and bromoform showed that the effects of chloroform on algae and fish are typically seen only at high concentrations, orders of magnitude above those for hypochlorite toxicity (UK Marine Special Areas of Conservation 2019). The 50 percent lethal concentration (LC50 – the concentration required to kill 50% of a test population) for larval survival of an oyster were 2,000, 1,000 and 100 µg/L, respectively, for chloroform, bromoform, and bromate. Chloroform and bromoform are both lost from solution by volatilization.
The guideline values for disinfection by-products are much higher than for chlorine. Chloroform and dichloromethane have low-reliability 99% ecosystem protection default guideline values of 370 µg/L and 3,000 µg/L respectively for marine waters (ANZECC, 2018).
Conclusions
Chlorine decays rapidly in seawater. Field experiments carried out to measure the rate of decay of chlorine found that an initial chlorine concentration of 0.5 to 0.6 mg/L reduced to less than 0.1 mg/L in an hour. A higher initial chlorine concentration of 1.41 mg/L decayed by 50% in about half an hour and by 90% in two hours. Over all four tests, the decay rate was faster than 50% per hour.
Because of this high decay rate, it is impractical to carry out single-dose toxicity tests for chlorine in seawater as the chlorine will progressively decrease over the duration of a 4 hour test, and will be negligible after a 24 hour test. Instead, flow-through toxicity tests must be used.
A Species Sensitivity Distribution based on toxicity tests on 30 species from 9 taxonomic groups was used to establish Guideline Values for chlorine. The results of a recent sea urchin fertilization test in Sydney were included (EC50 of 133 µg/L). The sea urchin tests by Dinnel et al (1981) were excluded, as there are doubts about the experimental protocol, including whether the high rate of decay of chlorine was accounted for.
Using an application factor of 2, the resulting new Guideline Values for chlorine are:
- For 99 % species protection, CPO of 12 µg/L; and
- For 95 % species protection, CPO of 18 µg/L.
The Guideline Values for chlorine are consistent with field observations of substantial numbers of sea urchins thriving in Corio Bay in a habitat exposed to consistent CPO concentrations of 5 to 10 µg/L, which were previously thought to be sensitive to chlorine at 5 to 6 µg/L, although the recent Sydney tests show this is not the case.
Halogen compounds are produced naturally by marine algae (kelp and the red alga Asparagopsis are noted producers). Organobromine compounds are produced naturally by many marine species including macroalgae, phytoplankton, sponges, corals, sea slugs, tunicates, sea fans, fungi, lichen, algae and bacteria (Gribble, 2000). Marine biota are accustomed to the natural cycles of halides in the ocean, and the recommended marine water quality limit for chlorine is above the natural level of dissolved halides in bays, estuaries and coastal areas of 1 to 3 µg/L.
References
Allonier, AS, Khalanski M, Camel V and Bermond A, 1999, Characterisation of chlorination byproducts in cooling effluents of coastal nuclear power stations, Marine Pollution Bull, Vol 38, 1232-1241.
Australian and New Zealand Governments. 2018. Australian and New Zealand guidelines for fresh and marine water quality. Canberra ACT, Australia. [www.waterquality.gov.au/anzguidelines.
Abdel-Wahad A, Khodary A, Bensalah N, 2010. Formation of Trihalomethanes during seawater chlorination. Journal of Environmental Protection, Vol 1, 456-465.
Boudjellaba D, Dron J, Revenko G, Demelas C, Boudenne JL, 2016. Chlorination by-product concentration levels in seawater and fish of an industrialised bay (Gulf of Fos, France) exposed to multiple chlorinated effluents, Science of the Total Environment. Vol. 541, 391-399
Batley S, Simpson S, 2020, Short‐Term Guideline Values for Chlorine in Marine Waters, Environmental Toxicology and Chemistry—Volume 39, Number 4—pp. 754–764.
Batley GE, van Dam RA, Warne MStJ, Chapman JC, Fox DR, Hickey CW, Stauber JL. 2018. Technical rationale for changes to the method for deriving Australian and New Zealand water quality guideline values for toxicants. Prepared for the ANZG Canberra.
BC Ministry of Environment and Climate Change Strategy, 2021. Chlorine Water Quality Guidelines Water Quality Guideline Series, WQG-10. Prov. B.C., Victoria B.C.
Canadian Council of Ministers of the Environment. 1999. Canadian water quality guidelines for the protection of aquatic life: Reactive chlorine. In Canadian Environmental Quality Guidelines. Winnipeg, MN, Canada.
Canada Ministry for Environment, 2019. Derivation of Water Quality Guidelines for the Protection of Aquatic Life in British Columbia, Water Quality Guideline Series, WQG-06. Prov. B.C., Victoria B.C
CEE, 2018, Chlorine in Seawater Heat Exchange Process. Final Report to Jacobs International, July.
Commonwealth Scientific and Industrial Research Organisation. 2019. Burrlioz 2.0 software. Canberra, ACT, Australia. https://research.csiro.au/software/burrlioz.
DHI (2014). Wastewater dispersion modelling. Prepared for Woodside Energy by DHI Water and Environment.
Dinnel PA, Stober QJ, DiJulio DH. 1981. Sea urchin sperm bioassay for sewage and chlorinated seawater and its relation to fish bioassays. Mar Environ Res 5:29–39.
Fisher DJ, Burton DJ, Yonkos LT, Turley SD, Ziegler GP. 1999. The relative acute toxicity of continuous and intermittent exposures of chlorine and bromine to aquatic organisms in the presence and absence of ammonia. Water Res 33:760–779.
Grose, MR 2008 , 'The ocean-atmosphere cycles of methyl halide trace gases in the Southern Ocean and Tasmanian coastal waters', PhD thesis, University of Tasmania.
Jenner H and Wither A, 2011. Chlorination by-products in power station cooling water. s.l. : EDF Energy
Laboran K, Richard S, AQ, Austruy A and Boudenne J, 2019, Assessment of individual and mixed tocity of bromoform, tribromoacetic acid and 2,4,6 triborphenol on the embro-larval development of Paracentrous lividus sea urchin, Environmental Science and Pollution Research, July
Lewis, S, Mole, N, Mascarenhas, R and James, H, 1997, Proposed Environmental Quality Standards for Bromine in Fresh and Marine Waters, R&D Technical Report P74, Environment Agency, Bristol.
Liu S, Yang G, He Z, Xu XG, 2021 Oceanic emissions of methyl halides and effect of nutrients concentration on their production in the Western Pacific Ocean, Science of the Total Environment, Vol 769, May
Roberts MH, Diaz RJ, Bender ME, Huggett RJ. 1975. Acute toxicity of chlorine to selected estuarine species. J Fish Res Board Can 32: 2525–2528.
Roberts MH, Gleeson RA. 1978. Acute toxicity of bromochlorinated seawater to selected estuarine species with a comparison to chlorinated seawater toxicity. Mar Environ Res 1:19–30.
Saeed S, Prakash S, Deb N, Campbell R, Kolluru V, Febbo E and Dupont J. 2015. Development of a site‐specific kinetic model for chlorine decay and the formation of chlorination by‐products in seawater. J Mar Sci Eng 3:772–792.
Satpathy KK, Mohanty AK, Gouri Sahu, Biswas S, Prasad MVR, Slvanayagam M, 2010. Biofouling and its control in seawater cooled power plant cooling systems – a review. Environmental and Industrial Safety Section, Indira Gandhi Centre for Atomic Research.
UK Department of Environment and Rural Affairs, 2014. New and improved standards to protect the water environment, defra.gsi.gov.uk
USEPA 1996. Quality Criteria for Waters. U S Environmental Protection Agency. Office of Water Regulations and Standards. Washington DC.
USEPA 2017. Operating Procedure. Field Screening of Total Residual Chlorine. Region 4. U S Environmental Protection Agency. Science and Ecosystem Division. Athens, Georgia.
Wahab 2012: Environmental Impact Assessment of Residual Chlorine Discharge into Seawater. Presentation Chemical Engineering Program, Texas A&M University at Qatar, May 2012.
Water Technology, 2017. Hydrodynamic & Water Quality Modelling, Western Port Bay. Report to AGL Wholesale Gas Ltd.
Warne M, Batley GE, van Dam RA, Chapman JC, Fox DR, Hickey CW, Stauber JL. 2018. Revised method for deriving Australian and New Zealand water quality guideline values for toxicants. Prepared for the revision of ANZG, Canberra.
Zeng J, Jiang Z, Chen Q, Zheng P, Huang Y. 2009. The decay kinetics of residual chlorine in cooling seawater simulation experiments. Acta Oceanol Sin 28:54–59.
Nomenclature
NOEC = No effect concentration = the concentration of a laboratory preparation that showed no statistical effect compared with the control preparation
LOEC = Lowest effect concentration = the lowest concentration of a laboratory preparation that showed a statistically different result from the control preparation
LC50, EC50, IC50 = Statistically calculated concentration at which 50% of the test population were killed (LC = lethal outcome), affected (EC = effect concentration, is meant for deleterious effect), or inhibited (IC = inhibition concentration).
LC10, EC10, IC10 = Statistically calculated concentration at which 10% of the test population respond deleteriously
PNEC = Probable No Effect Concentration. Calculated in different ways over the years. Is probably equivalent to outputs of Species sensitivity distribution analyses based on EC10, IC10.
SSD = Species sensitivity distribution analyses of chronic EC10, IC10 values.
Author Biographies
Ian Wallis | Dr Ian Wallis is the Principal Engineer at Consulting Environmental Engineers, Melbourne. He initially worked as a researcher and academic but evolved into an environmental consultant. He has worked on a wide range of water quality and air quality projects over the last 30 years, and always tries to integrate the physical processes with the biological responses. He was on the Board of the NT EPA for seven years.
Scott Chidgey | Scott Chidgey is Principal Marine Scientist at CEE P/L Melbourne. Scott has formal qualification in marine zoology and marine botany. He has worked in teams with other marine scientists from a range of disciplines including ecology, chemistry, oceanography and toxicology for more than 35 years. He plays a key role in applied marine environmental management by integrating scientific information in regulatory context.
Share