


Net-Zero Strategy and Carbon Maturity: Comparing Victorian and UK-Based Water Companies

Abstract
This study compares the approach to net-zero and carbon maturity of four water companies across Victoria and the UK. This was achieved by contrasting each company’s scope and definition of net-zero, relevant decarbonisation targets and milestones, and the initiatives, complete, under-way and proposed, to achieve net-zero. It was found that the two UK based companies have both adopted a broader definition of net-zero and placed an early focus on a whole-of-supply-chain approach to emissions, which has been reported previously as having resulted in significant carbon and cost savings. The Victorian water companies adopted an initial focus on operational emissions, driving rapid emission reductions in their businesses. It was also shown that high carbon maturity was consistent with the level of ambition in decarbonisation, emphasising the importance of carbon maturity in efforts to reduce emissions.
Introduction
Momentum has been building in recent years for companies and governments to adopt strategies to achieve ‘net-zero’. There is an urgent need for ambitious emissions reductions targets to be set, as was made clear in 2021 by the United Nations (UN) Secretary General labelling the climate crisis as “a code red for humanity”, following the Intergovernmental Panel on Climate Change (IPCC) Working Group I contribution to the Sixth Assessment Report.
Water companies, as significant energy users and emitters of greenhouse gases, have a responsibility to contribute to large-scale emissions reductions – and many have already made significant decarbonisation commitments. A breakdown of a typical water company’s operational emissions footprint reveals that approximately 60-75% of emissions are attributable to electricity use, while wastewater treatment emissions – commonly referred to as process emissions – account for the majority of the remainder. Process emissions largely consist of fugitive nitrous oxide (N2O) and methane (CH4), which are significantly more potent greenhouse gases than carbon dioxide (CO2).
This study endeavours to compare the net-zero strategy and maturity of two Victorian and two UK-based water companies, namely Barwon Water, Yarra Valley Water, Anglian Water and Scottish Water, while acknowledging that the four companies vary considerably in terms of size, revenue, business type, and number of customers. The policy context of each company is also considered. Key characteristics of the four water companies are shown in Table 1.
For companies to be successful in achieving net-zero targets, internal carbon maturity must be of high standard. Therefore, this study has also assessed the carbon maturity of these same companies. This study only focuses on future decarbonisation strategies, however, acknowledges the significant efforts and achievements all water companies have achieved to date.
A lack of international standardisation regarding the definition of ‘net-zero’ (largely due to the speed at which the phrase has taken hold) has resulted in ambiguity and inconsistency in its application, giving rise to criticism as well as instances of greenwashing. It is therefore imperative to compare net-zero definitions and strategies among water companies in order to ensure the credibility of such targets.
The intended outcomes of this study are to:
- Provide a comparison of net-zero definitions and strategies among water companies to identify both exemplar models and opportunities for improvement
- Highlight opportunities for water companies to share best practice in emissions reduction
- Provide an opportunity for water companies to promote achievements in decarbonisation efforts
- Inspire discussions in the water industry regarding decarbonisation and net-zero.
Policy Context - Victoria
“Water for Victoria” is the Victorian Government policy driving emissions reduction among Victoria’s 19 water corporations, with the objective that ‘[the Victorian] water sector will be a leader in the state’s climate change mitigation and adaptation actions,’ and a commitment to ‘achieve net-zero emissions in the water sector’ before 2050. The policy is implemented through a process of water corporations preparing their individual emissions reduction plans and progress targets, with progress targets then legislated via the Statement of Obligations (Emission Reduction) (SoO-ER) issued by the Minister for Water under the Water Industry Act 1994. The current SoO-ER contains emission reduction targets to 2025, representing an overall requirement to reduce sector-wide emissions by 42% by 2025 compared to a 2011-2016 baseline. The next iteration of the SoO-ER, with targets for 2030, is currently being prepared.
The emissions reductions pledged under the SoO-ER are further contextualised by the Victorian Parliament’s commitment to net-zero emissions by 2050 under the Climate Change Act 2017. The water sector in Victoria was responsible for emitting approx. 868,800 tCO2e of GHG annually between 2011 and 2016, representing almost a quarter of the Victorian State Government emissions (3,700,000 tCO2e in 2018-19) and 0.7% of total state-wide emissions (114,000,000 tCO2e in 2016) (DELWP, 2021; DELWP, 2022).
While all Victorian water corporations are aligned in each having a 2025 emissions reduction target under the Statement of Obligations, beyond this each have set their own targets and timeframes for net-zero (detailed later), and the sector as a whole is targeting net-zero emissions no later than 2050 in line with state government targets.
Policy Context - UK
The UK government has also committed to reach net-zero by 2050, and like those in Victoria, UK water companies have similarly pledged to achieve net-zero by an earlier date. In 2019, all eleven water companies in England jointly pledged to target net-zero operational emissions by 2030 (Water UK, 2020). As a result of this ‘Public Interest Commitment’, Water UK engaged with Mott MacDonald and Ricardo to produce the Water UK Net-Zero 2030 Routemap, the first sector-wide plan of its kind. This routemap primarily focuses on the English water sector, but strategies of water companies elsewhere in the UK are largely in alignment. The Scottish Government has pledged to achieve net-zero by 2045, and some differences exist in the reporting requirements of water companies in Scotland and those in England.
Throughout the last decade, UK water companies have also been actively involved in the development of the UK’s Infrastructure Carbon Review and PAS 2080, a Publicly Available Specification for Carbon Management in Infrastructure.
Further Context and Definitions
As there is no internationally standardised definition of ‘net-zero’, each water company has defined net-zero in its own way. The scope of emissions included in each of the four water companies’ definitions of net-zero are shown in Table 2.
Emissions are typically defined by three scopes:
Scope 1 emissions are ‘direct emissions’ which originate from activities or assets that are owned or controlled by the organisation.
Scope 2 emissions are ‘indirect emissions’ which result from the purchase of electricity or energy such as district heating (excludes fuel combustion, which is scope 1).
Scope 3 emissions are ‘value-chain’ (or ‘supply-chain’) emissions which result from the purchase of goods and services, and investments.
Sequestration refers to the process of capturing carbon from the atmosphere and physically locking it up – for example in trees or soil.
The Science Based Target initiative (SBTi) in 2021 published a Corporate Net-Zero Standard that is rapidly gaining international recognition. The SBTi’s Standard requires both rapid and deep decarbonisation, ultimately accounting for a 90-95% reduction across all scopes. Further, residual emissions are to be ‘neutralised’, meaning that an equivalent volume of emissions must be removed from the atmosphere. ‘Sequestered’ emissions typically fit this requirement. Given its alignment with the Paris Agreement and consistency with limiting warming to 1.5°C, this is the definition of net-zero adopted in this paper.
Carbon Maturity is defined as an assessment of a company or organisation’s level of competency in understanding and managing emissions reduction, as determined by the questionnaire described in the methodology below.
Methodology
This study comprises (1) a comparison of decarbonisation strategies and (2) a carbon maturity assessment across Yarra Valley Water, Barwon Water, Anglian Water and Scottish Water.
Decarbonisation Strategy Comparison
A desktop study was completed to assess and compare the decarbonisation strategies of each of the four water companies. This comparison included three focuses, two of which reflect the
‘rapid’ and ‘deep’ decarbonisation requirements of the SBTi’s Net-Zero Standard:
- Comparison of the scope and definition of ‘net-zero’ used by each company (the depth of decarbonisation)
- Comparison of the targets and milestones of each company (the rate of decarbonisation)
- Comparison of the strategy initiatives each company has proposed to achieve net-zero.
Carbon Maturity Assessment
The carbon maturity assessment was completed in two stages, as follows.
Stage 1
A questionnaire of 24 questions was developed with questions grouped into five categories, namely:
- Leadership,
- Governance and Reporting,
- Carbon management process,
- Quantification of GHG Emissions, and
- Target setting, Baselines & Monitoring.
These categories and the questions drafted were derived from PAS 2080. The questionnaires were completed by a representative of Barwon Water and a representative from Yarra Valley Water. These representatives are heavily involved in each company’s net-zero and emissions reduction efforts, and for the purposes of this study will be referred to as sustainability team members. For Anglian Water and Scottish Water, the questionnaires were completed by Mott MacDonald staff (with experience working for each respective company) using a mix of existing knowledge and publicly available information. These were then reviewed by a representative (in a similar ‘sustainability’ role to those representing the Victorian companies) from Anglian Water and Scottish Water.
For each question, respondents were asked to select one of six possible answers on a sliding scale which included “strongly agree”, “agree”, “neutral”, “disagree”, “strongly disagree”, and “unsure”. A written response was required to the final question.
Responses were then assigned points on a sliding scale ranging from 1 point for “strongly disagree” responses to 5 points for “strongly agree” responses. Points were averaged across each category to produce a score, which was used as a proxy for carbon maturity.
Stage 2
For the two participating Victorian water companies, the same questionnaire was completed by an additional four team members across the broader business. The purpose was to ascertain the level of understanding of carbon management within the broader business. The additional respondents included one member from each of the operations, delivery, finance, and management teams.
These responses were compared to assess the level of understanding across each organisation. The extent to which their answers differed from the sustainability team member was taken to suggest a lesser understanding of their company’s carbon maturity and a need to better embed the strategy within the organisation.
Results
Decarbonisation Strategy Comparison
Scope and Definition of Net-Zero (Depth of Decarbonisation)
The scope and definition of net-zero as described in each of the four water companies’ net-zero strategies are shown in Table 2.
| Water Company | Scope of Net-Zero Definition |
| Barwon Water | Zero scope 2 emissions (by using 100% renewable electricity) and net-zero scope 1 emissions (residual scope 1 emissions are sequestered or offset using Climate Active-compliant offsets, e.g. ACCUs). |
| Yarra Valley Water | Zero scope 2 emissions (by using 100% renewable electricity) and net-zero scope 1 emissions (residual scope 1 emissions are sequestered or offset using Climate Active-compliant offsets, e.g. ACCUs). |
| Anglian Water | Net-zero operational scope 1 and 2 emissions (plus some scope 3 for outsourced activities) (residual emissions sequestered or offset). |
| Scottish Water | Net-zero scope 1, 2 and 3 operational emissions and net-zero capital investment (embodied) scope 3 emissions (residual emissions sequestered or offset). |
Targets and Milestones (Rate of Decarbonisation)
The decarbonisation targets as described in each of the four water companies’ net-zero strategies are shown in Table 3.
| Water Company | Decarbonisation Targets |
| Barwon Water | 100% renewable electricity by 2025. Zero net emissions by 2030. |
| Yarra Valley Water | 100% renewable electricity and carbon zero by 2025, then ‘beyond zero carbon by 2030’ |
| Anglian Water | Net-zero operational emissions by 2030. 70% capital carbon (scope 3) reduction by 2030 from a 2010 baseline. Interim target to reduce operational carbon emissions by 30% by 2025 against a 2018/19 baseline. |
| Scottish Water | Reduce operational emissions by 60% by 2025 (from the 2007 baseline). Reduce operational emissions by 75% by 2030 (from the 2007 baseline).* Achieve net-zero emissions (scope 1, 2 and 3 including capital investment activities) by 2040. |
*Recently updated – Scottish Water is now targeting net-zero operational emissions by 2030.
Strategy Initiatives
A comparison of each of the four water companies’ existing and proposed strategies to achieve net-zero is shown in Table 4. A common approach to emissions reduction is the concept of an ‘emissions reduction hierarchy’. A typical hierarchy involves the prioritisation of ‘avoiding’ emissions (such as through energy efficiency upgrades). This is followed by ‘reduce’, ‘switch’, and finally ‘offset’ for emissions that cannot be otherwise avoided.
Carbon Maturity Assessment
Stage 1
A radar chart showing carbon maturity scores of each water company (averaged across each category) is shown in Figure 1.
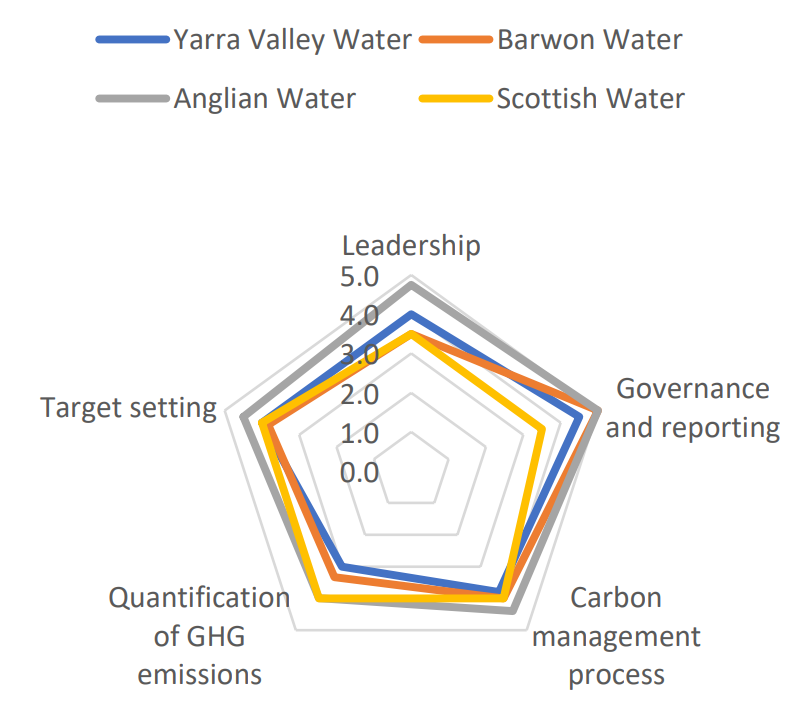
Figure 1: Carbon maturity results
Taking the average scores as a proxy for carbon maturity, the following observations were made:
- The UK water companies scored higher in the overall maturity scores compared to the Victorian companies, however there is minimal variance between all companies.
- Anglian Water demonstrates strong maturity in Leadership and Carbon Management Process.
- Anglian Water and Barwon Water lead in Reporting, with Yarra Valley Water only marginally behind.
- Scottish Water and Anglian Water lead in Quantification of GHG emissions.
Stage 2
For the Victorian water companies, one member from the operations, delivery, finance, and management teams completed the questionnaire. The responses were compared to the responses of the sustainability team leaders (Figure 2)
The following observations were made:
- There were only limited inconsistencies between the responses given by the sustainability team leaders and the wider teams at Yarra Valley Water and Barwon Water.
- The Yarra Valley Water delivery representative under reported their companies’ carbon strategy while the management representative had confidence in their company’s carbon strategy.
- The Barwon Water finance representative also had less knowledge of the carbon strategy in their company.
Discussion
Decarbonisation Strategy Comparison
Scope and Definition of Net-Zero (Depth of Decarbonisation)
It is observed that there is variance among the four water companies regarding the definition and scope of net-zero (Table 2). Barwon Water and Yarra Valley Water share the same definition, which includes scopes 1 and 2, and involves sequestering or offsetting residual scope 1 emissions using Climate Active-compliant offsets, such as Australian Carbon Credit Units (ACCUs) from projects located in Victoria where the water company is directly involved. Similarly, Anglian Water and Scottish Water prioritise the offset of residual emissions by capturing an equivalent volume of emissions and removing these from the atmosphere. This approach is consistent with the concept of an emissions reduction hierarchy. It is noted that only sequestration (‘neutralisation’) is considered an acceptable form of offsetting residual emissions under the SBTi Net-Zero Standard.
Victorian companies have largely focused on scope 1 and scope 2 emissions in their footprint, however as progress continues with these emissions, they are now considering scope 3 (supply-chain) emissions as well. Yarra Valley Water is currently developing scope 3 targets for submission to the SBTi in mid-2022. While the Victorian companies are at an earlier stage of their journey to reduce scope 3 emissions, the two UK based companies, Anglian Water in particular, have made significant progress in this (Anglian Water has reported having cut capital carbon 61% between 2010 and 2020). A possible explanation for this is that involvement in the publication of the UK Infrastructure Carbon Review (ICR) and PAS 2080 have driven early efforts in the UK to reduce ‘capital carbon’, defined in the ICR as “emissions associated with the creation of an asset”, which generally falls under the definition of scope 3 emissions due to the outsourcing of asset construction. These drivers may have influenced a whole-of-supply-chain approach to emissions reduction.
The inclusion of scope 3 emissions is a complex task for water companies, particularly given the need to develop clear and consistent guidelines for inventory boundaries and methods to accurately account for supply-chain emissions. However, the potentially significant cost savings associated with supply-chain decarbonisation, as described in the Infrastructure Carbon Review, are a key driver for tackling this issue. Anglian Water has cited in its Five Point Plan for a Green Recovery that reducing carbon “has delivered financial savings averaging 20 per cent versus traditional solutions” (Anglian Water, 2020).
Also of note, is the common challenge of nitrous oxide emissions from wastewater treatment, which accounts for a significant component of a typical water company’s scope 1 emissions, and requires further scientific work and international agreement to accurately measure and optimise (De Haas L. 2021).
Targets and Milestones (Rate of Decarbonisation)
The Victorian companies have set earlier dates for their decarbonisation targets compared to the UK companies, representing their initial focus on rapidly reducing scope 1 and 2 emissions. Scope 3 emissions are likely to become a focus for the Victorian companies in this decade.
While the Victorian water companies have both committed to achieve net-zero scope 1 and 2 emissions before the UK water companies, the differing definitions of ‘net-zero’ make it difficult to compare target dates without further research. A methodology more directly comparing the respective ‘rates’ of decarbonisation for each company and for each scope of emissions may produce a more meaningful comparison.
Strategy Initiatives
It is evident from Table 4 that Anglian Water and Scottish Water are closely aligned regarding initiatives being pursued to decarbonise their companies. The production of a robust, national net-zero routemap for the water industry may be a contributing factor towards this, noting that the routemap is primarily followed by English water companies and specific requirements differ in Scotland. Likewise, Barwon Water and Yarra Valley Water are closely aligned in their strategy initiatives, reflecting the Victorian policy context and close collaboration between Victorian water corporations. Whilst this study has not directly compared Yarra Valley Water and Barwon Water against other Victorian or Australia water corporations, they have both established a strong reputation as leaders in emissions reduction efforts in Australia, supported by their significant initiatives and progress to-date. Looking beyond Victoria and to the other states and territories of Australia, there is significant inconsistency in the emissions reduction targets/commitment, and therefore progress toward net-zero, of the various Australian water corporations. A key factor contributing to this variation is differing state/territory policies for their respective water corporations. However, Australian water corporations continue to collaborate on the challenge, via key industry bodies such as the Water Services Association of Australia (WSAA) who have published a water industry climate change position (WSAA, 2021b) and a recent paper Towards resilience: Climate change and the urban water industry in Australia and New Zealand (WSAA, 2021a).
Anglian Water have reported that where they ‘reduce carbon, [they] reduce cost’ and that this approach has delivered significant financial savings (Anglian Water, 2020). Similarly, other UK water companies have achieved significant financial savings when cutting carbon is prioritised. Mott MacDonald has worked with other water companies, such as Severn Trent Water and Welsh Water to develop standard products that can be used on a range of projects. Some of these products, such as packaged chemical dosing systems have significantly cut costs and reduced embodied carbon by 50%. Low carbon products such as Reinforced nylon air valves can reduce capital carbon by up to 36% and embodied carbon up to 93%, over traditional ductile iron valves.
Carbon Maturity Assessment
Stage 1
The range of overall average carbon maturity scores is small, between 3.7 and 4.5, indicating good and comparable levels of carbon maturity between all water companies.
While Yarra Valley Water and Barwon Water have set earlier emission reduction targets than Anglian Water and Scottish Water, it was found that the UK based water companies scored slightly higher (3.9, 4.5) overall maturity scores compared to the Victorian companies (3.7, 3.8). It is probable that Anglian Water’s higher carbon maturity score (4.5) is correlated with the depth of its decarbonisation efforts, which extend to capital carbon. The comparative size of each organisation (Anglian Water and Scottish Water are significantly larger organisations than Yarra Valley Water and Barwon Water) should also be taken into consideration. It is also noted that the carbon maturity scores are not static and may easily change with slightly different questions or different respondents, and over time.
Noting that scoring is subjective, while some companies scored lower on some questions, there was no single question on which all four companies scored poorly, suggesting knowledge-sharing into the future would be beneficial as where one company may be lacking, another will be excelling.
Stage 2
Within the two Victorian water companies, there were only limited inconsistencies between responses given by sustainability team members and others (Figure 2). Only 20-23% of the broader responses deviated from the sustainability team member by more than one point, indicating good communication and a consistent understanding of decarbonisation efforts and carbon management systems across each business, further suggesting strong carbon maturity across both water companies. However, some team members exhibited lesser understanding of the decarbonisation efforts (both under- and over- reporting), suggesting potential areas for improvement in awareness and understanding.
Conclusion
Five key conclusions have been drawn from this comparison of net-zero strategies and carbon maturity assessment of four water companies across Victoria and the UK:
- In addition to their operational net-zero targets, the UK based water companies have set targets to reduce capital carbon, resulting in a greater depth of decarbonisation. All four companies prioritise the elimination/reduction of emissions, consistent with a typical emissions reduction hierarchy. They also prioritise the sequestration of residual emissions (emissions that cannot easily be reduced/eliminated).
- Examples of leadership in the industry, such as being involved in the publication of the UK’s Infrastructure Carbon Review and PAS2080, have driven the UK based companies to adopt a whole-of-supply-chain approach to emissions, particularly to reduce capital carbon. This is reported by Anglian Water to have resulted in significant carbon and cost savings (20%compared to traditional solutions).
- The Victorian companies have set earlier dates for their decarbonisation targets compared to the UK companies, representing their initial focus on rapidly reducing scope 1 and 2 emissions. Scope 3 emissions are likely to become a focus for the Victorian companies in this decade.
- While the UK has a national net-zero routemap for the water industry (noting this is primarily followed by water companies in England), Australia does not. Nevertheless, it is apparent that Yarra Valley Water and Barwon Water are leading in emissions reduction efforts in an Australian water context. Despite active collaboration between Australian water corporations (e.g., via WSAA), there is an opportunity for state, territory, and federal government policies to play a greater role in achieving nation-wide consistency and best practice in target setting and reduction initiatives in the Australian water industry.
- The carbon maturity assessment results are largely consistent with the level of ambition in the companies’ decarbonisation strategies and their implementation, emphasising the importance of high carbon maturity in reducing whole-of-life emissions as much as possible before offsetting.
Importantly, the context driving net-zero strategies and discourse regarding the consistency of net-zero definitions is climate change. Increasingly ambitious targets are essential if we are to keep atmospheric warming below 1.5°C.
Acknowledgement
The authors would like to acknowledge the Traditional Owners of the land on which research has been undertaken for this paper. We pay our respect to Elders past and present, and respect those who have cared for Country and water for tens of thousands of years before us.
References
Anglian Water, 2020. Anglian Water’s five-point plan for a green recovery. <https://www.anglianwater.co.uk/siteassets/hou sehold/about-us/green-recovery-five-point-plan.pdf>
De Haas L. 2021. The case for revised reporting protocols using variable emissions factors based on nitrogen removal, Water eJournal (Online journal of the Australian Water Association), vol. 6, no. 2, 2021. <https://www.awa.asn.au/water-e-journal/water-e-journal-better-understanding-wastewater-treatments-nitrous-oxide-emissions>
The State of Victoria Department of Environment, Land, Water and Planning (DELWP) 2021. Whole of Victorian Government emissions reduction pledge (web page). Accessed 11 Jan 2022. <https://www.climatechange.vic.gov.au/victoria n-government-action-on-climate-change/Whole-of-Victorian-Government-sector-pledge-accessible.pdf>
The State of Victoria Department of Environment, Land, Water and Planning (DELWP) 2022. The water sector’s greenhouse gas emissions (web page). Accessed 11 Jan 2022. <https://www.water.vic.gov.au/climate-change/reduced-emissions-in-the-water-sector/the-water-sectors-greenhouse-gas-emissions>
Water Services Association of Australia (WSAA) 2021a. Towards Resilience: Climate Change and the Urban Water Industry in Australia and New Zealand. <https://www.wsaa.asn.au/sites/default/files/publication/download/Towards%20Resilience%20 WSAA%20Nov%202021.pdf>
Water Services Association of Australia (WSAA) 2021b. Urban Water Industry Climate Change Position. <https://www.wsaa.asn.au/sites/default/files/pu blication/download/Climate%20Change%20pos ition%20%2811%29.pdf>
Water UK 2020. Water UK Net Zero 2030 Routemap Summary for Policymakers.
| Water Company | Customers | Revenue | Other Characteristics |
| Barwon Water | Service 340,000 permanent residents (575,000 during peak holiday season) across 8,000km2 | $252M (2020-21) | Victoria’s largest regional water corporation Publicly owned |
| Yarra Valley Water | Service 2 million residents across 4,000km2 | $1.13B (2020) | One of Australia’s largest water corporations, serving more than 30% of Victoria Publicly owned |
| Anglian Water | Service 7 million residents across 27,476km2 | $2.51B (2020) | Operate 143 water treatment plants, supplying over 1 billion litres of water every day to 2.5 million households Employ approximately 8,500 people Privately owned |
| Scottish Water | Service 4.3 million residents Across 78,000km2 | $2.40B (2020-21) | Publicly owned |
| Water Company | Net-Zero Strategy | Examples of how they will be achieved |
| Barwon Water |
Emissions hierarchy (highest to lowest preference):
Other:
|
|
| Yarra Valley Water |
|
|
| Anglian Water |
Maximising energy efficiency and renewable energy generation and storage
Procuring green electricity
Decarbonising vehicle fleets
Maximising value of biogas Managing process emissions
Opting for alternative fuels
Developing offset strategy |
|
| Scottish Water |
Reducing emissions across 5 areas: Electricity
Process Emissions
Gas
Transport & Travel
Investment
|
|
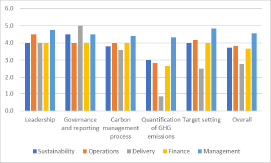
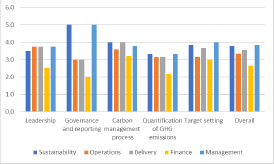
Figure 2: Wider-team carbon maturity results for Yarra Valley Water (left) and Barwon Water (right)
Share