


Nature Positive – Opportunities for Utilities (Part 2)

A water utility’s journey to understand their biodiversity performance and build a case for change

Abstract
The health of our society fundamentally depends on the health of the natural world. However, biodiversity is declining faster than at any time in human history and biodiversity loss is recognised as one of the top three global risks to society over the next ten years. Nature conservation is now a core strategic risk management issue alongside climate change.
An international agreement is now in place to identify the changes that are required, of which Australia is a signatory. Called ‘The Biodiversity Plan: For Life on Earth’, it sets clear global targets for the sustainable use, restoration, and conservation of biodiversity by 2030, including disclosure of biodiversity impacts. The term ‘Nature Positive’ is closely aligned with the goals of The Biodiversity Plan and refers to the concept of reversing the decline of nature by 2030. Biodiversity disclosure frameworks are emerging that support businesses to understand and reduce their impacts on biodiversity, often applying methods of Life Cycle Analysis. Nature Positive accounting has been proposed as a method to target net-positive biodiversity outcomes from an organisation’s operations.
Yarra Valley Water have embarked on a journey to understand their own nature-related impacts, dependencies and opportunities, and how they could respond to these. The previous paper (Part 1) focused on their landholdings. Here we report on the Life Cycle Analysis carried out across their operations and supply chains to assess their biodiversity footprint and identify further opportunities to meet local and global biodiversity restoration needs in addition to operational requirements. A key finding was that equivalent environmental impacts from biodiversity loss are significantly larger than environmental impacts from greenhouse gas emissions. The methodology presented is replicable for a range of industries and will also contribute to potential nature-related disclosure reporting.
Introduction
‘No species has ever had such wholesale control over everything on Earth, living or dead, as we now have. That lays upon us, whether we like it or not, an awesome responsibility.’
Sir David Attenborough
The health of our society fundamentally depends on the health of the natural world (Dasgupta, 2021). However, our natural world is facing two momentous and related challenges – climate change and biodiversity loss, which can no longer be treated as separate issues (Mrema, 2022). The biosphere is being altered to an unparalleled degree and biodiversity is declining faster than at any time in human history (IPBES, 2019). Biodiversity loss is now recognised by the World Economic Forum as one of the top three global risks to society over the next 10 years, along with critical changes to earth systems and potential ecosystem collapse (WEF, 2024). Nature conservation has transitioned from a peripheral corporate social responsibility issue to a core strategic risk management issue alongside climate change (TNFD, 2023), as has been described in more detail in the previous paper (Part 1).
In response, many organisations are rightly looking to their landholdings and how they might protect and restore biodiversity on these. However, this is only one piece of the puzzle. Often an organisation has far larger impacts on biodiversity through their operations and supply chain, and these must be understood for an organisation to truly start to address their biodiversity impacts (Bull et al., 2020).
Global policy has been established by The Biodiversity Plan: For Life on Earth (formerly the Kunming-Montreal Global Biodiversity Framework). This sets clear goals and targets for the sustainable use, restoration, and conservation of biodiversity by 2030, including new targets in relation to business monitoring and disclosure of biodiversity impacts. It was adopted by 188 countries, including Australia, in 2022 (UN COBD, 2022). The term ‘Nature Positive’ is closely aligned with the goals of The Biodiversity Plan and refers to the concept of slowing and reversing the rate of decline of nature by 2030, with a full recovery of a resilient biosphere by 2050 (Locke et al., 2020).
In parallel to these policy processes, frameworks are emerging that support businesses to understand and reduce their impacts on biodiversity, including the Taskforce for Nature-related Financial Disclosures (TNFD) and the Science-Based Targets for Nature (SBTN) among others. Life Cycle Analysis is emerging within this suite of tools as a method for understanding the impacts and dependencies of organisations on biodiversity (Damiani et al., 2023); and this is the basis for the analysis described in the remainder of this paper. This type of analysis will be a key contributor to potential nature-related disclosure reporting in future. Furthermore, Nature Positive accounting has been proposed as a method to target net-positive biodiversity outcomes from an organisation’s operations, once nature-related impacts are understood (Bull et al. 2020).
The water industry has long viewed its role as a protector of public and environmental health. We now face a new era of public and environmental health challenges to address, and finding ways to operate within our planetary and societal boundaries (Raworth, 2017) will be key to the legacy the water industry leaves to future generations.
Method
Overview
The ability of Yarra Valley Water (YVW) to assess their biodiversity performance and build a case for change was built on answering a series of fundamental questions. These included understanding their nature-related impacts, dependencies, and opportunities, initially on their own land and subsequently across their operations and supply chain. An overview of this framing is shown in Figure 1. Note that the utility’s focus on landholdings has been covered in the previous AWA Water e-Journal article Nature Positive – Opportunities for Utilities (Part 1). The focus of this paper is the utility’s subsequent integration of operational and supply chain impacts, and in particular a Life Cycle Analysis to better understand the materiality of these nature-related impacts.

Figure 1: Overview of YVW’s biodiversity assessment methodology (Source: YVW)
Biodiversity Footprint Assessment
Two separate companies were engaged to develop a Biodiversity Footprint Assessment for the utility using Life Cycle Analysis. These were GIST Impact, and RMIT University. The intent of these studies was to baseline the utility’s biodiversity impacts and consider the implications of any potential Nature Positive ambitions. As this is an emerging area, both companies were chosen to perform separate analyses to enable learning about the different methods available.
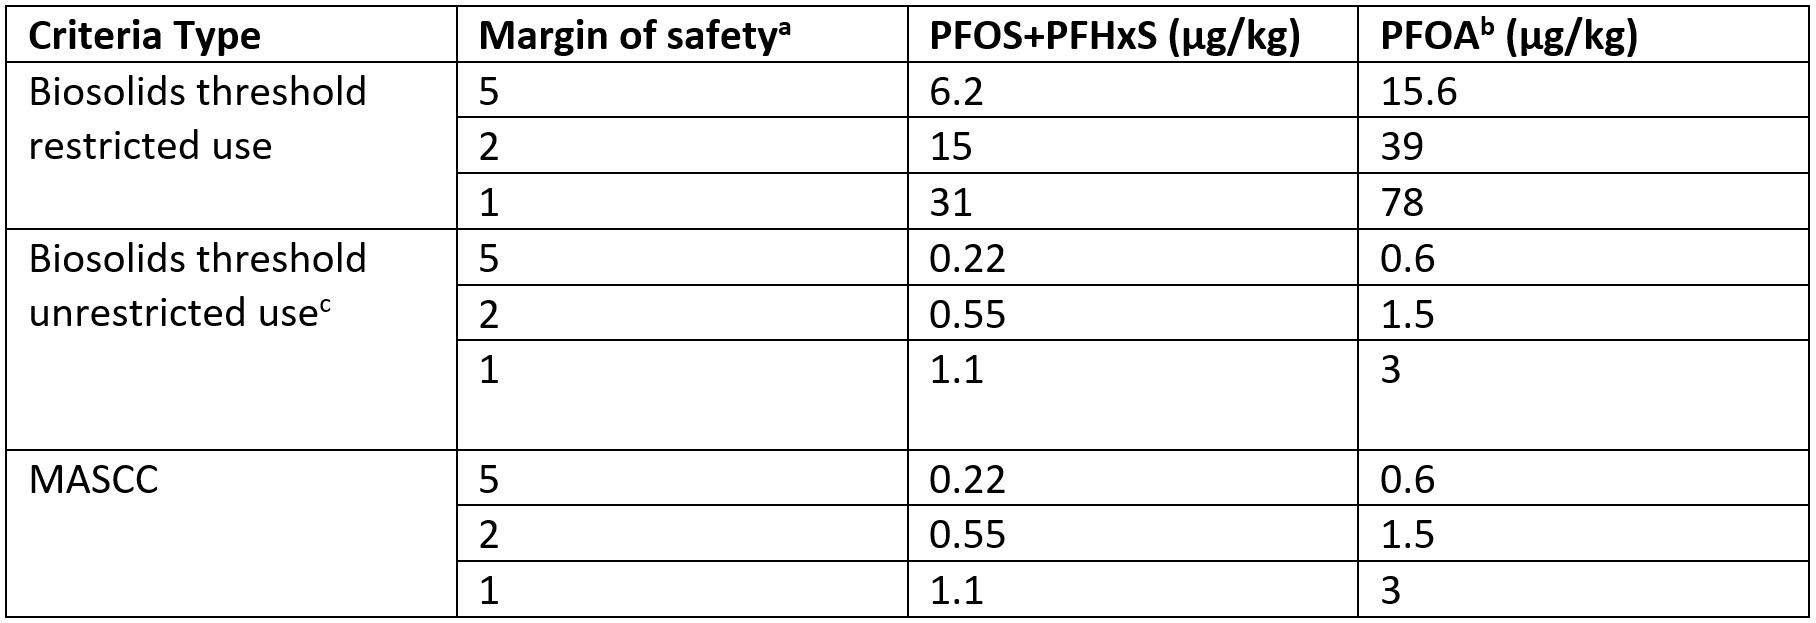
The first step was determining the utility’s impact categories, or drivers, and boundaries for each of these (Refer Table 1). Note some categories were determined to be negligible and excluded from the remainder of the assessment.
Table 1: Conceptual framework for Biodiversity Footprint Assessment,
listing key biodiversity impact categories for the utility
GIST Impact’s calculations were underpinned by the LC-Impact methodology (Verones et al., 2021). This estimates the impact of the identified drivers (such as water or air pollution) on global extinction risk, as shown in Figure 2. Note GIST Impact were unable to estimate impacts from materials used, so this driver was excluded from their assessment. The analysis used the ‘Potentially Disappeared Fraction of species’ (PDF) measurement unit to estimate biodiversity impacts. PDF measures the fraction of species richness that may be potentially lost globally due to an environmental pressure (De Schryver et al., 2010). Refer to the LC-Impact methodology paper (Verones et al., 2020) and GIST Impact website (GIST Impact, 2024) for more detailed calculations and assumptions underpinning this analysis.
 Figure 2: Key drivers underlying the impact of YVW’s operations on global extinction risk (Source: GIST Impact)
RMIT used the Bioscope (Bioscope, 2022) and LC-Impact (Verones et al., 2021) platforms to allow measurement of a broader range of biodiversity impacts, noting the outputs cannot be directly compared between the two tools (Wright et al. 2024). These tools are both freely available online, again refer to the referenced websites for detailed descriptions of the underlying calculations and methodology for each tool. RMIT also provided a spatial biodiversity assessment to support the previous phase focused on landholdings, and a high-level materiality assessment of the utility’s dependencies on biodiversity using the ENCORE platform (UNEP, 2024).
The methodologies of Bioscope and LC-Impact are different in several respects. Firstly, they have differing end metrics: LC-impact uses PDF, while Bioscope uses species/year. Species/year is an aggregated loss of local species over space and time, whereas PDF is a potentially disappeared fraction of species over time, in relation to the globally present species. In addition, LC-impact has spatially differentiated end-point factors for several categories, while Bioscope is more limited in this capacity. Taxa represented in Bioscope include vascular plants, butterflies, and fish species, whilst LC-Impact uses vascular plants together with mammals, birds, reptiles, amphibians, and butterflies. LC-impact has also added a species vulnerability factor to account for the fact that not all taxa are subject to the same risk of extinction under the same environmental pressures. (Verones et al., 2020), (Bioscope, 2022).
Consequently, the methodologies are not harmonised, and the end results cannot be combined. Furthermore, the values generated by Bioscope are not considered ideal for public communication or environmental reporting under ISO14001 or similar standards. The results provide a relative comparison for the utility to understand potential significant areas of impact and which impact categories to prioritise.
Results
GIST Impact’s calculation of the utility’s baseline biodiversity footprint is given in Figure 3 and Table 2.
Table 2: Calculation of YVW’s biodiversity impacts by category in three output units: ‘Potentially Disappeared Fraction’ of Species (PDF), Tonnes of Carbon Dioxide Equivalent (tCO2e) and Land Conversion Equivalence (LCE)
(Source: GIST Impact)

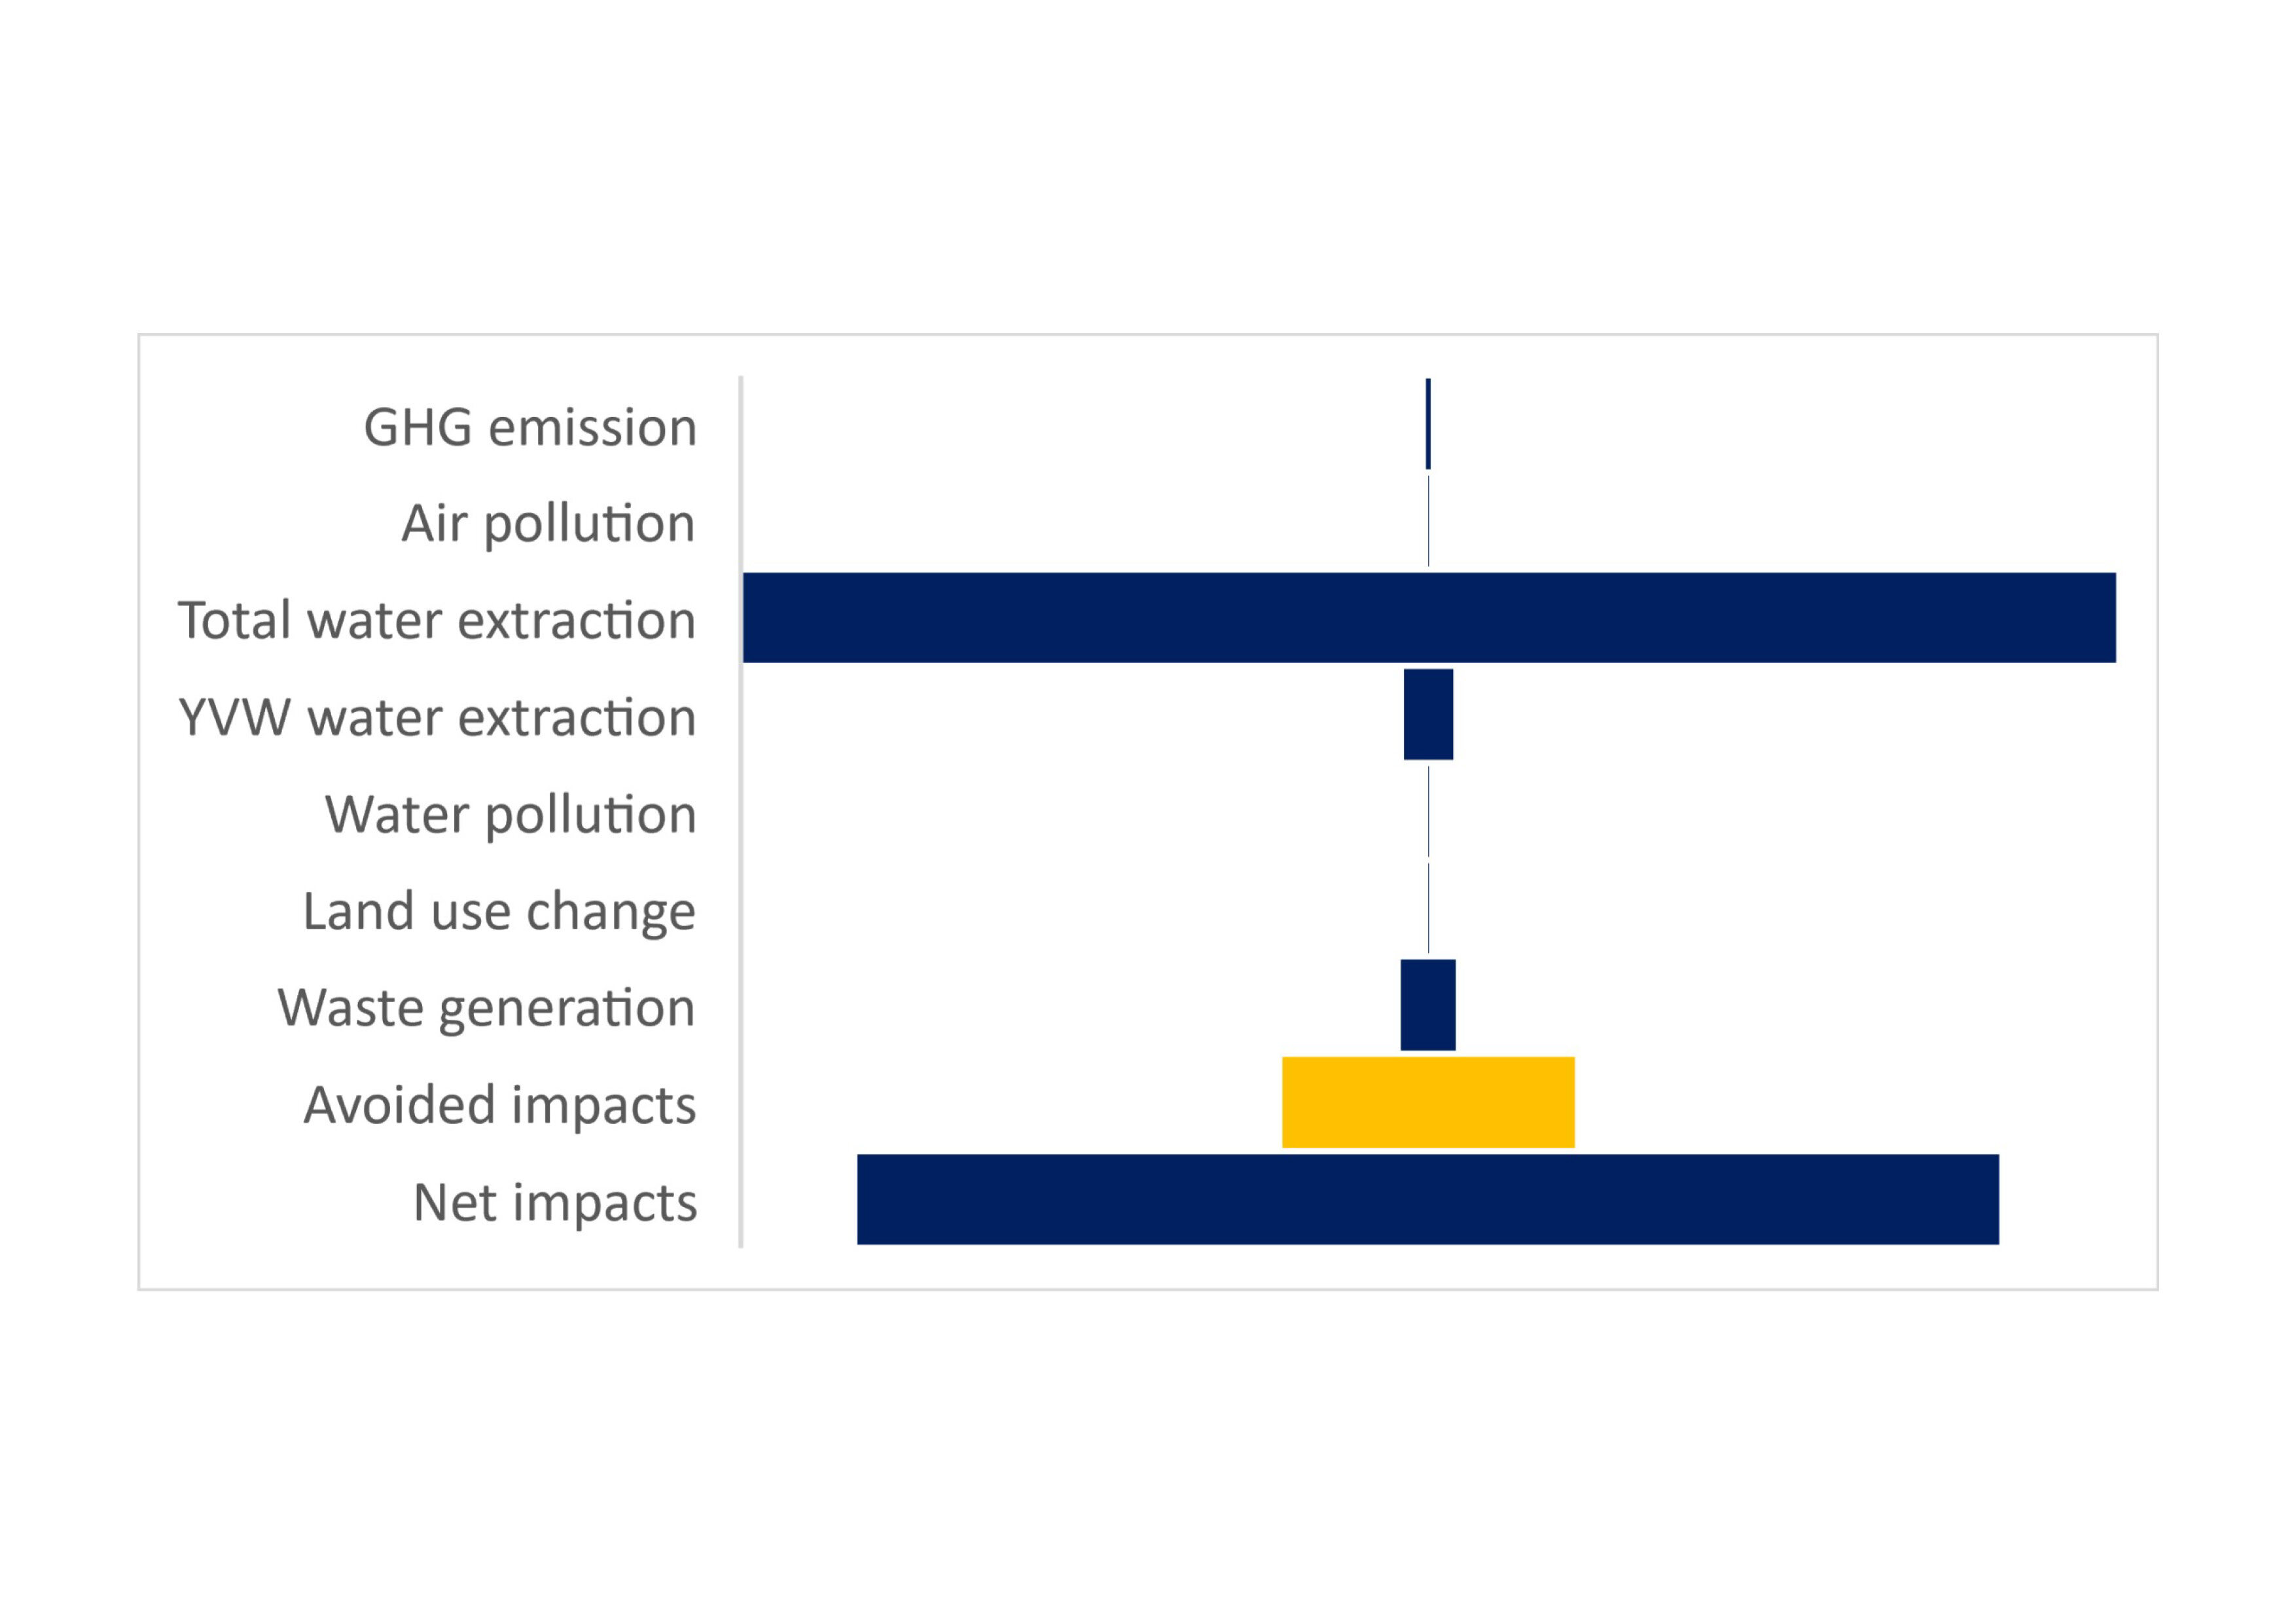
Figure 3: Calculation of YVW’s biodiversity impacts by category in the units of ‘Potentially Disappeared Fraction’ of species (PDF) (Source: GIST Impact)
In this analysis, the largest impact of the utility’s operations on biodiversity was water extraction, followed by waste generation and GHG emissions. The majority of avoided impacts were from recycled water use. Note that due to the varying methods of calculating PDF and differing underlying assumptions, these numbers should not be viewed in isolation. Rather, these outputs should be used as a relative comparison exercise to understand the materiality of the utility’s various activities and where the most effort and investment should be focused to address impacts.
The net impacts calculated for the financial year 2021-22 including total water supplied to customers were 3.10E-04 PDF. This can be understood as the impacts generated by the utility in that year will lead to the potential disappearance of 0.00031% of global species. This was calculated by GIST Impact as being equivalent to releasing 134,198,775 tonnes of CO2.
To assist with communicating a more easily relatable impact, GIST Impact also created a Land Conversion Equivalence for each of these results. This measures the equivalent environmental impact of converting land from a natural reference state to urban land. In this analysis the utility’s net impacts are equivalent to clearing approximately 1800 square kilometres of land per year.
If only considering the utility’s direct water use, the net impacts are an order of magnitude lower at 2.21E-05 PDF, equivalent to 9,586,099 tonnes of CO2 or clearing approximately 130 square kilometres per year. This is an order of magnitude higher than the utility’s scope 1 and 2 greenhouse gas emissions in that year, equivalent to 17,407 tonnes of CO2.
RMIT’s analysis of the utility’s baseline biodiversity footprint is given in Figure 4 and Table 3.
Table 3: Calculation of YVW’s relative biodiversity impacts from two separate footprinting tools:
LC-Impact in ‘Potentially Disappeared Fraction’ of Species (PDF) and Bioscope in Species per year (Wright et al. 2024)

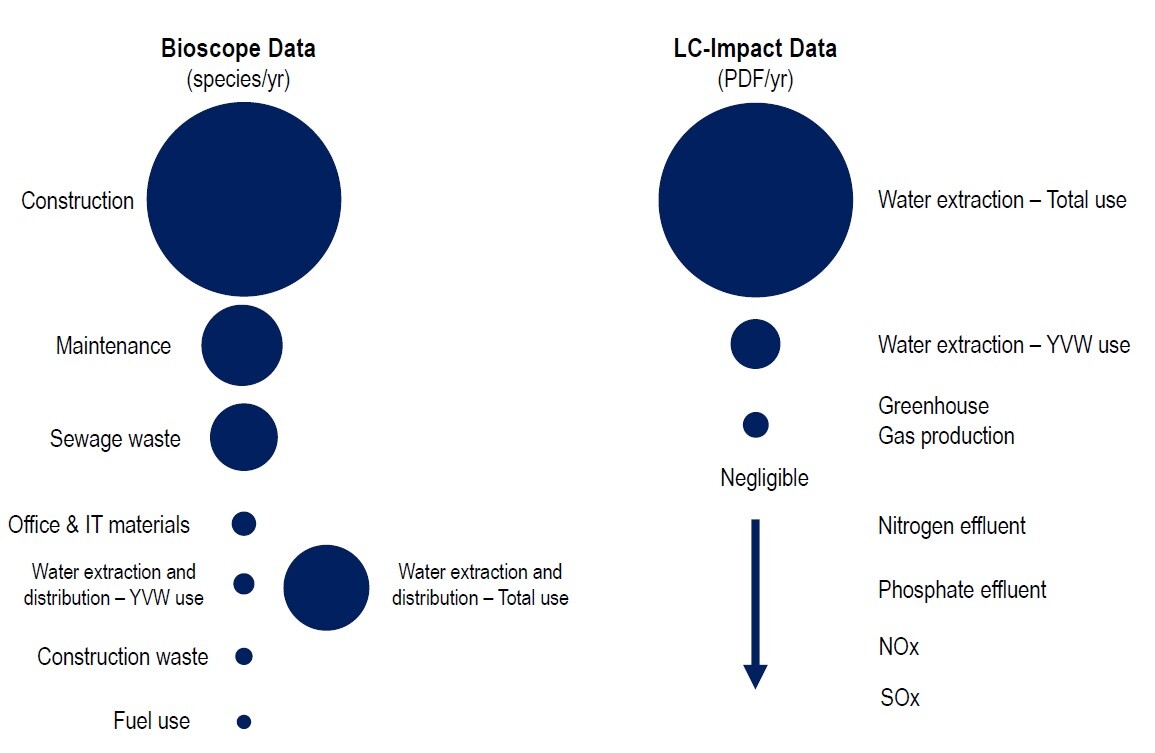 Figure 4: Calculation of YVW’s relative biodiversity impacts from two separate footprinting tools: LC-Impact in ‘Potentially Disappeared Fraction’ of Species (PDF) and Bioscope in Species per year (Wright et al. 2024)
The use of Bioscope enabled the impacts from construction and maintenance activities to be assessed. To allow a materiality assessment, freshwater extraction has been included in both tools (noting Bioscope also includes freshwater distribution). Despite having different methods and end-point metrics, taking the two sets of results together still enables the proportionality of impacts to be understood, with construction, maintenance and water extraction the utility’s largest impacts, followed by sewerage waste.
The Bioscope data represented here are the ‘end-point metric’ associated with overall biodiversity loss. These are derived by collating the impacts calculated at the ‘mid-point’ or ‘outcomes’ level (including land use, climate change, ecotoxicity, eutrophication, ozone formation and water consumption). The largest mid-point impact for construction and maintenance was land use change, suggesting that the large volumes of materials used by these activities have a significant impact on biodiversity (both in Australia and globally), as many materials may be sourced from around the globe and delivered by complex supply chains. Thus, although land use change is not represented directly, it forms a major component of the underlying drivers of biodiversity loss through these activities. In addition, impacts from direct change on the utility’s land were calculated using LC-Impact. The method calculates impact relative to ‘urban land occupation’ and using a characterisation factor at the Australian national level. The result was negligible and is therefore not shown here. We note that biodiversity elements differ across Australia and thus applying a single characterisation factor to all land use change in the country may be misleading.
Note that in both analyses avoided water use from efficiency programs was excluded to avoid double counting benefits with water extraction totals. Construction impacts from developer managed works were also excluded due to insufficient data.
Discussion
Overview
The Biodiversity Footprint Assessment provides an understanding of the utility’s biodiversity impacts, to enable a risk and opportunity evaluation and prepare for potential nature-related disclosure reporting.
The results indicate equivalent environmental impacts from biodiversity loss are significantly larger than environmental impacts from greenhouse gas emissions. In addition, the assessment opens several avenues for exploration of the utility’s response planning. Firstly, they highlight further benefits of the existing focus on reducing potable water use and increasing alternative water use. Secondly, they add another nuance to the emerging circular economy focus in the utility’s construction, maintenance and waste generation activities. These include reducing virgin material use, biosolids reuse, modified approaches such as trenchless drilling, and sourcing considerations including zero waste contracts. The impacts from IT materials were also significant enough to merit further investigation. A current key focus area is replacing virgin sand with recycled crushed glass for pipe embedment, as the utility currently uses very large volumes of embedment material, and sand is the second-most used material on the planet after water with mining causing large adverse biodiversity impacts (World Economic Forum, 2022).
This paper focuses on the supply chain impacts of the utility. Whilst land use change is included within the impact calculations using generalised characterisation factors, these do not quantify how specific, local land management actions impact biodiversity. Detailed biodiversity information is available in Victoria and much of Australia, and companies should aim to complete detailed spatial analyses of their biodiversity impacts where possible, including estimating species or habitat losses as a result of their actions or industrial footprint. It is currently difficult to quantify, with existing tools, the positive impact of restoration projects for endangered species and habitats on land, and contribute this to an overall Nature Positive assessment, so this will be the focus of future work. An additional step in this methodology could be to estimate a land use impact based on the utility’s infrastructure footprint at each site, and the biodiversity which has been lost as a direct result of their infrastructure expansion.
This assessment has highlighted the different impacts from activities that are under the utility’s direct control, such as their own water use, and activities that are indirectly controlled, such as customer water use and construction materials. Like other biodiversity footprint assessments (Bull et al., 2018), a significant proportion of the biodiversity impacts are tied to activities not under the utility’s direct control, and therefore responses will require working in collaboration with customers, design partners, contractors, research partners and other supply chain partners to reduce impacts.
 Figure 5: Biodiversity Mitigation Hierarchy for use in response planning (Source: CSBI)
Response planning
In response planning the utility is considering a biodiversity mitigation hierarchy as shown in Figure 5 (CSBI, 2015; Maron et al., 2023). This aims to avoid impacts where possible, then minimise impacts where possible, to restore habitat where practicable (considering both original Ecological Vegetation Classes and Traditional Custodian Knowledge) and potentially to offset remaining impacts as a last resort, with a view to ultimately making a Nature Positive contribution (ensuring broader social and environmental considerations are taken into account in the offset design). Additional best practice principles the utility aims to adopt in response planning include being adaptive (monitoring progress and continually improving their approach), transparent (reporting progress) and transformative (linking restoration work with regional actions and partners).
A possible response pathway for the utility may focus on two parallel approaches (Wright et al, 2024). The organisation might first seek to understand and mitigate the biodiversity impacts from their own land use. This includes undertaking biodiversity conservation and environmental restoration projects on their own landholdings. As a water utility the organisation’s key focus areas for environmental restoration could also relate to the freshwater ecosystems which they impact, and upon which they depend, as indicated in the materiality and impact analyses. The utility has approximately 26km of watercourses on their properties, which could be targeted for environmental restoration activities, including fish nursery habitat, terrestrial microhabitats for amphibians and other freshwater biodiversity, or small floating wetlands on artificial waterbodies (Wright et al., 2017). Beyond this they could implement biodiversity restoration actions in partnership with organisations such as Melbourne Water in key water catchments. By restoring these ecosystems, they can support their future business sustainability and work towards compensating for their operational and supply chain impacts.
Adjacent to this, the organisation can seek to reduce the biodiversity impacts of their operations and supply chain through innovation and technological improvements. There are opportunities to align these with other sustainability initiatives such as nature-based solutions, circular economy or climate change projects. Whilst these actions in tandem can provide positive outcomes for biodiversity and reduce negative impacts in relation to the utility’s operations, we caution against the desire to determine a Nature Positive status at this stage. Though this concept has great potential for transformative change, there are still some challenges to overcome in refining the methods and metrics used for understanding biodiversity impacts. Organisations interested in this work should instead at present focus on tangible gains for, and reducing impacts on, biodiversity wherever possible, and providing transparent biodiversity related disclosures (Milner-Gulland, 2022).
Future methodology improvements
Current questions that arise in biodiversity footprint methodology include which component of biodiversity should be measured (eg. threatened species, ecosystems, species richness) and which modelling approach should be applied when estimating supply chain biodiversity impacts (Marques et al., 2021). Whilst emerging tools provide a good starting point for organisations to understand their environmental risks, impacts and dependencies, they should be used with caution due to the assumptions underpinning modelling of characterisation factors. Due to the complexity of measuring biodiversity across genetic, species or ecosystem levels, it is difficult to reduce assessments to a single metric. Many of the existing biodiversity assessment methods underpinned by Life Cycle Analysis are unable to capture all the different dimensions of biodiversity comprehensively (Diamiani et al., 2023; Purvis, 2020).
Given these uncertainties in the biodiversity modelling we consider it premature to use offsets as part of a Nature Positive strategy at this stage. Biodiversity impact evaluation techniques will also need to be further refined to allow consideration of nuances such as different construction approaches and sourcing of materials, as they currently use broad assumptions that don’t allow for input of different approaches to track progress. Life Cycle Analysis was originally conceived to assess the environmental impacts of a product or a service throughout its life cycle, hence it is to be expected that there are teething issues in applying this method to a company rather than a product. However, these tools are developing rapidly; refer to TNFD’s Tools Catalogue (TNFD, 2024), SBTN’s Resources (SBTN, 2024), or the European Commission’s Biodiversity Measurement Navigation Wheel (European Commission, 2024) for up-to date lists of biodiversity impact assessment methods and their advantages and disadvantages.
Further considerations
It is also important to recognise that the identification, assessment and management of nature-related issues is necessarily different to climate. Climate change is a global process within one shared atmosphere. This has led to the concept of a global carbon budget and single indicator (equivalent tonnes of CO2), which is central to the global policy and business response. In contrast, biodiversity is place-based and provides differing instrumental, intrinsic and relational values to society (Pascual et al., 2017). Nature-related impacts require local, context-specific assessment and responses (TNFD, 2023). A critical component of this focus on the local context is the incorporation of Indigenous science and engagement with Traditional Custodians to inform the utility’s response strategy. Adopting a cultural water paradigm which recognises the sovereignty, self-determination and connection to place of First Nations people, is a key first step in advancing Indigenous-led water management (O’Donnell et al. 2023).
An important factor in the journey detailed here has been the strong support of the utility’s Executive team and Board. The utility has existing corporate targets for the number of hectares of land they are actively managing for biodiversity outcomes, and if they don’t meet these targets they have committed to return $1.5M to their customer base each year. There is potential to extend this metric over time to incorporate operational and supply chain impacts, which will encompass more broadly the organisation’s progress towards the desired Healthy Ecosystem outcomes. However, major changes to current practices will be required to achieve a transition to Nature Positive. Restoration of YVW land is a priority and customer expectation of the organisation. Preventative measures such as reducing potable water and virgin material use will also become increasingly important, though not sufficient on their own to achieve a Nature Positive outcome. If ultimately confirmed as an organisational goal, there will need to be additional and extensive actions to compensate for the remaining impacts on biodiversity. These will be most powerful when linked with regional actions and partners.
Conclusion
In summary, there are several significant reasons for water utilities to consider their biodiversity impacts including the urgent global context, the political and impending regulatory imperatives, growing customer expectations and the opportunity for positive co-benefits resulting from habitat restoration and partnerships with First Nations people.
We have not, in the past, had the tools to measure biodiversity impacts against global, local and organisational targets, however, these are now emerging. This study has highlighted that the water utility’s equivalent environmental impacts from biodiversity loss are significantly larger than their environmental impacts from greenhouse gas emissions, and it has listed the materiality of these impacts to strengthen future decision making. The methodology presented is replicable for a range of industries and will also contribute to potential nature-related disclosure reporting.
Utilities can play an important role in reducing negative impacts and restoring biodiversity by increasing the value they provide from land management. Utilities can also play an important role by considering their biodiversity impacts from construction practices, asset operations and supply chain management. A key success factor is the support of the Executive team and Board and evolving corporate targets that measure progress towards desired biodiversity outcomes alongside other environmental outcomes such as carbon.
However, major changes to current practices will be required to achieve a transition to Nature Positive, particularly for impacts outside the direct control of the utility. Becoming Nature Positive will require transformative change in any organisation, focused on tracing and reducing biodiversity impacts of their operations and supply chains, whilst simultaneously increasing biodiversity through environmental restoration initiatives. This transformation is critical to enable us to operate within our planetary and societal boundaries and leave a positive legacy to future generations.
Acknowledgements
The authors thank Professor Brendan Wintle for his comments on this project.
The Authors
Kathryn Naylor
Kathryn Naylor co-manages the Environment and Community Resilience team at Yarra Valley Water. Her role covers long-term strategy including climate resilience, circular economy and regenerative land use. She has 18 years’ experience in the water industry across regional master planning, urban corridor revitalisation, recycled water strategy, renewable oil production, water and sanitation and mechanical design engineering.
Dale Wright
Dale Wright is a PhD candidate and research assistant in the Interdisciplinary Conservation Science research group at RMIT University. His career in biodiversity conservation has included protected area management and expansion, threatened species conservation, policy and advocacy work. Dale’s current work focuses on sustainable agriculture and biodiversity footprint assessment.
Prof. Sarah Bekessy
Prof. Sarah Bekessy leads the Interdisciplinary Conservation Science research group at RMIT. She is interested in the intersection between science and policy in environmental management and is currently involved in a range of interdisciplinary research and consulting projects, including an ARC Future Fellowship investigating socio-ecological models for environmental decision making.
Dr. Swapna Panda
Dr. Swapna Panda is a Senior Associate in the Research and Innovation team at GIST Impact. In her role she focuses on research and the creation of methodologies, specialising in biodiversity assessment for corporate entities and investors. Her work contributes to fostering sustainable practices and informed decision-making in the business sector.
Francis Pamminger
Francis Pamminger is the Director of FUTURE by nature. He has over 40 years’ experience in the water industry. His contribution to the water industry has been recognised with two Research Excellence Awards (in 2008 and 2010) by the Sustainability Specialist Group of the International Water Association.
Katelyn Hamilton
Katelyn Hamilton is a project manager for the Environment and Community Resilience team at Yarra Valley Water, working in the areas of climate resilience, circular economy and biodiversity. With a background in ecology, Katelyn is passionate about initiatives that prioritise positive outcomes for nature and bolster resilience in the face of a changing climate.
Ava Cole
Ava Cole works in the Aboriginal Partnerships team at Yarra Valley Water, with a background in Zoology. Her role involves partnering with Traditional Owners to advance their Nation Statement regarding access to water and Country on YVW land.
Matthew Selinske
Matthew Selinske is a Senior Social Scientist at Mosaic Insights, a natural resources consulting group. Matthew uses qualitative and quantitative social science methods to better understand and respond to environmental challenges across multiple contexts. He is also an Adjunct Research Fellow with the ICON Science Group at RMIT and a Board Member of the Society for Conservation Biology.
References
BioScope. (2022). Biodiversity Input-Output for Supply Chain & Operations Evaluation. Available at: https://bioscope.info/
Bull, J. W., Taylor, I., Biggs, E., Grub, H. M. J., Yearley, T., & Waters, H. (2018). Analysis: the biodiversity footprint of the University of Oxford. Nature (604): 420-424.
Bull, J. W., Milner-Gulland, E. J., Addison, P. F., Arlidge, W. N., Baker, J., Brooks, T. M., ... & Watson, J. E. (2020). Net positive outcomes for nature. Nature ecology & evolution, 4(1), 4-7.
CSBI. (2015). A cross-sector guide for implementing the mitigation hierarchy. Prepared by the Biodiversity Consultancy on behalf of IPIECA, ICMM and the Equator Principles Association: Cambridge UK.
Damiani, M., Sinkko, T., Caldeira, C., Tosches, D., Robuchon, M., & Sala, S. (2023). Critical review of methods and models for biodiversity impact assessment and their applicability in the LCA context. Environmental Impact Assessment Review, 101, 107134.
Dasgupta, P. (2021) The economics of biodiversity: The Dasgupta Review.
De Schryver et al. (2010). Uncertainties in the application of the species area relationship for characterisation factors of land occupation in life cycle assessment. Int J Life Cycle Assess 15, 682–691.
European Commission. (2024). Biodiversity Measurement Navigation Wheel. Available at: https://ec.europa.eu/newsroom/env/items/704153/.
GIST Impact. (2024.) GIST Impact Nature and Biodiversity Suite. Available at: https://gistimpact.com/biodiversity-solutions/.
Henry, K. (2023) Independent Review of the biodiversity conservation act 2016.
Intergovernmental Science-Policy Platform on Biodiversity and Ecosystem Services (2019). Summary for policymakers of the IPBES global assessment report on biodiversity and ecosystem services.
Locke, H., Rockström, J., Bakker, P., Bapna, M., Gough, M., Hilty, J., ... & Zurita, P. (2021). A nature-positive world: The global goal for nature.
Maron, M., Quétier, F., Sarmiento, M., ten Kate, K., Evans, M. C., Bull, J. W., Jones, J. P. G., zu Ermgassen, S. O. S. E., Milner-Gulland, E. J., Brownlie, S., Treweek, J., & von Hase, A. (2023). ‘Nature positive’ must incorporate, not undermine, the mitigation hierarchy. Nature Ecology & Evolution 2023 8:1, 8(1), 14–17. https://doi.org/10.1038/s41559-023-02199-2
Milner-Gulland, E.J. (2022). Don’t dilute the term Nature Positive. Nat Ecol Evol 6, 1243–1244 https://doi.org/10.1038/s41559-022-01845-5.
Mrema, E. (2022) COP27: Protecting biodiversity is protecting the Paris Agreement | UN news, United Nations.
O’Donnell et al. (2023). Cultural water and Indigenous water science. Science 381: 619-62.
DOI: 10.1126/science.adi0658
Pascual, U., Balvanera, P., Díaz, S., Pataki, G., Roth, E., Stenseke, M., Watson, R. T., Başak Dessane, E., Islar, M., Kelemen, E., Maris, V., Quaas, M., Subramanian, S. M., Wittmer, H., Adlan, A., Ahn, S. E., Al-Hafedh, Y. S., Amankwah, E., Asah, S. T., … Yagi, N. (2017). Valuing nature’s contributions to people: the IPBES approach. Current Opinion in Environmental Sustainability, 26–27, 7–16. https://doi.org/10.1016/J.COSUST.2016.12.006
Raworth, K. (2017). Doughnut economics: seven ways to think like a 21st century economist. Random House, London.
SBTN. (2024). Resources. Available at: https://sciencebasedtargetsnetwork.org/resources/
TNFD. (2023). Recommendations of the Taskforce on Nature-related Financial Disclosures.
TNFD. (2024). Tools Catalogue. Available at: https://tnfd.global/guidance/tools-catalogue/
UN Convention on Biological Diversity. (2022). Kunming-Montreal Global Biodiversity Framework, UNEP.
UN Environment Programme. (2024.) Encore Nature Platform. Available at: https://www.encorenature.org/en.
Verones et al. (2021) Life cycle impact assessment methodology. Available at: https://lc-impact.eu/
Verones, F., Huijbregts, M. A., Azevedo, L. B., Chaudhary, A., Cosme, N., Baan, L., Fantke, P., Hauschild, M., Henderson, A. D., Jolliet, O., Mutel, C. L., Owsianiak, M., Pfister, S., Preiss, P., Roy, P.-O., Scherer, L., Steinmann, Z., Van Zelm, R., Van Dingenen, R., … Hellweg, S. (2020). LC-IMPACT Version 1.0 - A spatially differentiated life cycle impact assessment approach. https://lc-impact.eu/doc/LC-IMPACT_Overall_report_20201113.pdf
World Economic Forum (2022) Sand: The environmental catastrophe you’ve probably never heard of.
World Economic Forum. (2020). The Future Of Nature And Business.
World Economic Forum. (2024). The global risks report 2024. Geneva, Switzerland.
Wright D.R, Purnell A.J, Altern S, Frenzel P. 2017. Floating wetlands – increasing biodiversity and cleaning water in farm dams. Table Mountain Fund. Cape Town, South Africa.
Wright, D.R., Selinske M. & Bekessy, S.B. 2024. Striving for Nature Positive: A biodiversity footprint analysis for Yarra Valley Water. ICON Science Research Group, RMIT University.
Share