


Monitoring and Analysing Water Demand in Australian Multi-Level Residential Buildings

Executive Summary
This paper reports a systematic study on the actual water demand in Australian multi-level residential buildings (apartments). Water usages of four apartment buildings have been monitored continuously at the cold-water inlet. The water usage patterns have been analysed and compared with findings from single or detached residential buildings. The recorded peak flow rates have been compared against the ‘designed peak flow’ using current Australian standard (AS/NZS 3500.1) and comparable international plumbing codes. The results have revealed a drastic gap between the ‘designed’ and the actual demands. The better understanding of customer water usage will enable improved water resource and infrastructure management.
Introduction
Several Australian studies using smart water meters have conducted monitoring of single or detached residential buildings to better understand water usage habits and demand for specific water usage fixtures (Arbon, Thyer, MacDonald et al., 2014; Beal & Stewart, 2011; Roberts, 2005). Key findings have identified a reduced water consumption for two key reasons. 1) A behavioural shift in water usage because of the Australian millennium drought and 2) The increased adoption of water efficient fixtures and appliances. This information has been used in the aid of establishing the performance requirements and improved water infrastructure planning (Gurung, Stewart, Beal et al., 2014).
By comparison, for Australian multi-level residential buildings, high-resolution water consumption data is scarce. However, several international studies have now confirmed the anecdotal evidence that modern day plumbing standards now significantly over-estimate peak hydraulic demand (Bleys, Van den Bossche, & Kuborn, 2012; Douglas, Buchberger, & Mayer, 2019; Tindall & Pendle, 2015). These over-estimates are again believed to be associated to the advent of water efficient appliances. To investigate if multi-level residential building display similar water usage habits to single or detached dwellings and determine if such over-estimation exists within the Australian plumbing standards. The actual water demand in four multi-level residential buildings have been monitored through the ‘Water Demand Investigation’ project (https://www.waterdemand.com.au/) in collaboration with Hydraulic Consultants Association of Australasia (HCAA). The flow data has been analysed and Australia plumbing standard AS/NZS 3500.1 has been compared with major international standards and comparable international research to identify the limitations and directions for improvement for future water infrastructure planning and water resource management.
Highlights
- Conducted water demand monitoring for four multi-level residential buildings.
- Measured peak flow rates were 24-35% of the designed values as per AS/NZS 3500.1.
- Some methods in the current Australian plumbing standard require updating.
- Hydraulic systems may operate in adverse conditions, increasing risk of failure.
Methodology/Process
Water usage of three multi-level residential buildings and one mixed-use (residential and commercial use) building, with apartment occupancy levels between 80-90%, have been measured continuously at 5-second intervals and logged at 1-minute average values. Data was evaluated to establish peak flow rates and water consumption patterns within the monitored multi-level residential buildings. This include each specific building’s diurnal pattern, comparative weekday and weekend consumption, monthly consumption and observed flow rate frequencies. The recorded peak flow rates were compared against the ‘designed peak flow’ using current Australian plumbing standard (AS/NZS 3500.1) and comparable international plumbing codes.
Results/Outcome
Water Consumption Habits
In two out of the three residential buildings, building water consumption volumes and diurnal patterns displayed similarities to multiple single or detached residential buildings. The pattern demonstrates two peak usage periods: one sharp morning peak, and a ‘flattened’ evening peak (Figure 1). The third residential buildings is largely used as student accommodation and manifested a shifted water usage pattern (Figure 2).
Peak Flow Rates
The Australian plumbing standard AS/NZS 3500.1 can overestimate peak demand up to 4 times than the actual peak (Figure 3). Buildings are rarely subjected to peak hydraulic conditions. There is potential for pipe size to reduce from DN100 (current practice as guided by AS/NZS 3500.1) to DN50 or less (Figure 4).
AS/NZS 3500.1 predicts larger peak flows than that of more recently developed methods (Figure 5). Current formula for predicting peak flow rates dates to the 1970’s, suggesting a need for update to account for changes in water usage patterns and the prevalence of water saving fixtures.
Implications
The municipal water distribution system and the premise plumbing system can interact with each other. Continuous pressure monitoring in Adelaide CBD water distribution system has shown that the transient pressure waves (waterhammer) induced by building water usages can be significant and negatively impact the water distribution pipes (Stephens, Gong, Marchi et al., 2017). The oversizing of premise plumbing systems for multi-level buildings, as demonstrated in this study, is a key reason contributing to the severe hydraulic transients and increased risk of pipe failure.
Conclusion
The findings have demonstrated that demand patterns of typical multi-residential buildings replicate those of municipal water distribution networks that include multiple single or detached residential dwellings. This will allow for a better understanding of urban water demand and peak usage patterns, enabling improved water infrastructure planning and better integration between water distribution and wastewater networks.
Current Australian plumbing standard AS/NZS 3500.1 can overestimate peak flows up to four times the actual peak. Since plumbing systems are designed based on peak demand, this promotes oversized plumbing systems that cost more to build and operate. The formula used in AS/NZS 3500.1 to estimate the peak flow is outdated. Updates are needed to account for changing water usage patterns and wide use of water-saving fixtures.
The actual flow and velocity are significantly lower than designed, suggesting that pipes, pumps, and hydraulic control devices are incorrectly sized and operate in suboptimal or even adverse conditions. This has many implications, including long water age and compromised water quality, reduced useful life, and hydraulic transients (waterhammer) that can also damage municipal water pipes.
Tables and Figures
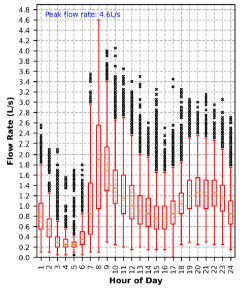
Figure 1: Mean hourly usage, Site 3: Manhattan (Canberra, ACT) 330 Apartments (monitored between 14th December 2019 to 14th March 2020)
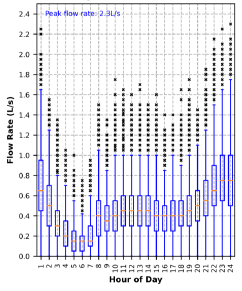
Figure 2: Mean hourly usage, Site 1: Waterloo (Sydney, NSW) 143 Apartments (monitored between 13th April 2019 to 14th March 2020)
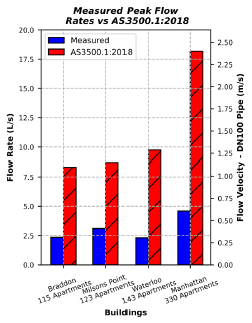
Figure 3: Measured peak flow rates compared to design peak flow rates for each specific multi-level residential apartment building.
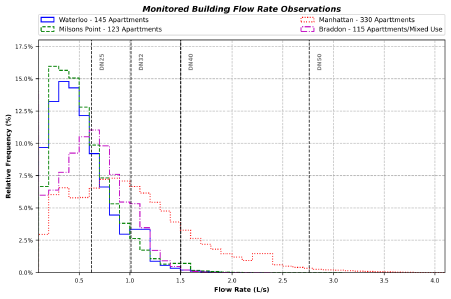
Figure 4: Relative frequency plots for observed flow rates within monitored buildings, shown against alternative pipe sizes with 1.5m/s flow velocity.
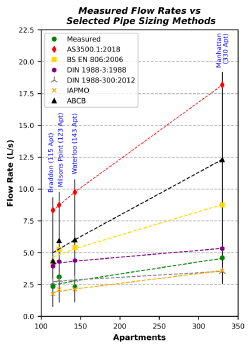
Figure 5: Measured peak flow rates (Green Line) compared to selected international plumbing codes from Australia (AS/NZS 3500.1:2018), UK (BS EN 806:2006) Germany (DIN 1988-3:1988 & DIN 1988-300:2012) and newly proposed methods by the Australian Building Code Board (ABCB) and IAPMO Water Demand Calculator.
References
Arbon, N., Thyer, M., MacDonald, D. H., et al. (2014). Understanding and Predicting Household Water Use for Adelaide: Goyder Institute for Water Research Technical Report Series No. 14/15, Adelaide, South Australia.
Beal, C., & Stewart, R. A. (2011). South East Queensland Residential End Use Study: Final Report: Urban Water Security Research Alliance Technical Report No. 47.
Bleys, B., Van den Bossche, P., & Kuborn, X. (2012). Measurements of water consumption in apartment buildings. Paper presented at the CIBW062 Symposium 2012.
Douglas, C., Buchberger, S., & Mayer, P. (2019). Systematic oversizing of service lines and water meters. AWWA Water Science, 1(6). doi: 10.1002/aws2.1165
Gurung, T. R., Stewart, R. A., Beal, C. D., et al. (2014). Smart meter enabled water end-use demand data: Platform for the enhanced infrastructure planning of contemporary urban watersupply networks. Journal of Cleaner Production, 87, 642-654. doi: 10.1016/j.jclepro.2014.09.054
Roberts, P. (2005). Yarra Valley Water 2004 Residential End Use Measurement Study.
Stephens, M. L., Gong, J., Marchi, A., et al. (2017). Transient pressure data collection and characterisation in identifying options for reducing pipe fatigue. In 13th Hydraulics in Water Engineering), Sydney, NSW.
Tindall, J., & Pendle, J. (2015). Are we systematically oversizing domestic water systems? CIBSE Technical Symposium.
Share