


Modelling Western Australia’s water demand and supplies

Estimating future demand and resource availability to 2060.
DOWNLOAD THE PAPER
Abstract
Sustained growth of Western Australia’s economy and population brought about a doubling of the state’s water use in the thirty years following 1985. Over the same period climate change intensified in the state’s south-west land division causing historically low inflows to dams and recharge to aquifers that comprised the region’s water supplies.
In response, the Western Australian Government invested in large-scale seawater desalination and wastewater recycling to augment the Perth Integrated Water Supply Scheme, which supplies drinking water to the majority of the state’s population. The situation also prompted Government and industry to initiate coordinated, long-term planning of the water resources and supplies that were needed for sustainable economic growth across Western Australia.
In carrying out long-term water supply planning the Department of Water and Environmental Regulation developed the ‘Water Supply and Demand Model’ (WSDM) to estimate the future demand and availability of the state’s groundwater and surface water resources to 2060. The WSDM uses growth rates from computable general equilibrium modelling of Western Australia’s economy and population forecasts to project the future water demand of all water usages and resources across the state.
To test the validity of WSDM results, a comparison of water demand projections and actual water abstraction since 2008 was undertaken. The evaluation showed that modelled growth rates for industry output, gross value added, employment and population are suitable indicators for projecting the long-term water demand trends of different water usages. It also found that consulting across government and industry was important for identifying ‘trend-breaking’ growth scenarios and aligning the model results with established land use plans, development proposals and water efficiency initiatives.
Western Australia’s total water demand is projected to grow to 3600 GL (average annual growth rate of 1.8%) by 2050 under a medium growth scenario. This is lower than the average growth in water demand of 2.8% per year between 1985 and 2015. The highest long-term projected growth in water demand is expected to be for irrigated agriculture and mining in the state’s northern regions.
In southern Western Australia, the availability of groundwater and surface water resources is limited and will not meet the estimated water demand for urban expansion and increased food production, so increased water efficiency and alternative water sources are needed.
Sharing data and knowledge is fundamental to the Department of Water and Environmental Regulation’s stewardship of Western Australia’s water and environmental systems. The WSDM program provides relevant, transparent and credible information about the water resources and supplies that are needed to support Western Australia’s future economic and population growth.
Increasing awareness and knowledge about the state’s water challenges and opportunities is expected to help deliver the actions needed to maintain economic growth and urban liveability with limited water resources in a drying climate.
Introduction
Continued investment in Western Australia’s mineral resources over the past decade has driven high growth in demand for water resources, particularly in the north of the state. During the same period, low inflow to dams and recharge to aquifers reduced the water available for potable and non-potable use in the more densely populated south-west of Western Australia.
The situation prompted government and industry to call for coordinated, long-term water supply planning to support the state’s sustainable development. The planning would identify shortfalls in groundwater and surface water so alternative and cost-effective water supplies could be determined ahead of time.
To model plausible scenarios of future water demand, the Department of Water and Environmental Regulation developed the ‘Water Supply-Demand Model’ (WSDM) and engaged industry experts to analyse and refine the model results.
The WSDM projects demand for all water uses and resources in Western Australia using economic data from computable general equilibrium modelling and population forecasts to 2060.
The econometric principles used in the WSDM were first applied in the ‘Demand Scenario Modelling Tool’ developed by the Department and Resource Economics Unit in 2006. The demand scenario modelling tool used economic trend data from the Monash TERM (The Enormous Regional Model) for the period from 2008
to 2030.
This paper examines the water demand forecasting method, key elements of future projections and how the model development and outputs have supported the setting of strategic directions for Western Australia’s water resources and supplies.
Methodology
The Water Supply-Demand Model (WSDM) (Figure 1) was custom-built using GoldSim software in association with Jacobs Consultants. The WSDM is a deterministic model that draws on defined data sources stored in an enterprise data warehouse using an Extract, Transform and Load system.
The WSDM supersedes the demand scenario modelling tool, which consisted of base year water use estimates and a projection tool contained in Microsoft Excel workbooks. The workbooks were connected by an over-arching navigation program.
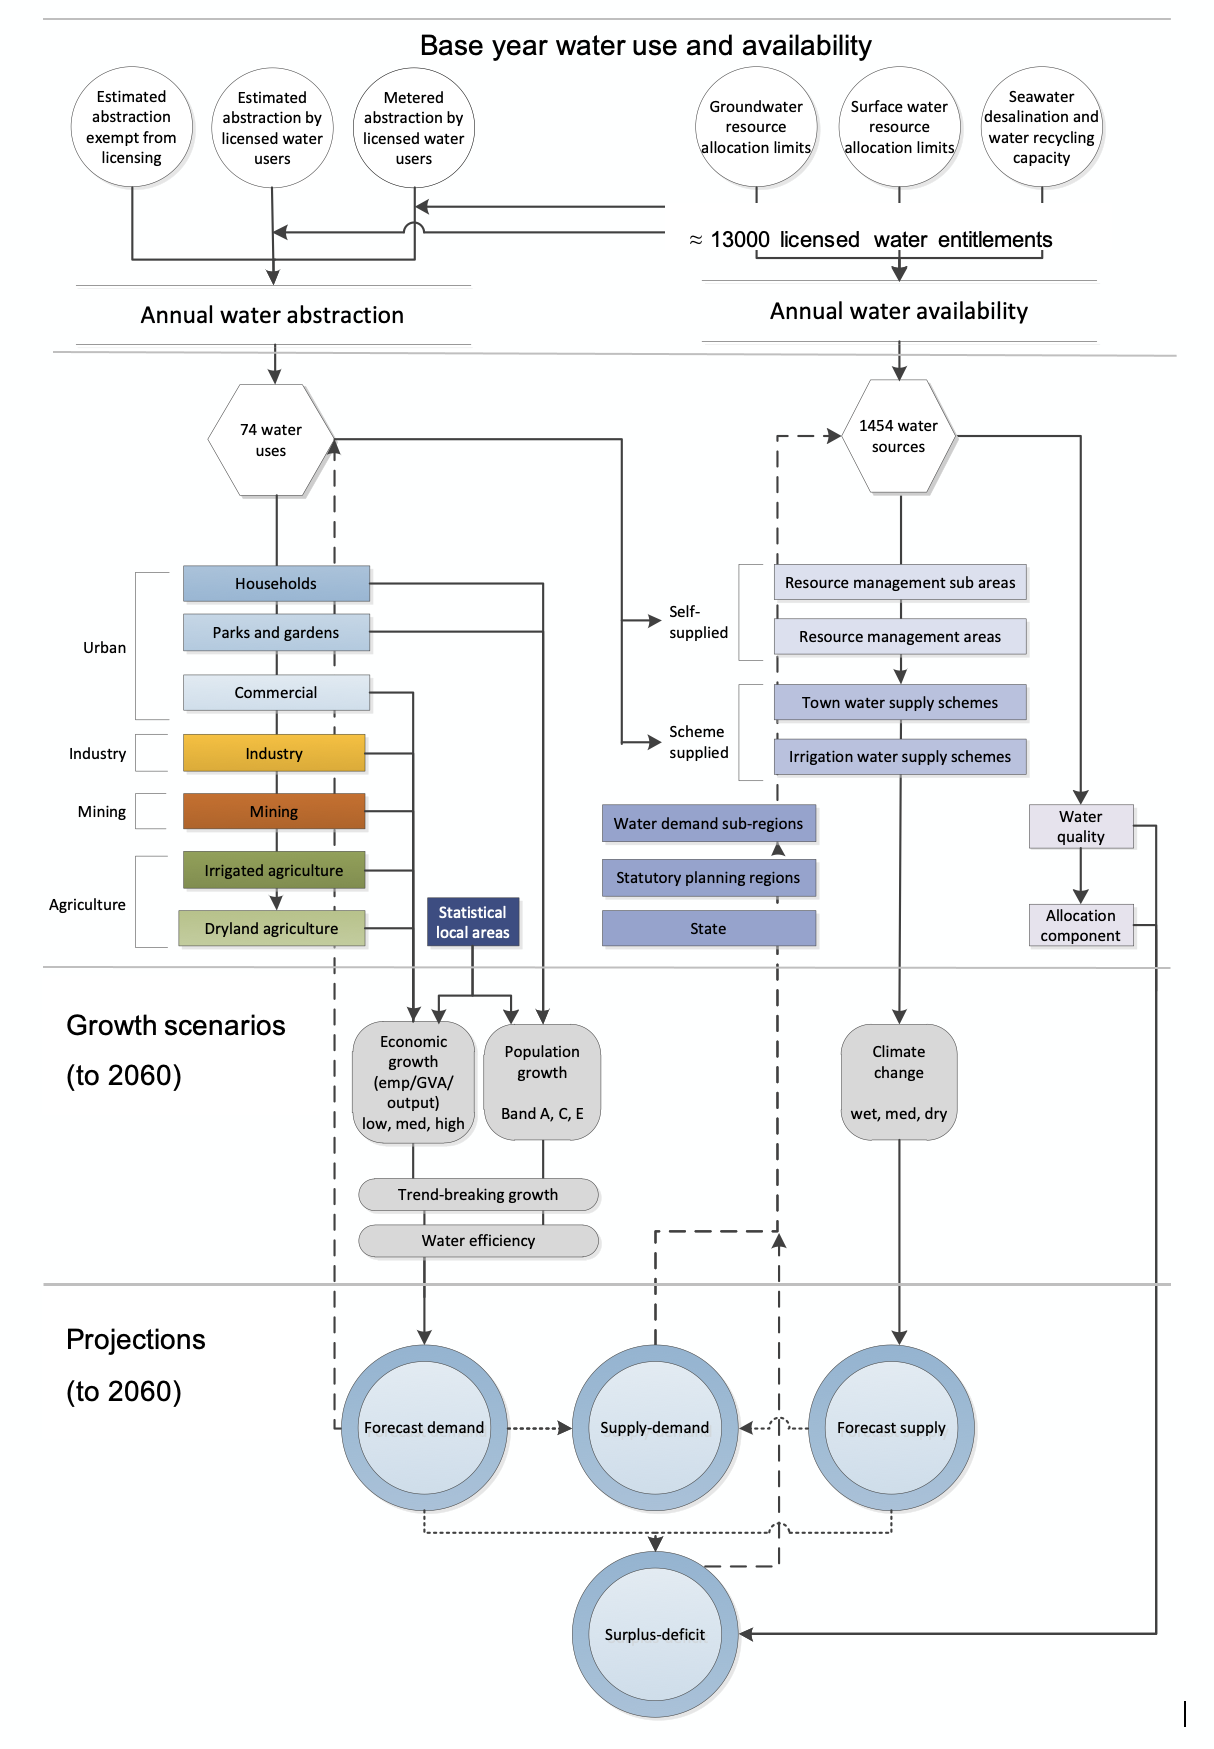
Figure 1. Conceptual diagram of the Water Supply and Demand Model for Western Australia
Model parameters
The WSDM draws on datasets containing information on approximately 13,000 licences to take groundwater or surface water under the Rights in Irrigation and Water Act 1914.
Future water demand is projected for each resource from a ‘base year’ estimate of current water use, which is mainly derived from meter data submitted by licensees.
The WSDM applies economic and population growth forecasts to current water use for 74 types of water usage (based on Australia New Zealand Standard Industrial Classification) and 1,454 groundwater, surface water and scheme water sources in Western Australia.
The annual water availability in WSDM consists of allocation limits set by the Department of Water and Environmental Regulation, which is the volume that can be sustainably taken for use from Western Australia’s groundwater and surface water resources (i.e. aquifers and sub-catchments).
Water resources include those proclaimed under the Rights in Water and Irrigation Act 1914 for licensing the take of water as well as resources that are not proclaimed under the Act. Water resources aggregate to management sub-areas and management areas for planning and management purposes.
Annual water availability also comprises water supply schemes, which can draw on numerous resources (i.e. groundwater, surface water, seawater desalination and recycled wastewater) for distribution to consumers.
Each water source in the WSDM is assigned a generalised water quality rating, which in this case refers to salinity. Salinity categories from Hem (1970) are used to indicate if the quality of water from a resource is suitable to support specific water usages.
Economic and population growth scenarios
The economic growth rates used in WSDM are derived from Computable General Equilibrium (CGE) modelling undertaken by the Centre for International Economics (CIE).
A suite of economic models, CIE G-Cubed, CIE-REGIONS and the Food Processing Model, were used to project annual growth in industry output, industry value added and employment for 68 types of water usage types in 24 ‘water demand’ regions in Western Australia.
The economic projections are based on assumptions by CIE about exogenous variables affecting economic growth. These ‘supply-side’ and ‘demand-side’ variables are fed into the models, which produce state level economic growth projections for WA and other states and territories. The state level results are then allocated using a ‘top-down’ approach to the more detailed regional level.
To refine the regional economic projections, an analysis of regional economic structures and development plans was undertaken. A shift share analysis of regional industrial employment growth between 2006 and 2011 was carried out to inform variation of industrial growth rates among regions.
Sixty-eight of the water usage types in the WSDM are assigned one of the three economic growth ‘indicators’ (industry output, industry value added or employment).
The assigning of indicators to water usage follows the ‘intuition’ approach developed by Thomas and Wittwer (2008). Industry output or gross value added growth rates are applied to those water usage types (e.g. primary industries, heavy manufacturing industries and construction) where the volume of water used or input, correlates to levels of production or output.
Employment growth rates are used for service industries where human consumption is the main driver of water demand such as in banking, government, education and health services.
The water demand projection for each water usage type designated to a relevant economic indicator is therefore calculated by multiplying the base year water use in each water resource by the annual economic growth rate from the CGE modelling for that indicator.
Three growth scenarios (high, medium and low) were developed for each indicator based on different assumptions that reflect the uncertainty of long-term economic growth.
The remaining six water usages applied in the WSDM (e.g. households, parks and gardens) are identified as ‘population-driven’ water uses.
Western Australian Planning Commission (2016) population growth forecasts at Statistical Local Area (SA2) level were used to project ‘population driven’ water demand.
Each water resource is designated to SA2 and local government boundaries so population growth rates are applied to current water use at a geographic scale that is relevant for water resource and supply planning.
SA2 boundaries fit wholly within regional planning boundaries (as defined in the Planning and Development Act 2005) and the 24 ‘water demand sub-regions’ defined by the Department of Water and Environmental Regulation as areas with similar water and land use characteristics. The model therefore produces results for resources, management areas, sub-regions and regions.
Other factors influencing water demand that can be adjusted by model users are ‘trend-breaking’ growth and water efficiency scenarios.
On the supply side, the model can also apply climate change projections to estimate future water availability and water quality indicators to determine if the water available is suitable to meet the projected demands for different water usages.
Climate change scenarios
Future water availability in the WSDM can be adjusted using climate change scenarios identified by Marillier, Hall and Durant (2015) for 80 water resource management areas in Western Australia’s south-west land division.
Changes to surface water inflow and groundwater recharge were estimated using the predicted rainfall and temperatures under future climate compared to those for the 1961 to 1990 baseline period. These factors are only applied after 2030 for management areas where existing allocation limits have already accounted for climate change.
Climate change projections were not used in the north and central parts of the state because climate modelling is less certain and the historical variability in annual rainfall is greater than the predicted variability under future climate scenarios.
‘Trend breaking’ scenarios
Potential new projects based on major public or private investment can have a large effect on future water demand. General equilibrium modelling does not evaluate the likelihood or timing of major new projects but instead grows individual industry sectors in each region to aggregate up to an assumed level of state growth based on a range of assumptions about exogenous economic factors.
Consultation with stakeholders identified where ‘trend-breaking’ water demand scenarios might occur based on the plans of industry and regional development agencies.
The consultation program involved 32 stakeholder groups representing the agriculture, mining, regional development, urban development and water services sectors, as well as local and state government agencies.
Feedback received from industry was used to refine the economic modelling and to support anlaysis of the results.
Thirty-five state and regional development priorities were identified where ‘trend breaking’ water demand could potentially exceed the water available and constrain growth from occuring.
Discussion and results
Growth in water demand 1985-2016
Analysis of historical changes in water demand provides a useful guide to how water demand can change over time for different sectors and regions.
Western Australia Water Resources Council (1986) estimates of gross water consumption provide a robust and relatable dataset to evaluate change in water demand over the past thirty years.
Based on this analysis, the average annual growth in the state’s total water use since 1985 was 2.8% per year. During that period urban water use grew, on average, by 1.6% per year, agriculture 1.9% per year, heavy industry 3.6% per year and mining at 6.9% per year (Figure 3).
The proportion of surface water use has declined from 56% of the state’s total in 1985 to 21% in 2016. Groundwater use increased from 44% to 70% of the state’s total water use.
This shift in water supplies coincides with a period of reduced rainfall and rising temperatures caused by climate change in south-west Western Australia.
The proportion of water sourced by independent water users (self-supplied) grew from 42% (350 gigalitres (GL) of the state’s total water use in 1985 to 66% (1317 GL) in 2016.
The proportion of water used for town water supply schemes declined from 32% (266 GL) in 1985 to 20% (408 GL) of the state’s total water use in 2016.
The proportion of water obtained from irrigation supply schemes decreased from 27% (227 GL) in 1985 to 14% (275 GL) in 2016.
Comparison of actual and projected water demand for 2008-2016
An evaluation of the econometric modelling method and the three indicators of future growth in water demand used by Thomas (2008) was undertaken for each sector and region prior to developing the Water Supply and Demand Model.
The evaluation involved running the demand scenario modelling tool developed in 2008 with the original Monash TERM model growth rates (medium projection) to the year 2016.
Modelled results were compared with the average annual growth in water use measured to 2016 and the performance of each indicator was assessed for different water usages.
Improvements to the accuracy of annual water use estimates since 2013 meant that 2008 base year estimates needed to be adjusted.
The actual growth in total water demand of 3.06% per year from 2008 to 2016 was higher than the 2.74% per year originally projected for the medium growth scenario, but less than the high growth projection (3.3% per year).
The application of population growth forecasts in 2008 caused the projected household water demand (both scheme and self-supplied water usages) to be overestimated, despite the realisation of high population growth rates that were forecast for the Perth, Peel and South West regions.
Actual growth in household water demand of 1.6% per year was significantly less than the projected 2.2% per year. This is likely to reflect the success of water demand initiatives by Western Australia’s Water Corporation, including awareness raising and continued restrictions on the frequency of water use from scheme supplies and domestic garden bores.
The industry value-added growth rates applied in 2008 generally anticipated the short-term growth in water demand for agriculture, mining and industry.
The annual average growth in water demand for irrigated agriculture of 1.3% per year was lower than the projected 1.8% per year.
The projections for most regions were closely aligned to actual use except in the South West Irrigation Area and East Kimberley where changes in crop types and land use caused a reduction in water demand between 2008 and 2013.
The trend in the East Kimberley reversed from 2014 to 2016 as a result of new agricultural land being developed that used water from the Ord River.

Figure 2. Projected and actual growth in water demand between 2008 and 2016
In the mining sector, lower commodity prices, investor uncertainty and the transition from a construction to an operational phase since 2012 have not affected recent growth in water demand as iron ore mining production and dewatering has continued to increase.
Growth in water demand for mining of 7.4% per year from 2008 and 2016 exceeds the projected average annual growth of 3.5% under the medium growth scenario.
The difference between the projected and actual water abstraction for mining is due to the large volumes of groundwater abstracted for mine dewatering, which provides for access to mineral deposits below the water table.
Mine dewatering constitutes about 65% of the total water abstracted for mining in Western Australia and typically requires large volumes to be abstracted in the early years of mine production.
Seasonal rainfall events and depth to local water table have a significant effect on the volume of dewatering so ‘industry output’ is generally not a suitable indicator of growth in the total water abstracted for mining.
When mine dewater (that is not used for mining operations) is removed from the analysis, the growth in water demand for mining reduces to 4.3% per year for the period from 2008 to 2016.
Industry output growth rates for heavy industry generally aligned with the measured growth in water demand. Water demand for parks and gardens grew steadily in line with population growth.
WSDM long-term water demand projections
The Department of Water and Environmental Regulation is projecting Western Australia’s total water demand will grow to 2600 GL by 2030 and 3600 GL by 2050 under a medium growth scenario. The projected growth in water demand from 2016 to 2050 is around 1.8% per year.
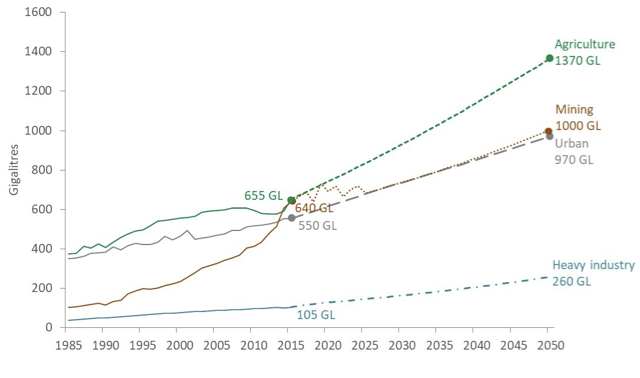
Figure 3. Historical (interpolated) and projected water demand (medium growth scenario) for Western Australia’s water sectors
The forecast growth in Western Australia’s agriculture sector is expected to result in an increase in water demand to between 1170 and 1580 GL per year by 2050. This growth in water demand (between 2.0% and 2.9% per year) for irrigated agriculture is projected to be faster than the growth experienced over the previous 30 years.
Proposed changes in land use to support new irrigated agriculture enterprises, particularly in Western Australia’s northern regions, would bring about this higher future water demand for agriculture.
The Chamber of Minerals and Energy’s biannual survey of mining companies for the State Resources Sector Outlook (2015) forecast water abstraction to increase from 606 GL in 2014 to 682 GL per year by 2025.
The Department’s long-term water demand forecast for Western Australia’s mining sector is an increase to between 780 and 1080 GL per year by 2050.
The longer term outlook for the Western Australian resources sector is strongly influenced by demand from our global trading partners, in particular China. Longer term forecasts from industry participants and market analysts suggest that Chinese demand for iron ore may peak in 15-20 years, resulting in a stabilisation of demand globally.

Figure 4. Current and projected water demand scenarios for Western Australia’s planning regions
The volume of water abstracted for mine dewatering is only weakly correlated to forecast growth in output, so long-term projections need to better consider the hydrogeology associated with ore bodies to be mined in the future.
As iron ore mining below the water table intensifies in the Pilbara, abstraction of water for mine dewatering will increase. This will create challenges and opportunities for managing the water that is surplus to the needs of mining operations.
Population growth forecasts to 2050 for Western Australia range from 1.3% to 1.9% per year. Based on WSDM results the Department has forecast that urban water use will increase between 1% and 1.6% per year over the same period as the community adapts to climate change, efficiency measures and the higher cost of alternative water sources.
WSDM projections assume a 15% reduction in urban water use per person (i.e. scheme and self-supplied) by 2030 from 2014 levels. We have not attempted to predict further changes in per capita water consumption after 2030, although it is likely that regulatory measures, advancements in technology, changes in consumer behaviour and urban form will continue to reduce water demand.
In south-western parts of Western Australia, availability of groundwater and surface water resources is limited and will not meet the estimated water demand for urban expansion and increased food production, making increased water efficiency and the use of alternative water sources necessary.
Water demand projections for heavy industry by 2050 range from 200 GL to 390 GL per year, reflecting the broad possibilities for the state’s future economic profile including how we generate energy.
In the north of the state, future industrial development is associated with growth in production of commodities such as gas, petroleum, iron ore and other minerals.
In the south of the state, power generation, food and timber processing, smelting activities, and mineral and chemical processing will drive future growth in water demand for heavy industry.
Around 14% of current water abstraction for heavy industry is for coal-fired power generation, which is located mainly in the Collie groundwater area.
A transition to alternative energy sources will likely cause a significant change in the intensity and distribution of water demand for electricity generation in the state.
Conclusion
The Water Supply Demand Model provides plausible scenarios of future water demand and availability across the state. However the data and assumptions about economic growth and major development proposals require regular evaluation and updating.
Trend-breaking growth scenarios need to be reviewed annually with a group of government agencies involved in land use planning, primary industries, state and regional development and water service provision.
Analysis of projected and actual water demand has also found that a new method to estimate mine dewatering is needed to provide a more accurate projection of future water abstraction for mining.
In Western Australia’s southern regions, the combination of decreasing water supplies and increasing demand requires careful management of existing water resources and the development of sustainable methods to meet the water supply and demand balance in the future.
Major population centres are adapting to less water availability and preparing for a drier and hotter climate. Innovations are emerging to improve urban liveability with water sensitive urban design, increase the value of industry production while using less water and in the development of alternate water sources.
In the north, groundwater and surface water is available to grow primary industries in a way that befits the unique environment and cultural fabric of these regions while realising the potential social and economic benefits of increased food production and export of raw materials.
Information from WSDM about the frequency and intensity of water deficits across the state is used by the Department of Water and Environmental Regulation to support a risk-based approach to water resource investigations, allocation planning, licensing and compliance activities, which underpin sustainable water resource management.
Our water supply and demand projections also provide industry and government with time to prepare for long-term changes. Proactive planning to develop alternative water supplies will help avoid unsustainable abstraction from groundwater and surface water sources.
The WSDM program demonstrates that providing relevant, transparent and credible information about the state’s current and future water demand and available supplies enables more purposeful communications and engagement with key stakeholders. By providing relevant data the department is highlighting the water challenges and setting the strategic directions needed to inform stakeholders of the need to develop the best and most appropriate water supply solutions.
Acknowledgements
The Water Supply-Demand Model project was completed with funding from the Royalties for Regions (Water and NRM theme) regional water availability, planning and investigation program.
The project builds on previous water demand modelling work by the Department of Water and Jonathan Thomas (Resource Economics Unit), published in the Western Australia’s Water Futures (2008) report series.
The project team at the Department of Water and Environmental Regulation responsible for delivering the project included Daniel Ferguson, Amy Cowdell and Roy Stone. The project was delivered in association with the following consultants:
- Jonathan Thomas (Resource Economics Unit)
- Alistair Fox and Blair Thornburrow (Jacobs Consultants)
- Tingsong Jiang and David Pearce (Centre for International Economics)
- Phil Pickering (Marsden Jacobs and Associates)
The Department also acknowledges the significant contributions from representatives of government and industry.
About the author
Dan Ferguson | Dan Ferguson is a Principal Water Planner for Western Australia’s Department of Water and Environmental Regulation specialising in demand management and water supply planning. Using skills in strategic planning, data science and stakeholder engagement, Dan is committed to achieving the sustainable use of the state’s water resources. He has completed a Bachelor of Science (UWA), post-graduate qualifications (Water Resources Management, Rangeland Management, Public Sector Management) and the Water Leadership Program at the International Water Centre. Earlier in his career Dan was a leader in regional natural resource management in South West Queensland and Western Australia’s wheatbelt
References
The Centre for International Economics 2015, ‘Economic growth data for the State water supply-demand model’, unpublished, Canberra ACT, 2016.
Chamber of Minerals and Energy of Western Australia 2014, ‘2015-2025 Western Australian Resources Sector Outlook’, Deloitte Access Economics, Perth.
Hem 1970, ‘Study and interpretation of the chemical characteristics on nature water’ Geological Survey Water Supply Paper 1473, United States Government, Washington.
Marillier, B., Hall, J. and Durant, J. 2015, ‘Selection of future climate projections for Western Australia’, Water Science Technical Series, report no. 72, Department of Water, Western Australia.
Thomas, JF. 2008, ‘Water futures for Western Australia. Volume 1 – State Report’. Department of Water, Perth.
Thomas, JF and Wittwer, G. 2008, ‘Water futures for Western Australia. Volume 3: Application of the Monash TERM model’. Department of Water, Perth.
Western Australian Planning Commission 2015, ‘WA Tomorrow 2015 Medium Term Population Forecasts for Western Australia, 2014 to 2026’, Population Report No. 10, Department of Planning, Government of Western Australia, Perth.
Western Australia Water Resources Council 1986, ‘Water Resource Perspectives, Western Australia, Report No. 2, Water Resources and Water Use’, Summary of data for the 1985 National Survey, Western Australian Water Resource Council, Leederville, Western Australia.
Share