


Innovation through collaboration

Improving Urban Water Management for a Reef Council
DOWNLOAD THE PAPER
Abstract
With little data available on the quality of stormwater discharging from urban catchments to the Great Barrier Reef (GBR), the driver for the Smart Catchments: Saltwater Creek project was “If we don’t monitor, we can’t manage”.
To do this, near real-time high-frequency discharge and water quality data are needed. A second driver was to make available, for the first time in a GBR catchment, near real-time water quality data for Council’s management actions but also for the community from an education perspective to engage them in water quality issues.
Working collaboratively with industry, community, educators and scientists, the project, led by Cairns Regional Council, fulfils a commitment to the Reef 2050 Long-Term Sustainability Plan. This paper presents a more holistic and effective approach to monitor and manage water quality runoff from urban catchments.
Introduction
The Great Barrier Reef (GBR) is the world's largest coral reef system, stretching for more than 2300 kilometres and neighbouring 15 Australian coastal councils and their urban communities. The declining health of the GBR is attributed not only to climate change but, especially in inshore regions, to poor water quality originating from terrestrial sources (Kroon et al., 2016), in particular from dissolved inorganic nitrogen (DIN), sediment, pesticide and herbicide chemicals. Cairns Regional Council is committed to ensuring that water discharging from catchments in its jurisdiction does not negatively impact on this World Heritage Site.
The Cairns Regional Council has traditionally focused on monitoring the water quality impacts of discharges from its six sewage treatment plants. There is little information available on the impact of urban stormwater runoff in terms of the contributions of nitrogen and sediment loads discharging to the GBR lagoon. Obtaining this information is technically complex and expensive but important in assessing relative water quality impacts to the health of the GBR (Leigh et al., 2019).
The Smart Catchments Project, partly funded by the Australian Government’s Smart Cities and Suburbs Program (Department of Industry, Australia) monitors an urban catchment in Cairns using the latest sensors and smart technology to collect automated near real-time water quality data. Monitoring activities are closely tied to modelling efforts for effects-based decision making and improved management of catchments draining into ecologically sensitive areas. At the same time, the Council is interested in engaging communities using water quality education and engaging games.
With this in mind, Council collaborated with James Cook University (JCU), Itron Australasia and the Wet Tropics Waterways Partnership to undertake an innovative pilot project to:
- monitor the water quality discharging from an urban creek to the GBR lagoon in near real-time;
- make the near real-time water quality data available to the community in a meaningful way to increase knowledge and engagement in local water quality issues; and
- complement the data with educational tools designed to teach students how to interpret the water quality data.
The Smart Catchments Project started in 2018 and is currently ongoing. This paper outlines an approach that incorporates innovation and collaboration amongst industry, academia and local stakeholders to monitor and manage water quality runoff from a GBR urban catchment. This paper was first presented at Ozwater’20 Online.
Study site and context
Saltwater Creek is a developed urban catchment north of the Cairns central business district (Figure 1). The catchment is approximately 16.4 km2 with a relatively flat topography and headwaters in the Whitfield Range. One characteristic that makes this catchment difficult to study is the extent of estuarine influence upstream into the catchment.
In Figure 1 below, estuarine waters can be detected as far upstream as Sites 4 and 8. Site 5 was chosen as an "upper catchment" reference site with minimal development. Sites 2, 3 and 4 were chosen specifically to measure impacts of emergency wet weather sewer overflows from a pump station located close to Site 3. Sites 6 and 7 are sites potentially impacted by typical urban activities such as road runoff, urban litter and pet activities. Site 8 is more likely to be impacted by light industry.
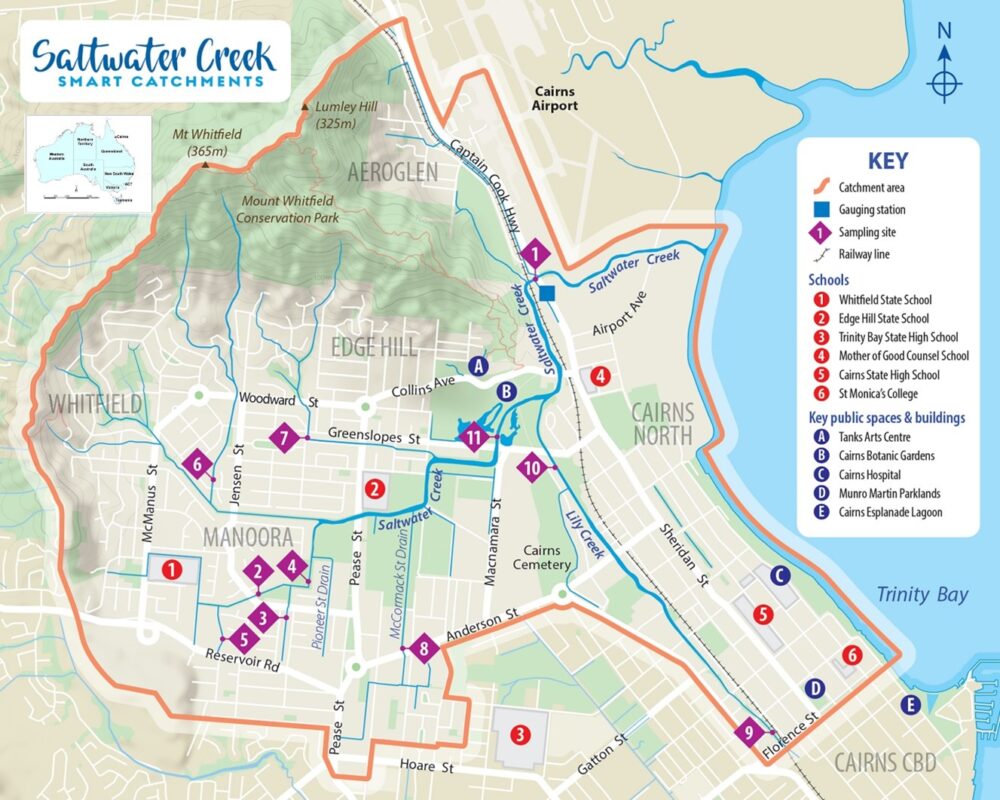 Figure 1: Saltwater Creek Catchment, Cairns Queensland
The catchment was chosen because it faces a number of water quality pressures including urban and light industry runoff, wet weather overflows from the sewerage network, flooding and tidal inundation. In addition, there is an increasing community expectation that:
- Council better understands the potential impacts of the urban environment on the GBR lagoon as well as for the local communities (Commonwealth of Australia, 2018, Dirckx et al., 2019, Dittmer et al., 2020);
- the liveability of urban catchments is improved (Kelliher et al, 2017);
- and infrastructure investments are based on best value for money models (Radcliffe, 2018).
Finally, in order to influence community behaviour towards water quality issues, Council invests in water education activities, particularly focused at schools. To have the greatest effect, teachers from local schools have requested access to local data and case studies to engage students in their learning activities.
Methodology
To meet the above demands, Council requires a number of tools, in particular a detailed catchment hydrological and water quality model. Council installed an end of catchment water quality gauging station on Saltwater Creek in May 2019 (Figure 1). Council also installed several pressure transducers throughout the catchment, flow meters in the sewer network and commenced catchment water quality monitoring at defined intervals.
Council worked in close partnership with James Cook University (JCU) to plan and execute the pilot project. Other partners included Itron Australasia who have commenced installing smart water meters in Cairns, the Queensland Department of Natural Resources Mines and Energy (DNRME) and the Wet Tropics Waterways Partnership. Concurrent to the catchment-monitoring program, Council developed a calibrated sewer model, a validated flood model and a stormwater quality model.
Project activities were separated into two different but highly dependent streams: a technical stream and a community engagement stream.
Data collection and modelling
To collect continuous high-quality catchment water quality data, a gauging station was installed at the downstream end of Saltwater Creek catchment. The station is designed and constructed based on similar stations operated by the Queensland Department of Environment and Science in other GBR catchments. This will allow future direct comparison of data across catchments.
The Saltwater Creek gauging station (-16.89374°S, 145.75297°E) is tidal and experiences a range of water quality conditions ranging from freshwater to saline conditions. In addition, grab samples are also taken from other locations within the catchment. This supplements the end-of-catchment water quality data collected at the gauging station and provides information to understand pollutant source and transport pathways within the catchment.
The gauging station adopts innovative state-of-the art technology to monitor streamflow and water quality. This includes the use of the latest UV spectral sensors to monitor nitrate continuously in near real-time in a highly dynamic environment (freshwater to saltwater conditions). The advantages of this are that episodic water quality events experienced at the Saltwater Creek catchment (e.g. wet-weather sewer overflows, flooding) can be quickly detected and managed (Pellerin et al., 2016).
Stream discharge is also measured using camera technology and novel image processing algorithms to obtain flow velocities that are used to calculate discharge, a crucial piece of information for pollutant load calculations. Finally, an Internet of Things (IoT) data solution was adopted to process and upload data from all sampling sites into the cloud for further analysis and display.
High-frequency water quality data are collected using a YSI EXO2 sonde inside the gauging station measuring pH, dissolved oxygen, specific electrical conductivity, turbidity and chlorophyll-a data every 30 minutes. A TriOS OPUS instrument, with a spectral UV sensor, collects nitrate concentrations at the same 30-minute frequency. This sensor was chosen for its ability to provide continuous in-situ nitrate concentration information in a wide variety of environments, including changing saline conditions through its salinity compensation built into relevant calibrations.
The UV spectral sensor has the necessary detection limit and dynamic range to deal with the wide nitrate concentration range which other nitrate sensors, such as nitrate ion-selective electrode sensors cannot provide. The UV spectral nitrate sensors are the most mature of the in-situ nutrient sensors available on the market (Pellerin et al., 2016). Sensors to measure phosphorus and ammonia, under the conditions required, are not currently available. Phosphate and ammonia data are currently obtained from other water sampling activities (see below).
The small size of the Saltwater Creek results in flashy stormwater water quality responses, which may be missed at a 30-minute sampling frequency. However, a finer-resolution sampling frequency is not achievable because of the time required to flush and refill the sampling chamber where the sensors are encased. It is intended to use deep-learning techniques to produce a finer resolution water quality time-series dataset when we have a longer and more robust dataset.
Grab samples are also collected throughout the Saltwater Creek catchment at monthly intervals during the dry season and more frequently in the wet season (Figure 1). The samples are collected at a high outgoing tide and in accordance with the QLD Water Quality Monitoring Manual (EHP, 2010) before being sent for analysis at a NATA certified laboratory.
An ISCO automatic water sampler is also used to collect high frequency samples at the gauging station during selected rainfall events to provide additional information on rapid discharge events. These grab samples are analysed for salinity, dissolved oxygen, turbidity, nitrate, orthophosphate, total nitrogen, total phosphorus, ammonia and enterococci.
As a recent enhancement, catchment-wide water quality data are now automatically uploaded from the Laboratory Information Management System (LIMS) to the cloud-based water data management platform, described later in this section.
Discharge measurements at the gauging station are based on the innovative space-time image velocimetry (STIV) principles introduced by Fujita et al. (2007) and further improved within the scope of this project. Visible and infrared CCTV cameras pointing at the creek provide video streams where surface flow velocities are calculated. Surface flow velocities are then converted into mean velocity values that are used for discharge calculations.
Water depth is also measured at the gauging station using traditional pressure transducers. Every 10 minutes a water depth reading is taken and sent to the IoT edge computing device which triggers the camera streaming and where discharge computations are done on-site at the gauging station. Once the discharge computations are completed, the water level, surface velocity and discharge values, along with water quality data, are transmitted to a data control unit at the gauging station and onto a cloud-based platform to be integrated with the water quality data.
The advantages of this solution include: near-real-time continuous discharge data, a fully automated discharge measurement process, and creek images that are available at a significantly lower cost than traditional automated velocity measurement techniques, such as the commonly used Acoustic Doppler Current Profilers mounted on river banks or beds.
All instruments in the gauging station are controlled by a Campbell Scientific data logger (CR1000x) and data are transmitted from the data logger to a cloud-based software.
A commercially available, cloud-based water data management platform was selected for the capture, analysis and display of the data (discharge, water quality, rainfall). Key criteria considered in selecting a suitable platform included: the maturity of the water analytics capacity; track record; security for Council’s information technology systems; flexibility with management of data; simplicity in display of data and most importantly, its capacity to automatically pull data from several sources, integrate and make them publicly available through a web based platform.
A water quality dashboard was generated to display data through this platform which facilitates easy data access and serves as a central repository by which all data can be analysed simultaneously (Figure 2). Data are available visually in near-real-time and can be downloaded from the portal once it has been quality checked. This capability is a first for the GBR catchments and is one of the innovative approaches used for water quality monitoring and management in this project.
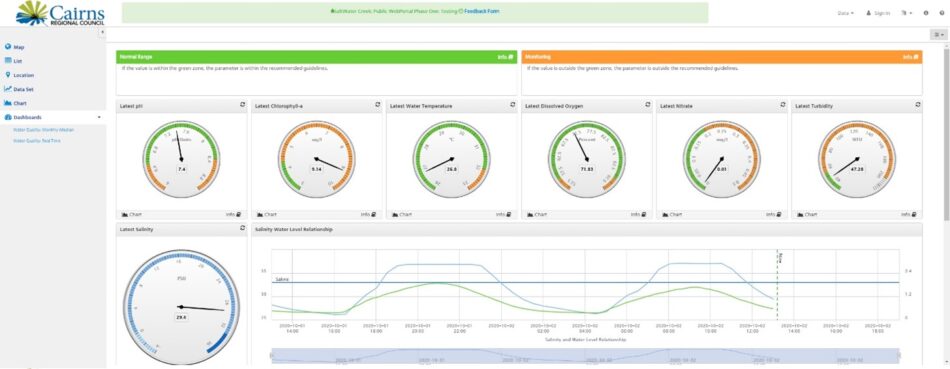 Figure 2: Saltwater Creek Water Quality Dashboard with information displayed at a sampling location (above) and map of all water sampling sites with corresponding real-time water quality information.
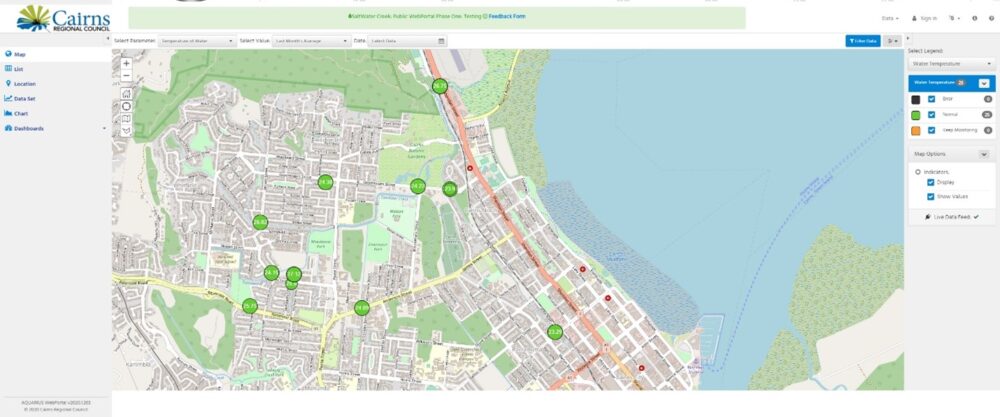 Figure 2 (continued): Saltwater Creek Water Quality Dashboard with information displayed at a sampling location and map of all water sampling sites with corresponding real-time water quality information.
Increasingly, modelling of urban systems has started to adopt an integrated approach especially with the ability to collect discharge and water quality data at high frequency with the use of automated equipment and techniques (Hutchins et al., 2017). This project adopts an integrated modelling approach, incorporating hydrological models that consider multiple connected systems (wastewater treatment plants and overflows, surface runoff and sewage pipe flow) as well as water quality models.
The Saltwater Creek catchment forms part of a series of catchments, known as the CBD and Environs, that surround and contribute to flooding to the Central Business District. Council recently completed a 2D hydraulic analysis of the CBD and Environs catchment, where events ranging from a 50% Annual Exceedance Probability to the Probable Maximum Flood were assessed in the software TuFLOW (BMT Grp Ltd). The model considers the impact of climate change on both sea level and rainfall. Because no long-term discharge data are available to formally calibrate the model, intensive community consultation was used to compare the model-predicted results against anecdotal evidence.
As part of the same study, a high-level stormwater quality model was developed using the software MUSIC (eWater Ltd). The purpose of the model is to estimate the annual loadings of key pollutants exported from each catchment and how these loadings may change as development and climate conditions vary in the future.
Furthermore, a calibrated sewer catchment model has been developed within the Infoworks ICM software (Innovyze). This model uses flow monitoring and rainfall data from the catchment to calibrate and run the model to better predict the performance of the sewer network under various rainfall conditions. Having a model that represents actual network performance provides significant benefits in understanding the influence of inflow and infiltration on the network and identifying potential overflow locations under a variety of storm situations.
As the discharge and water quality database expands with continued monitoring, the data collected will allow the calculation of DIN and sediment loads discharged from the Saltwater Creek catchment. This information will be useful to understand the relative contributions of stormwater runoff versus sewer overflow loadings into the GBR as well as their seasonal variations. This data will also be useful to calibrate the MUSIC model to inform future infrastructure and other catchment improvement decisions (Hutchins et al., 2017). IoT technology and deep learning techniques will allow the prediction and infilling of water quality data from the gauging station site (e.g. Leigh et al., 2019).
In the future, deep-learning techniques will be used to extend water quality datasets to reproduce the time-series data at a finer temporal resolution. In addition, data analytics will be investigated to assist with automating monitoring of instrument performance and data quality control.
The next phase will be to adapt the MUSIC model to Far North Queensland conditions, within the SOURCE framework, and integrate the outputs of the sewer model with the stormwater model so that relative source contributions of pollutants to Saltwater Creek can be better identified.
Community engagement
Community engagement commenced with a Walking the Landscape workshop (Department of Environment and Heritage Protection 2012). This workshop allowed relevant experts to work with key community stakeholders, including school teachers, to map the past and present values and uses of the Saltwater Creek catchment.
The workshop was facilitated by the Department of Environment and Science and was the first time in Queensland the methodology had been applied to an individual urban catchment. Without this information, the Council, stakeholders and the community cannot move towards a single vision for the catchment in terms of water quality management.
Another project outcome is the development of locally relevant, fun and engaging online games for use by schools and the community. These materials were developed in collaboration with JCU students and a local IT gaming start-up company using a design thinking process (Figure 3).
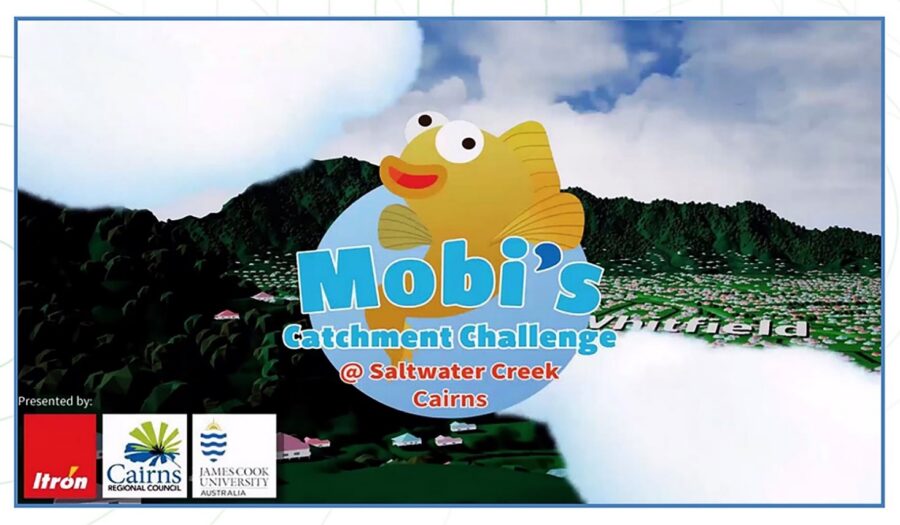 Figure 3: The Smart Catchment: Saltwater Creek program includes a number of educational tools commencing with Mobi’s Catchment Challenge (https://www.cairns.qld.gov.au/water-waste-roads/water/smartcatchments/educational-tools)
This was facilitated through a two-day Design Sprint activity run at James Cook University for information technology undergraduate students. From here, several final year IT students further developed the games as part of their industry work placement which also included testing the games with years 5 and 7 students as part of an extended design thinking process.
The result is Mobi’s Catchment Challenge games, which takes into account the Australian Curriculum and aims to teach students how to interpret the water quality information collected at the gauging station.
Supporting curriculum material is now being developed for teachers to use with the games and online data.
All resources and access to water quality data are freely available on the Council’s website. The educational games should be accessed through Google Chrome on a computer and have recently been made available through the Apple App Store by searching for Mobi’s Catchment Challenge.
Outcomes and measurable impacts
The full extent of outcomes and measurable impacts from this program are yet to be realised. The gauging station needs to collect data across a number of seasons in order to conduct model calibration and validation for both the stormwater quality model and the catchment hydraulic model.
The monitoring conducted so far has already highlighted water quality issues such as algal blooms in Saltwater.
The educational games and access to water quality data have been valued by local schools, with more teachers across both primary and high school wanting to use it to improve the curriculum.
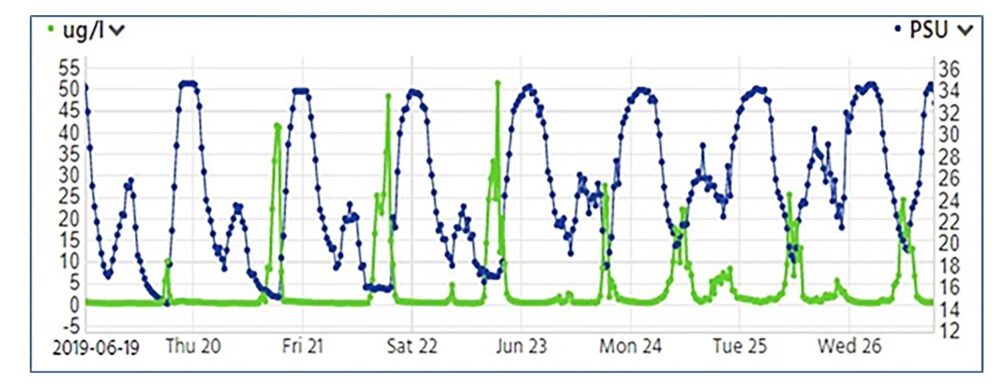 Figure 4: Chlorophyll-a concentrations (green line, left-hand axis) during an algal bloom on Saltwater Creek. Blue line is salinity (right-hand axis)
Lessons learnt and critical success factors
The approach described in this paper provides an example for other councils to consider if they are to improve sustainability in catchment management and reduce costs in the long term. It is without a doubt that the equipment investment is high, and challenging to install and operate. However, if the expensive monitoring schemes allow continuous data collection where the data are used for several purposes such as community engagement and educational purposes, then these reasons serve as justification for the high instrumentation and maintenance costs (Pellerin et al., 2016).
Lack of technical expertise is a problem that councils often have. In this case, the water utility provider is embedded in Council and skill sets commonly associated with this industry, for example, instrument technicians, information technology and laboratory services, have helped to overcome many of these barriers. In addition, this project has clearly shown that effective collaboration with industry, academia and the community has provided a very effective way of realising the project objectives.
Most of the technical challenges faced in this project are related to site conditions, particularly the wide range of flow conditions including tidal flows and urban runoff. The capacity of the TriOS OPUS nitrate sensor was challenged due to the range of concentrations encountered, from low nitrate concentrations prevailing under marine dominated dry season conditions to short-lived high nitrate concentrations during wet season storm events and sewer overflows. Semi-diurnal tidal changes in salinity and turbidity required complex calibration procedures to be tested and implemented.
These highly variable water quality conditions also meant that the project did not measure phosphate and ammonia continuously. However, Council is open to testing emerging nutrient sensors especially those that can deal with the wide nutrient concentration ranges experienced from freshwater to saline conditions.
The change in flow direction during tidal cycles as well as interference from raindrops or still water all present challenges for the STIV technology used to measure surface flow velocities. Work is underway to deal with such challenging conditions.
The hot and humid tropical conditions of Cairns required that the gauging station be constructed to withstand cyclonic conditions and flooding and stay relatively cool in the tropical temperatures. The gauging station is double skinned, well ventilated and coated in heat reflective paint to further reduce inside temperatures. Two small extractor fans were installed in the instrument board to reduce temperature. For troubleshooting purposes, station temperatures are also automatically monitored.
Another challenge was in the migration of the pilot project to business-as-usual. Key operational aspects have now been divided between Council’s Supervisory Control and Data Acquisition systems, laboratory, instrument and environmental teams. These teams have directly relevant experience because of the nature of the water business.
Over time, the operation of the gauging station will be further fine-tuned and automated based on this experience. Detailed operational procedures were prepared as part of the project to ensure this transition was made as easy as possible. Ongoing operational costs are still being evaluated. Data quality assurance is a significant ongoing requirement and detailed procedures are in place for calibration and cross checking of data accuracy. Water samples collected during the routine grab sampling activity or by the ISCO automatic sampler are used to cross-check the nitrate measurements made by the TriOS OPUS sensor for both dry weather and storm events.
Despite these challenges, the success and lessons of the pilot program are attributed to the following reasons. The first is the integrative and collaborative nature of the project, which reflects exactly the approach required to address the needs of the Australian urban water sector (Water Services Association of Australia, 2019).
Council technical staff regularly interacted with water quality experts from JCU to discuss instrumentation and implementation issues as well as to integrate and validate new equipment and technology. Council also involved other stakeholders through the Walk the Landscape activity to start a dialogue about catchment conditions and management needs. Council also engaged with industry to produce the games via a local gaming start-up company (with links to JCU).
Another contribution to success is that the sewer and stormwater networks in Cairns are managed within the one organisation, although not in the one department. Collaboration across Council will continue, in terms of data sharing and developing management tools for infrastructure assets.
Outreach plays a crucial role in any project and this project had access to an experienced science communicator along with the creative ability of information technology students which resulted in Mobi’s Catchment Challenge games.
As a result, this project has established a solid basis for the development of a community-driven urban water management plan. The next project aims to improve both water quality and liveability aspects of Saltwater Creek catchment. The Council has recently partnered with Ozfish to commence fish health surveys in the catchment (Ozfish, 2020).
Council’s ongoing objective is to partner with JCU to establish a detailed effects-based catchment model and to work with catchment stakeholders, building on the ‘Walking the Landscape’ workshop to develop a plan to improve water quality in this catchment.
Council will continue to explore opportunities to use the cloud-based water data management platform to assist with the analysis of significant spatial and longitudinal datasets to allow for more timely and effective decision making associated with environmental incidents, water resource performance and flood management.
Council will be maintaining links with schools to further develop curriculum based on the gauging station resources and to further develop relationships with universities and industry to build on the tools. As an example, Council is planning to work with the CSIRO to incorporate the Saltwater Creek nutrient and sediment load data into the e-Reefs model.
Conclusion
Using innovation through collaboration, the Smart Catchments: Saltwater Creek pilot project is not only driving a new and smarter way of monitoring water quality and environmental impacts in a Cairns urban catchment. By making this information easily and freely accessible, it is inspiring new audiences to take an interest in positive change and a sustainable water future.
Project timeframes were short, the budget tight and limited Council experience resulted in high risk because of the nature of the project. Yet, a key reason the program achieved more than expected was the collaboration between the Council, JCU, industry and other stakeholders including the local community. This collaborative approach allowed Council to incorporate innovative ways of collecting and managing water quality information, both from the technical monitoring aspect but also working with stakeholders to better understand the catchment and to produce information that is relevant to a wide audience.
The focus, cooperation and determination of a multifunctional team resulted in its success. The team had the freedom to be innovative, outcome-focused and confident to know that failure only meant looking for alternative pathways. The diversity in skills of the project team meant that the huge monitoring investment will be paid off in various ways including scientific data collection as well as the benefits of real-time monitoring for Council decisions on incident management and reporting, community engagement and education for a GBR catchment.
There is certainly scope for continued collaboration to ensure that the project success continues for the maximum benefit of the environment and communities. To this end, Cairns Regional Council, as a Reef Guardian Council, hopes to set a positive example for other councils in environmental monitoring and management efforts to improve Great Barrier Reef water quality.
The Smart Catchments Project can be accessed here.
Acknowledgements
We particularly thank Baly Zier and Darren Saint for their invaluable technical contributions to the project.
About the author
Dr Lynne Powell | Dr. Lynne Powell has worked with Cairns Regional Council, Water and Waste, for twelve years and is the Strategic Policy and Compliance Coordinator. Lynne oversees the Drinking Water, Environmental and Quality management systems and has a business performance and industry advocacy role. Lynne was project manager for the Smart Catchments project.
Dr HanShe Lim | Dr. HanShe Lim is a lecturer in Hydrology at James Cook University. Her interests lie in the hydrological response behaviour of tropical catchments, combining both fieldwork and modelling techniques. Her most recent projects include improving water quality in urban areas using water sensitive urban design infrastructure.
Iain Brown | Iain Brown is a Registered Professional Engineer of Queensland (RPEQ) in both the civil and environmental fields with over 10 years of experience both as a consultant and in his current role as a senior drainage engineer at Cairns Regional Council. He is also completing a PhD through USQ with his research focussed on understanding the level of uncertainty in the hydrological modelling of the Gowrie Creek catchment through continuous simulation.
Dr Tao Huang | Dr. Tao Huang (PhD, UNSW) is a lecturer in Electronic Systems and IoT Engineering at James Cook University, Cairns. He was an Endeavour Australia Cheung Kong Research Fellow. He is interested in real-world IoT applications, such as IoT privacy and security, end-edge-cloud network, big-data analytics, signal processing and wireless communications.
Dr Niels C. Munksgaard | Dr. Niels C. Munksgaard is a Geoscientist at James Cook University with more than 30 years’ experience working with the oil, mining and water-utility industries to improve environmental monitoring techniques. His present research interests are focussed on hydrological applications of stable isotope techniques.
Mark Randall | Mark Randall has worked in hydrometry for the Queensland government for 16 years and is particularly interested in flow measurement solutions for remote areas. Mark has been responsible for the development of multiple national hydrometric guidelines and is recognised as a leading international authority on image based flow measurement techniques.
Dr Jason Holdsworth | Dr. Jason Holdsworth has many research interests such as e-learning, m-learning, theoretical computer science, human-computer interaction, software engineering and information systems. Jason’s role in this project is to provide software development and project development expertise during the development of the virtual reality simulation around human computer interaction and user testing.
Helen Cook | Helen Cook - Design trained, with international experience in community consultation, Helen has delivered inspiring and effective solutions to communication and engagement challenges in the infrastructure, arts, education, health, environment and science sectors. Mobi’s Catchment Challenge was developed for targeted school-age audiences to identify with, understand, respond to and enjoy. Visit helencook.net.au
References
Sustainability Plan – July 2018.
Dirck, G/. Fe,i. A/. Wa,becq.T., Kroll, S., Weemaes, M. (2019) Dilution of sewage: Is it, after all, really worth the bother? Journal of Hydrology, 571, 437-447.
Dittmer, U., Bachmann-Machnik, A., Launay, M.A. (2020) Impact of combined sewer systems on quality of urban streams: frequency and duration of elevated micropollutant concentrations, Water, 12(3), 850, https://doi.org/10.3390/w12030850.
Fujita, I., Watanabe H. & Tsubaki, R. (2007) Development of a non-intrusive and efficient flow monitoring technique: the space-time image velocimetry (STIV). Int J River Basin Man. 5: 105–114.
Furlong, C., Brotchie, R., Considine, R., Finlayson, G., Guthrie, L. (2017) Key concepts for Integrated Urban Water Management infrastructure planning: Lessons from Melbourne. Utilities Policy, 45: 84-96.
Hutchins, M.G., McGrane, S.J., Miller, J.D., Hagen-Zanker, A., Kjeldsen, T.R., Dadson, S.J., Rowland, C.S. (2017) Integrated modelling in urban hydrology: reviewing the role of monitoring technology in overcoming the issue of ‘big data’ requirements, WIREs Water, 4;e1177 doi: 10.1002/wat2.1177.
Kelliher, ACM; Shanahan, M and Whiteoak, K. (2017) Integrated water planning to enable sustainable city growth [online]. In: SENG 2017: Sustainable Engineering Society Conference: Engineering Sustainable Cities. Melbourne: Engineers Australia, 2017: 18-23.
Kroon, F.J., Thorburn, P., Schaffelke, B., Whitten, S. (2016) Towards protecting the Great Barrier Reef from land-based pollution, Global Change Biology, 22 (6): 1985-2002.
Leigh, C., Kandanaarachchi, S., McGree, J.M., Hyndman, R.J., Alsibai, O., Mengersen, K. & Peterson, E.E. (2019) Predicting sediment and nutrient concentrations from high-frequency water-quality data. PLoS One. 14, e0215503.
Ozfish (2020) Saltwater Creek Waterway Management Plan, Cairns.
Pellerin, B.A., Stauffer, B.A., Young, D.A., Sullivan, D.J., Bricker, S.B., Walbridge, M.R., Clyde Jr, G.A., Shaw, D.M. (2016) Emerging tools for continuous nutrient monitoring networks: sensors advancing science and water resources protection, Journal of the American Water Resources Asosciation, 52, 4, 993-1008.
Radcliffe, J.C. (2018) Australia’s Water Sensitive Urban Design. Proceedings, 2018 International Sponge City Conference 1: 38-52, Xi’an, China, 8-10 September 2018.
Water Services Association of Australia (2019) Blue+Green = Liveability: the value of water to liveable communities, 36pp.
Share