


Implementing Australia’s first live catchment pollution detection network

The Melbourne Water project includes both research and new technologies to isolate and identify the sources of pollution entering the Upper Middle Dandenong Creek catchment
DOWNLOAD THE PAPER
INTRODUCTION
The Pollution Prevention Program was developed by Melbourne Water through the Enhancing Our Dandenong Creek program. Delivered collaboratively between 2013-2020, the project includes both research and new technologies to isolate and identify the sources of pollution entering the Upper Middle Dandenong Creek catchment. The purpose of the project was to reduce sources of pollution and improve the ecological condition of the receiving waterways. A key achievement of the program is the implementation of an Australian first live pollution detection network, developed through a highly collaborative partnership with multiple key stakeholders and research partners.
Keywords: Pollution, Stormwater, Technology
YEAR CASE STUDY WAS IMPLEMENTED
2013 to 2020
CASE STUDY SUMMARY
As the designated waterway manager for Greater Melbourne, Melbourne Water is committed to working with our customers, members of the community, other government agencies including the EPA, councils, and key stakeholders, including research partners to improve the health of Melbourne's waterways.
Melbourne Water has undertaken a comprehensive program after concluding that pollution, in particular industrial pollution, was the major stressor on the health of Dandenong Creek.
The pollution detection focussed works include the following activities:
- Ongoing chemical sediment sampling, testing and monitoring, and pollution assessment studies across 10 sites within the middle Dandenong Creek catchment area.
- Infrastructure assessments within the catchment area to identify failures or potential illegal connections contributing to the pollution, and investigations of these potential illegal connections.
- A multi-agency approach to signage, communications and enforcements.
- Identification hotspots by detecting changes in water depth, electrical conductivity and temperature, and activate alarms when levels go above set points.
- Development and installation of live pollution event data loggers at hot spots within the drainage system to identify and track irregular activity.
The focus of this case study is the development and installation of live pollution event data loggers.
CASE STUDY DETAIL
The Pollution Prevention Program had long term objectives because the complex problem of industrial pollution cannot be solved overnight. To gain a stronger understanding of how the complex drainage system upstream of the waterway was operating, Melbourne Water and its project partners focussed on two key aspects of pollution sourcing, the ‘when’ and ‘where’.
The ‘when’ – when was contaminated liquid flowing into the stormwater drainage network and how to differentiate it from rain events? Often the appropriate tool or test to assess pollution was not available.
Melbourne Water partnered with Iota and Monash University to develop two different types of live monitoring data loggers. The aim of the loggers was to locate ‘hot spots’ within the system, and to be flexible, cost effective and scalable. To locate hot spots, they needed to be able to detect changes in water depth, electrical conductivity, and temperature, and be able to send alarms when levels go above set points.
The first live monitoring device implemented for sub-catchment level pollution detection is the Advanced BlokAid® solution, which was initially developed by South East Water (Iota), and is designed to track flow, levels and corrosive gases in near-real time. The compact and lightweight design of the devices mean they can be moved quickly and easily. For the Pollution Prevention Program, Melbourne Water is working with Iota to adapt the Advanced BlokAid® device and for use in large diameter (1000mm and above diameter, see Figure 1) stormwater drains.
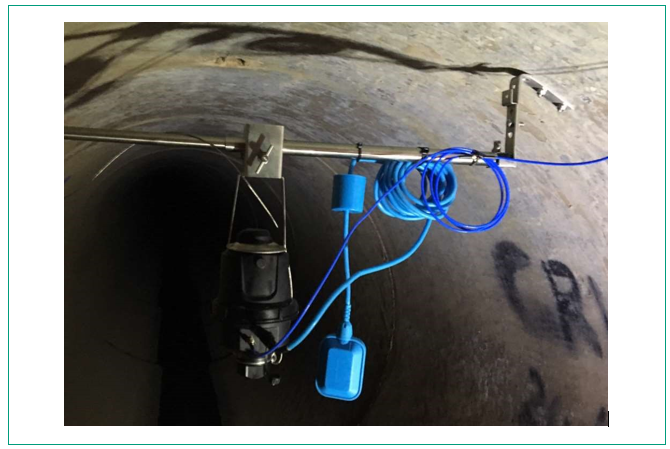
Figure 1: Advanced BlokAid installed in Melbourne Water drain.
The Advanced BlokAid® features ultrasonic sensors that can detect flow within the network that does not correlate to rainfall events. This enables the device to trace where possible pollution may have originated from within a set sub catchment area. The real-time data is monitored and recorded using an online portal. This enables the use of pre-set time intervals which can be changed according to the catchment monitoring needs.
The second unit has been developed for street level pollution sourcing – to source the ‘where’. These low-cost sensors are an Arduino-based, telemetry-enabled logger system. They were designed by Monash University to help identify the pollutants in stormwater focussing on smaller reticulation assets, helping to identify the pollutant discharged. The low cost of these sensors and loggers meant it was feasible to develop, test and deploy numerous water quality sensors. The user-friendly online server interface allows the stakeholder group to easily and readily access the data and understand pollution events that are occurring within the catchment, in real time.
After the development and production of the Arduino loggers was completed, they were installed into the system in an Australian-first trial in 2018. In Old Joe’s Creek catchment, seven Advanced BlokAid® units have been deployed within Melbourne Water’s stormwater drainage network and 25 of the low-cost Arduino based IoT loggers have been installed in council drainage pits within the industrial area. Flexibility through their size and functionality meant that it was safer and easier to install and redeploy as trends and result were collected, and when new areas of interest were identified.
Each Arduino sensor can monitor water depth (from which flow can be estimated), electric conductivity and temperature variations. While unusual water flow fluctuations can be caused by many legal inputs into the stormwater drainage infrastructure (e.g. water from cooling towers, wash down areas that are appropriately controlling their pollution, etc.), the quality of this water is generally such that most have low electric conductivities (as always, exceptions exist). As such, it is believed that with these three measurements, it would be possible to understand illicit inputs of pollution into stormwater networks.
Installation methods for the Arduino sensors inside the stormwater pipes were also thoroughly explored to ensure easy, quick and safe installation and maintenance (Figure 2). Importantly, ensuring that people avoided entering the stormwater drain was paramount. While all staff members are trained in confined spaces, it is a priority when confined space entry may be required that staff seek all alternative opportunities to avoid entry where possible. As such, we developed two options for installation: sandbag and a pole installation. Both options have their merits, and both allow for no entry installation and maintenance.
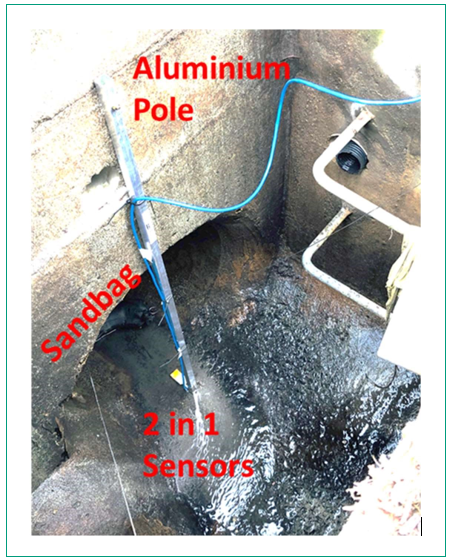
Figure 2: Arduino pole installation method to ensure cheap, quick and most importantly safe workplace.
To ensure that the data was accessible in real-time, a logging system was developed that could send data to an online server. Our logger was a simple Arduino based IoT device (Arduino coupled to a SIM card for telemetry). To save battery consumption, the interval of upload was varied depending on the activity seen in the drain by the sensor (if readings were less than 10% of the previous, then the sensor only uploaded every hour. If the readings changed by more than 10%, then the sensor uploaded data every 2 minutes). In general, the sensors would work for around 2-4 weeks without battery replacement. Newer developments have allowed the loggers to function in the same way, and can now continue to operate continuously for over 12 months on smaller battery packs.
The data is visually accessible on a website server system, which allows users from the multi stakeholder working group look at the datasets, manipulate them and interpret (Figure 3). The sever also allows users to set thresholds for each measured parameter and send texts message alerts to responders; to avoid having alerts during rainfall (when inputs are varied), it is possible to use Melbourne’s weather radar to calculate rainfall totals in the catchment and deactivate alerts during wet weather periods.
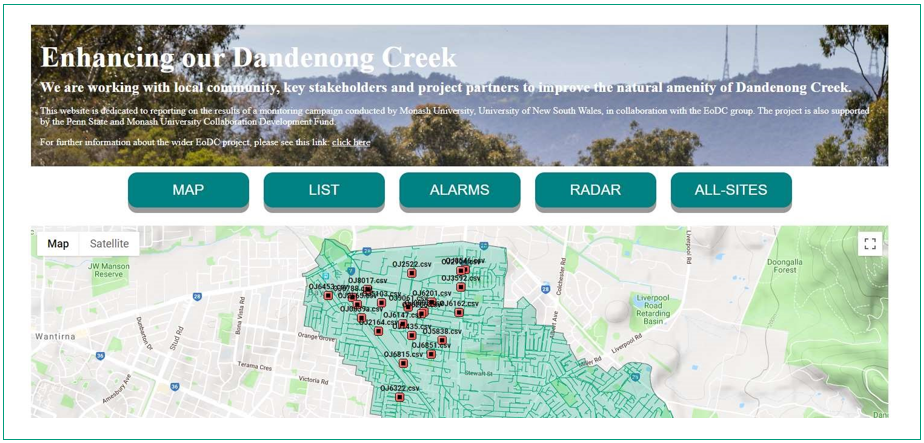
Figure 3: Webpage interface setup to view device locations, datasets and to set alarms for any unusual activity detected. Red dots indicate individual sensor location sites.
Initial outcomes from live pollution detection trial
In total, 30 Arduino sensors were built for placement in the Old Joe’s Creek catchment, and they were maintained fortnightly for about 12 months. As this was the first installation of these sensors, there were some missing datasets as sensors had to be reconfigured through time, especially with regard to the type of epoxy that was used for waterproofing and protection. Overall, approximately eight months of continuous data is available for 20 Arduino sensors.
During the monitoring period, there were a number of events detected in the stormwater drainage system. Figure 4-top shows an extract of data collected from five sensors during a dry weather period. Note the land uses for each sensor;
ORANGE sensor is capturing entirely residential land-use, GREEN sensor is capturing stormwater from industrial only and a small road area, RED sensor is capturing a catchment that contains both GREEN and ORANGE sensor areas but also some other industrial catchments.
The final two sensors (marked with X in Figure 4-top) are capturing two smaller industrial catchment areas and were installed later once it was determined that interesting signals were being detected at the RED and GREEN sites.
Figure 4-middle and Figure 4-bottom both show the results of just two-day periods where there was no detectable rainfall in the catchment in the previous three days. It is important to note the timing of the irregular peaks in flow rates that occur during working hours of each day for the catchments that contain industrial areas. While these peaks in flow could be due to industrial cooling devices or wash down areas, it is important to note that these data were taken in May, where air temperatures were such that heating would be the preference in this period of time. Furthermore, we observed unusual electric conductivity trends during some of these events, sometimes indicating very high salinities. Further work is required to understand the quality of these releases, and the future work of this project includes the development of a turbidity sensor that can detect impaired water quality.
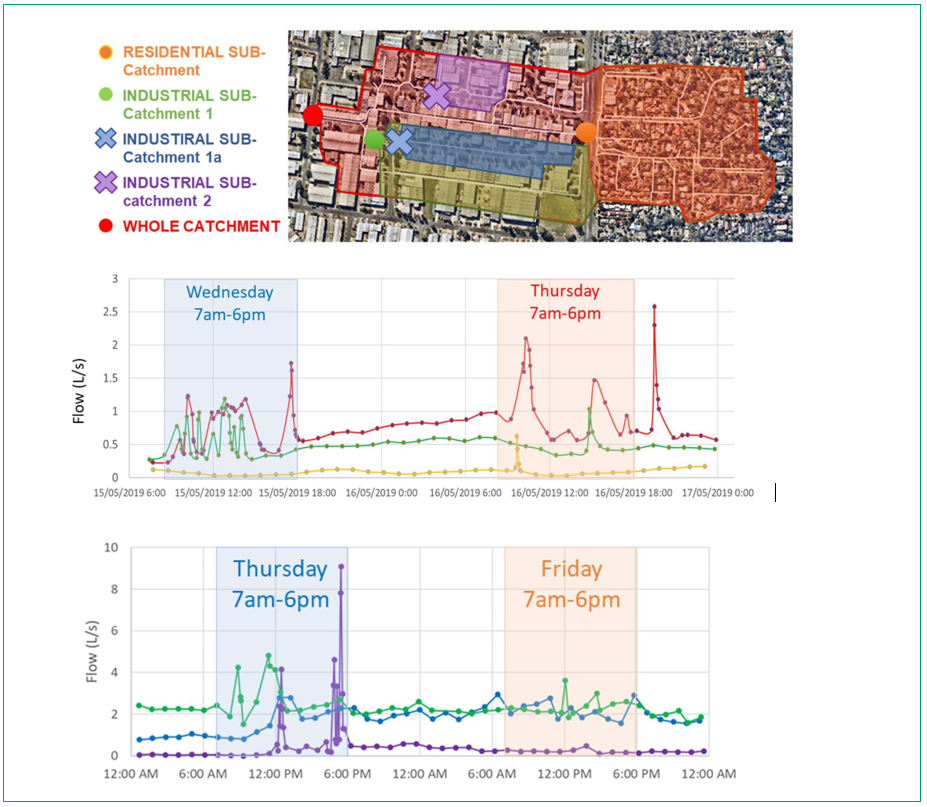
Figure 4: Top: sensor locations for the five sensors of interest. Middle: two dates of no detected rainfall in the catchment showing estimated flow rates from three catchments. Bottom: two further dates showing the trends detected in flow rates for the three smaller industrial sub-catchments.
Future works
The group is continuing to research and develop new sensors and logging systems to better understand pollution in stormwater catchments (see Figure 5 for some examples). In particular, we believe we will have improved ability to characterise impaired water quality through the use of low-cost turbidity sensors, hence we are advancing the field of turbidity sensing in water environments. Online ammonia and faecal bacterial concentration detection is also of interest to the group as they can further help to understand the source of water entering into the stormwater system. Furthermore, while measuring depth and converting this to flow using Manning’s equation and assumptions, a more accurate method is being developed that includes velocity sensing in these environments based on Doppler shifts (this includes both in pipe and out of pipe velocity sensing). Logging devices that consume less energy are required, therefore the group is investing in the development of a new NB-IOT logging device that can operate on one battery replacement for 12 months of operation. Finally, much more work is needed on the development and implementation of a framework which connects the sensors to people on the ground to respond to the detected pollution events.
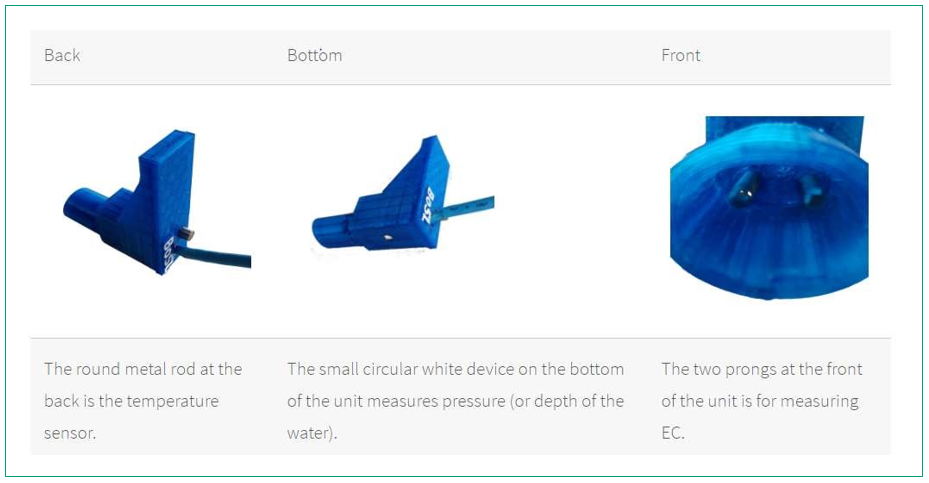
Figure 5: Future development in conjunction with Melbourne Water and Monash University highlighting the new all-in-one depth, EC and temperature probe which now has adequate shrouding on the EC sensor for more accurate measurements.
The long-term prospect is to have an automated system that alarms instantly when detecting ‘abnormal’ events, thus allowing faster crew response to identify the source and assist with the prosecution of those illegally contaminating and polluting a waterway. The success of the trial will determine the ability to expand the technology across to other industrial areas and networks that are being challenged with similar pollution issues.
These developments in new technology and the adaption of existing technology have allowed drain operation information to be transmitted in real time to identify and locate abnormalities within the system (including a pollution dumping event). Melbourne Water, Iota and Monash University have utilised these enhancements to develop a live monitoring network, enabling us to have eyes underground within problematic stormwater catchments around heavily industrial areas. By utilising low-cost sensors and Arduino based, telemetry enabled logging systems, deployed as an army throughout the stormwater networks, key information is now being transmitted to the authorities on flow, temperature, salinity, and other key parameters within the network. By overlaying real-time rainfall data, we can also determine abnormal flow events from the network, highlight their origin and determine what contaminants may be within the waste. It allows a fast response, direct action and helps to improve the health of the receiving waterway.
THE AUTHORS
Heath Baker
Heath Baker is a passionate environmental engineer with over 13 years of diverse International and Australian experience. His capabilities range from team and project management to design and implementation of major infrastructure projects, with a focus on creating outcomes which are best for communities, traditional owners, stakeholders and the environment. He is particularly passionate about coaching and developing teams and individuals and seeing them thrive.
David McCarthy
My research area is integrated water management, with specialised skills in urban hydrology, stormwater management, green water treatment technologies, city scale modelling, sensor networks and water quality processes (especially regarding pollutants of concern to human health). Much of my work focusses on the harvesting and reuse of urban stormwaters, greywaters and wastewaters.
Jason Morris
Jason Morris has more than 20 years’ experience in the Water and Waste Water industry in the fields of Instrumentation Engineering, including Project/Product and Key Customer management. Jason has become intimately involved in Packaged Pump Stations, Pressure Sewer Systems, and digital IoT water meter projects within Australia and New Zealand. This experience has been a fantastic gateway to build existing client relationships and open up new partnership opportunities. As Business Development Director of Iota Services, Jason works closely with teams within South East Water on new technology and solutions; facilitating moving innovation into real world applications, from concept to operation for our clients and partners.
Share