


Green façades irrigated with greywater in Perth’s Mediterranean climate

The use of greywater-irrigated façades could prove that green walls can survive in Mediterranean climates
DOWNLOAD THE PAPER
ABSTRACT
Green walls are gaining popularity in urban areas for offering aesthetic, shade and thermal benefits. However, with climate change and reduced rainfall, shortages of potable water makes it a restricted irrigation source. This paper investigates the viability of using locally-produced greywater as an alternative source for green wall irrigation. Pilot-scale green façades (a selective configuration of green walls) were established at Bentley Primary School, with plants rooted in stand-alone planters (2500 x 700 x 750 mm) in Perth, Australia, and irrigated with greywater. Inflow and outflow volumes from the planters were monitored from June 2019 to December 2020; water balances were established across season, plant type (non-deciduous and deciduous) and orientation (east, west and north facing). The analysis demonstrated that in cooler months (May – September) the irrigation volumes required for plant health was on average 5 mm/day Monday ‒ Friday, which increased to 7 mm/day in warmer months. The outflow was highly variable and a function of season, plant type and orientation; in cooler and warmer months it ranged from 0.5 – 4 mm/day, and 0 – 0.2 mm/day, respectively. This work illustrates that green façades irrigated by greywater are viable under Perth’s Mediterranean climate, and shows opportunities for reuse of the outflows.
Keywords: Green walls; greywater reuse; irrigation regime; Mediterranean climate.
INTRODUCTION
Water is one of the most precious resources on earth. However, high quality freshwater is becoming increasingly scarce, resulting in one of the biggest global challenges for this planet. Wang et al. (2016) predicted that in 50 years the global population would face a 40% water shortage. Increasing scarcity of potable water occurs simultaneously with elevated greenhouse gas emissions, thus promoting climate change and affecting rainfall patterns (Bates et al., 2008). Steffen et al. (2018) reported greater than 50% decline in streamflow in Australia over the last three decades due to long periods of drying climate, and that severe droughts would become more frequent, with potential impact on potable water supplies.
Despite Australia being the driest continent, it has the second highest water consumption in the industrialised world (Miller and Buys, 2008). In Western Australia, Perth’s water consumption per capita is almost double that found in eastern capitals of Australia (Wynne, 2017). Since 2008, a sharp decline in rainfall in south-western Western Australia has decreased surface water supplies and in 2020, Perth’s water supply was sourced mostly from desalination plants and groundwater (Australian Bureau of Statistics, 2010b; Water Corporation, 2021). In response to increased scarcity of potable water, the Water Corporation of Western Australia has a target of 15% reduction in water usage (Australian Bureau of Statistics, 2010a) and 45% recycling of wastewater by 2030 (Core, 2020). Despite high water consumption, a survey in 2008-09 showed that only 40% of adults in Perth practised water conservation techniques for
personal water use (Australian Bureau of Statistics, 2010a) though this has improved over the last decade (Australian Bureau of Statistics, 2019). Strategies have also been developed to utilise alternative water sources, including recycled water (Department of Health, 2010).
Recycled water can be used at small or large scale, based on its end-use and a fit-for-purpose treatment process. Water applications that do not require potable water could be sourced from non-potable recycled water (Department of Health, 2011). End-use water demand predictions are critical for planning recycled water supplies (Rathnayaka et al., 2015), as are establishing design priorities and budgets (Smakhtin, Revenga and Döll, 2004). Almost 85% of Australians households have gardens and lawns (2010a) and about 40% of potable water is used to irrigate them (Loh, 2003), which offers opportunities for recycled non-potable water use. Of the potable water used in a household, 41–91% becomes greywater (Pangarkar, Parjane and Sane, 2010; Vuppaladadiyam et al., 2019), and it is becoming an increasingly popular option for recycling and reuse (Al-Jayyousi, 2003).
The required treatment of greywater depends on its (recycled) end-use; constructed wetlands have been used to treat greywater however they require significant space in an urban environment. Vertically grown vegetation or green walls have much smaller space requirements and are suitable for dense urban areas (Fernández-Cañero, Pérez Urrestarazu and Perini, 2018); they could potentially be irrigated with greywater and therefore act as decentralised vegetated treatment infrastructure. The discharge from greywater-irrigated green walls could be used as an alternative water sources for toilet flushing and further irrigation of surrounding landscapes (Prodanovic et al., 2017). Green walls improve aesthetics, provide local thermal comfort, reduce the urban heat island effect and improve energy efficiency, improve urban air quality and biodiversity, reduce noise and increase property value (Giordano et al., 2017).
Increasing urban densities combined with Perth’s Mediterranean climate, has led to concern over the urban heat island effect (Mohajerani, Bakaric and Jeffrey-Bailey, 2017). Locally, the Bentley Regeneration Project is a significant infill land development program sponsored by The Department of Communities and the City of Canning (Duckham, 2015) and is exploring the use of green walls to offer environmental benefits, mitigate the urban heat island effect, promote greenery, and provide shade and amenity to residents. In addition, the use of locally produced greywater for irrigation of the green walls and reduced dependency on potable water become an important aspect for investigation (Duckham, 2015). The project also explores the performance of the green walls without provision of any saturated media layer, as previous research demonstrated that the maintenance of saturated media during summer conditions in a Mediterranean and semi-arid climate was not critical for high nutrient attenuation in biofilters with native plant (Ocampo, Rennie and Oldham, 2017). A greater understanding was needed of the nexus between greywater use and provision of thermal benefit, and the potential for producing a fit-for-purpose non-potable water supply.
Although green walls have existed for millennia to provide shade and thermal comfort in drier climates, there is a relatively little research on their water use in arid, semi-arid or Mediterranean climates, or on their ability to purify water (Masi et al., 2016). Green walls incorporate a range of vegetated wall systems, e.g. green façades, living walls and bio-walls (Nagle, Echols and Tamminga, 2017), however, green façades were deployed in our pilot project, to ensure compliance with Department of Health guidelines on the reuse of greywater. We note that, while we have been studying the water use, water quality and thermal performance of the green façades in our research, this paper will only address the water use performance. Therefore, this paper aimed to demonstrate the water requirements of the green façades across seasons, and explore the effect of façade orientation and plant type (deciduous and non-deciduous) on greywater volume requirements.
MATERIALS AND METHODS
Study site
Bentley Primary School (BPS) was selected as the site for deployment of the green façades through a collaboration between the Department of Communities and the Department of Education. BPS is located about 8 km south-east from Perth city centre and 1.5 km north of the Canning River. In summer, Perth experiences an average maximum temperature of 31.6⁰C, and an average areal evapotranspiration rate of 3 mm/day; in winter the average minimum temperature is 7.9⁰C and the average areal evapotranspiration rate is 1.3 mm/day with 90% of the annual rainfall occurring between May to October (Australian Bureau of Meteorology, 2020).
The greywater used for irrigating the green façades was generated from hand basins in the senior student bathroom and from nearby drinking water fountains (Figure 1). The greywater was discharged into an underground lined pit (polypit) to minimise human contact, where it was stored until pumped to the façades by a commercial-scale grey water pump, GreyFlow ProTM (GFPRO).
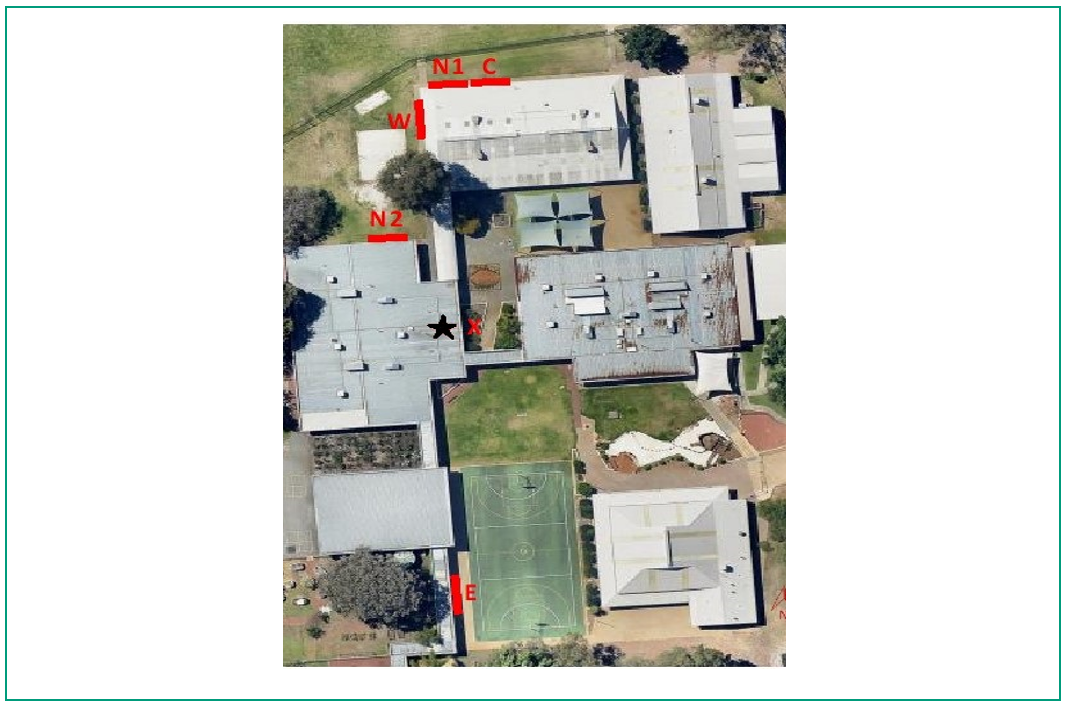
Figure 1: Bentley Primary School study site. The black star shows the location of the toilet block. The ‘x’ indicates the location of the GreyFlow Pro. The location of the green façades with different orientations, are shown as red bars (Nearmap, 2018).
Green façade design
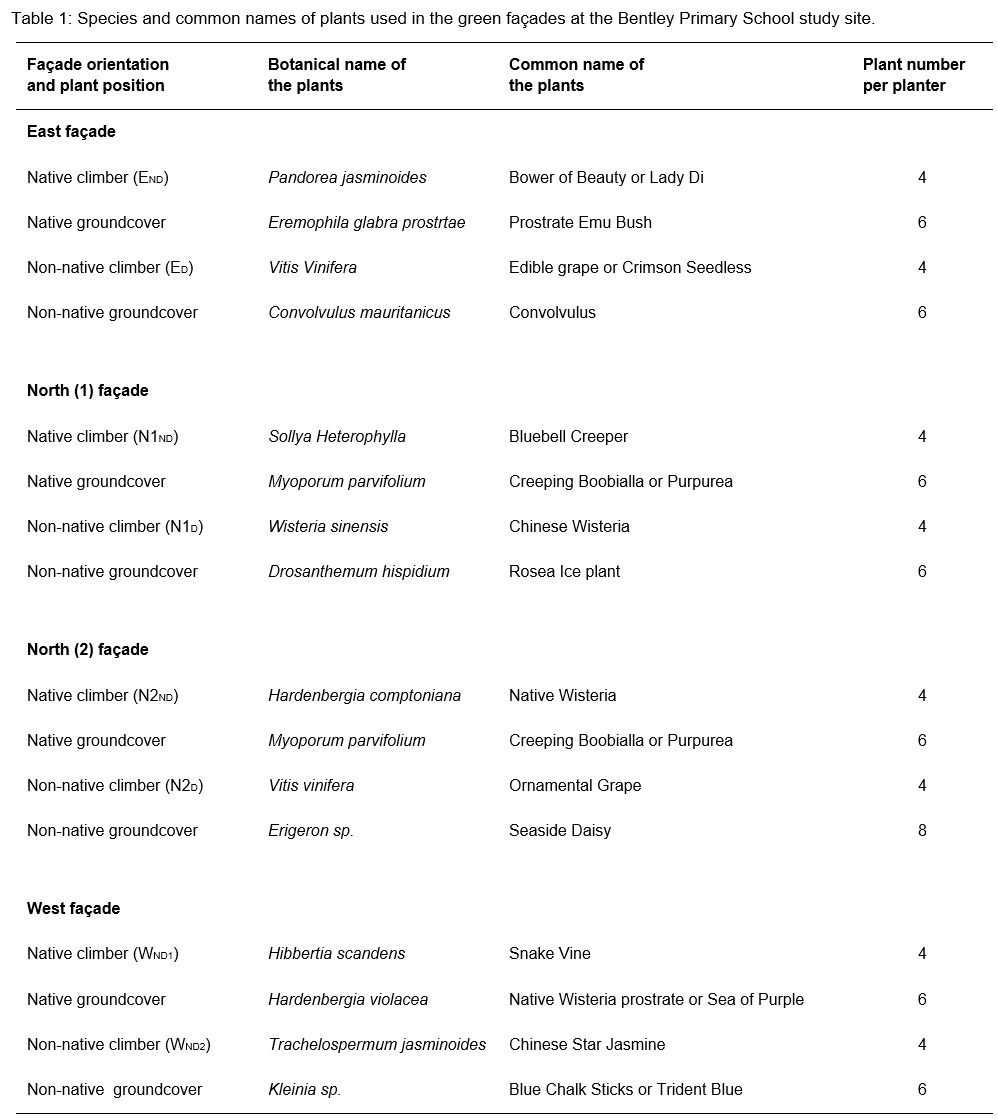
Green façades were established in three orientations, facing east (E), west (W) and north (N1, N2) (Figure 1), to explore differences in water requirements under different sunlight hours and wind exposures. The plants were rooted in corten planters (2500 x 700 x 750 mm), two planters were installed at each orientation and each planter installed with a 2500 x 1100 mm frame to support the green façade. One species of climbing plant and one species of groundcover were used in each planter, and several plants of each species were grown (Table 1). To test a range of species across the different planters, one planter at a given orientation used a deciduous climbing species and the other planter used non-deciduous species1. All the groundcovers were non-deciduous. A control pair of planters (C in Figure 1) under a north-facing orientation contained media only (no plants).
Selection and installation of media
Gingin loam was used as the growth filter media in the planters as Seah (2011) has shown it had excellent nutrient removal performance, was available locally and had a saturated hydraulic conductivity (Ks=27.3 cm/hr) that was appropriate to facilitate water uptake by the plants. Implementation of green walls where Gingin loam is not available would require testing to identify optimal local media for plant growth and water conductivity. Four layers of media (protective, filter, drainage, and transition) were implemented (Figure 2), following recommendations for the construction of greywater irrigated green façades (Payne et al., 2015). The baseline pH (7.3), electrical conductivity (0.6 mS/cm), organic matter content (5%), soil porosity (40%) and field capacity (27%) of the growth filter media were measured before placing it in the planter. Sub-surface drippers were selected for irrigation, as required for greywater irrigation (Department of Health, 2010), and connected to the GFPRO distribution pump via a sub-surface inflow pipe (Figure 2). Outflow pipes were installed in the bottom of the planters to collect drainage water from each module, before joining into a single pipe discharging into a soakwell, where the flow rate was monitored.
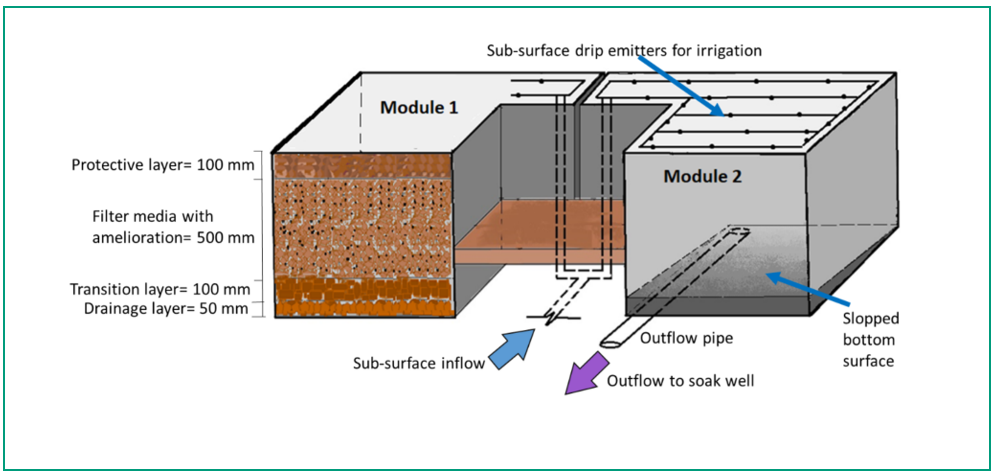
Figure 2: Schematic of the planter showing the different growth and drainage layers (in Module 1) and irrigation mechanism (in Module 2).
Water flow monitoring
Inflows
Once the greywater in the polypit accumulated and triggered the top float of the GFPRO, it was distributed to all green façades. To monitor volumes of water flowing in and then discharging from the polypit, a vented pressure sensor with logger (Solinst AquaVentTM 3500) was installed inside the polypit. An ultrasonic flow meter (FLUXUSTM F601) was used to establish the partitioning of pumped greywater to each planter and therefore quantify the planter inflow (irrigation) volumes.
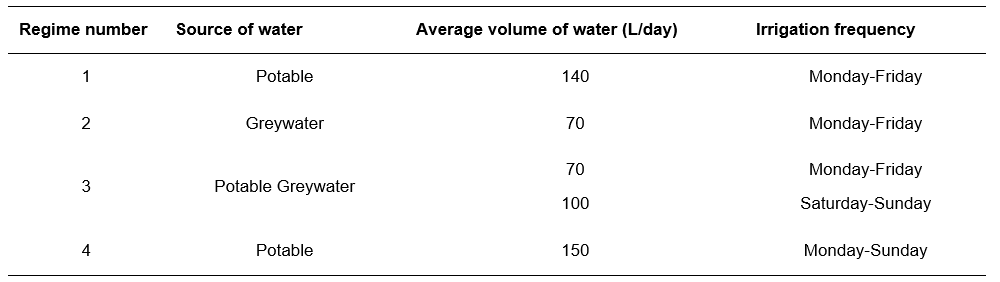
The plants were initially established under higher volumes of daily potable water irrigation; these volumes were slowly reduced to bring irrigation rates in line with what was expected under greywater irrigation. Moreover, irrigation rates were adjusted in warmer months by providing additional potable water to maintain sustainable plant growth and health. As a result, there were different irrigation regimes, which were defined by daily volumes and source of irrigation water (Table 2). During school holidays, greywater was not produced in the senior student bathroom, and therefore potable water was used for irrigation, but at similar irrigation rates as delivered during greywater supply.
Table 2: Irrigation regime details for Bentley Primary School study site.
Outflows
Outflow monitoring devices were designed and installed in the soakwells (Figure 3 a-c); the highly variable outflow volumes required the construction of specialised devices using tipping buckets from rainfall gauges. The number of tips were recorded by the logger and the volume was calculated.
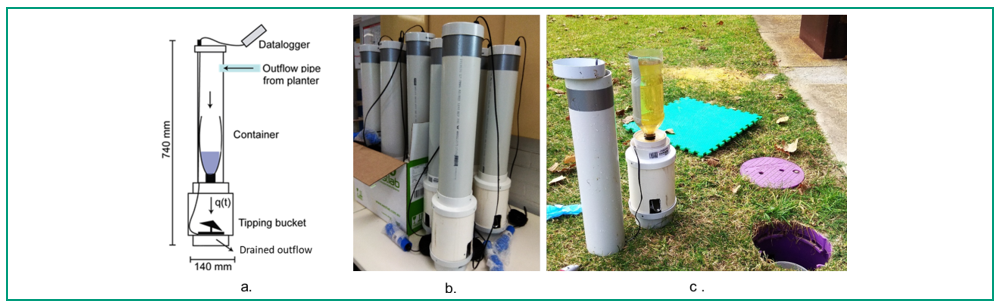
Figure 3: Schematic (a) and photographs (b and c) of the devices constructed to monitor outflow volumes at the Bentley Primary School study site.
Soil water content
Soil water content could be highly variable throughout the soil profile, and was monitored with an array of moisture sensors (ECH2OTM EC-5) and data logger (Em5b). Prior to deployment, each moisture sensor was calibrated for Gingin loam by converting mV output from the sensor to corresponding volumetric water content (estimated from the gravimetric water content and bulk density) (METER Group Inc., 2017). Four sensors were deployed vertically (50, 150, 250, 350 mm media depth) using a perforated PVC pipe (100 mm diameter) that was inserted into the soil. The soil from inside the pipe was removed and moisture sensors were inserted into the holes in the PVC pipes. The soil moisture sensors were deployed in one planter at a time (Figure 4) and data were recorded every hour. The volumetric water content measured with each sensor was first multiplied with surface area of the planter (2500 x 700 mm) and the corresponding depth of soil media where it was deployed and then finally summing up the data from four sensors to estimate the total volume of soil water (L) in a planter.
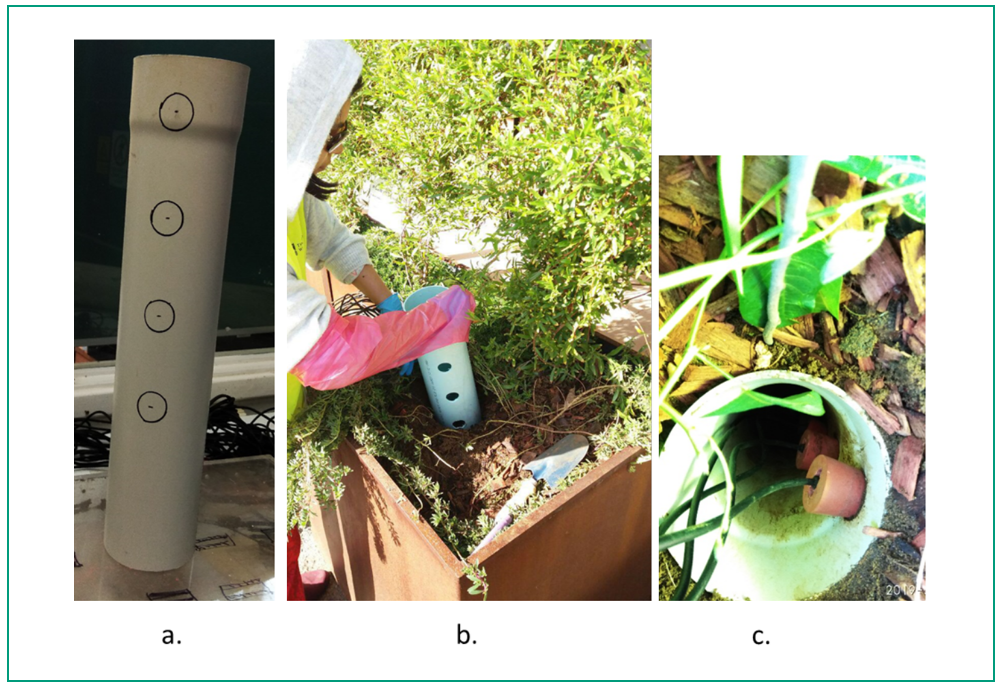
Figure 4: a) PVC moisture column ready to drill, b) PVC pipe inserted into media and c) moisture sensors inserted through the walls of the pipe at the Bentley Primary School study site.
Estimation of evapotranspiration from the planters
Quantifying planter inflows (I), outflows (O) and stored soil water (S), allowed estimation of cumulative water loss from the planter via evapotranspiration (ET) by using a water balance equation:

where i is day number, with a duration of n days. As the system was irrigated via sub-surface drippers, plant evaporation was considered minimal, and ET was dominated by soil evaporation and plant transpiration. An average daily ET could also be estimated. Cumulative ET indicated how water was seasonally used in the planter, and highlighted differences across planter orientation, plant species and irrigation regimes.
We note that the volume of rain intercepted by different planters could not be quantified due to different wind direction towards planter orientations and variable thickness of the groundcovers, and so periods of rainfall were not included in subsequent estimation of evapotranspiration.
RESULTS
Irrigation rates
Greywater supply to the green façades was started on 6 June 2019, and produced an irrigation rate of about 5 mm/day, Monday–Friday, as no greywater was produced on Saturdays and Sundays. During cooler months, the greywater volumes were in excess of plant needs, as indicated by measured outflow from the green façades, and the robust health of the plants. However, as mean maximum daily temperatures started to increase above 25⁰ C (and 09:00 air humidity decreased below 70%) (Bureau of Meteorology, 2020), plant health started declining. The soil water data showed a reduction in average soil water which indicated additional irrigation was required. To ensure continued plant survival, potable water irrigation was commenced on Saturdays and Sundays (via a domestic irrigation control system), in addition to the five (school) days of greywater irrigation. We note that the student bathroom that sourced the greywater did not have showers, and thus greywater production at the school was lower than expected from a domestic household.
Figure 5 shows that on school days, accumulation of greywater inside the polypit started around 10 am in the morning as the students began to use toilets and drinking fountains, and continued until 4 pm in the afternoon. The accumulated greywater was pumped out to the planters at 4 am the following day. Figure 5 shows that at 5 am on the same day (Saturday), potable water irrigation was provided for four minutes.
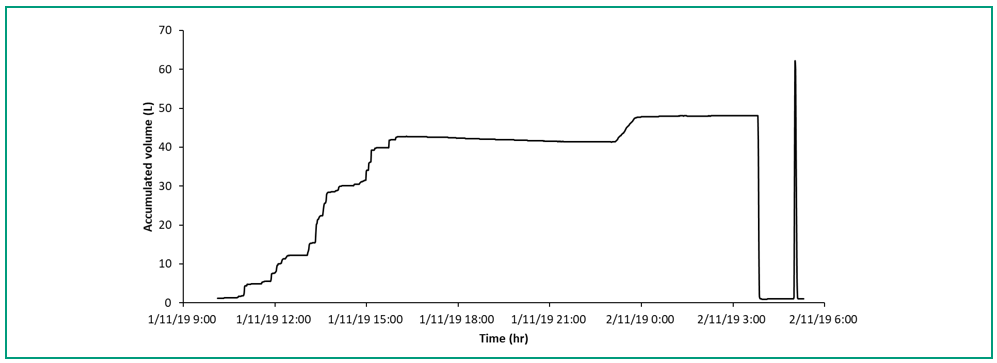
Figure 5: The accumulation of greywater (November 1) and potable water (November 2) inside the polypit under irrigation regime 3 at the Bentley Primary School study site. The greywater accumulated and was pumped out within 24 hours of initial filling, while potable water was supplied at a rate that triggered the top float and was therefore pumped out over 7 minutes.
In regime 3, variability in irrigation volume was observed, whether it was greywater or potable water (Figure 6). The variability in greywater supply was likely caused by changes in frequency in hand washing and drinking from the water fountains. Multiple consecutive pump events sometimes took place on one day, as a result of inflow firstly being triggered by the float valve in the polypit, and secondly by the 24-hour automatic emptying mechanism. The variability in potable water likely occurred due to the pressure fluctuations in the scheme water distribution line.
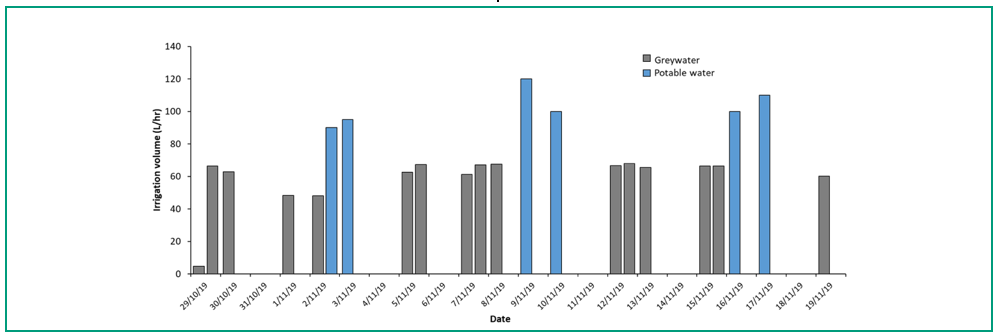
Figure 6: Irrigation volume in regime 3 at the Bentley Primary School study site. The grey and blue bars represent greywater and potable water irrigation, respectively. Several irrigation events or none, could happen on a single day, depending on greywater production.
Outflows from planters
The volume of outflow per hour, across all planters, is shown in Figure 7, for a two week period in July 2019. After each pumping event, the volume of outflow increased to a peak then reduced with time until the next irrigation event took place. Outflows displayed differences between non-deciduous and deciduous climbing plants for most façade orientations. Minimal outflow was observed from planters using non-deciduous climbers (barely visible solid lines in Figure 7), while significant flow was observed from planters using deciduous climbers (dotted line, Figure 7), indicating that that the non-deciduous climbers consumed more water.
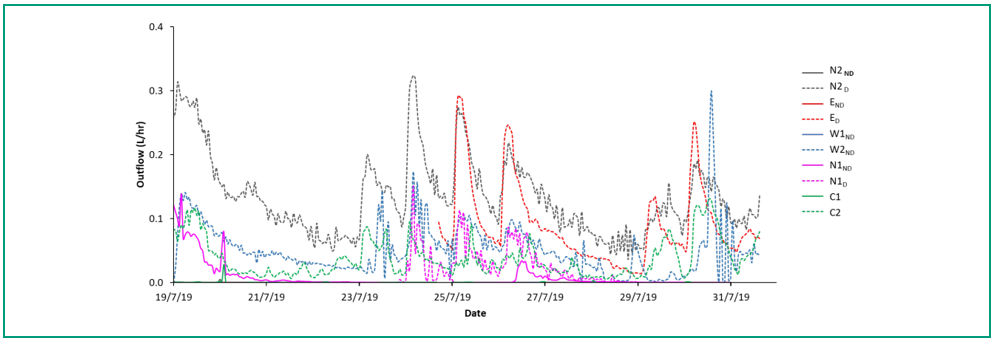
Figure 7: Outflow from the different green façades at the Bentley Primary School study site. The line colour indicates façades of different orientation (E, W, N1, N2) and the subscript indicates whether they contained deciduous (D) or non-deciduous (ND) climbers. C1 and C2 are the control planters containing growth media only (no plants).
Irrigation events in N1ND (Figure 8a) produced cyclical wetting and drying of the soil (Figure 8b), as measured by the soil moisture sensors. Figure 8 shows that N1ND received irrigation from 19–23 and 26–30 May 2019 (Monday to Friday), while 17, 18, 24, and 25 May corresponded to Saturdays and Sundays with no irrigation. On 20 and 31 May, two soil water peaks coincided with consecutive multiple pump events, as indicated in the top panel (Figure 8a). The average soil water for N1ND across these 14 days was around 62 Litres after drainage (i.e. at field capacity).
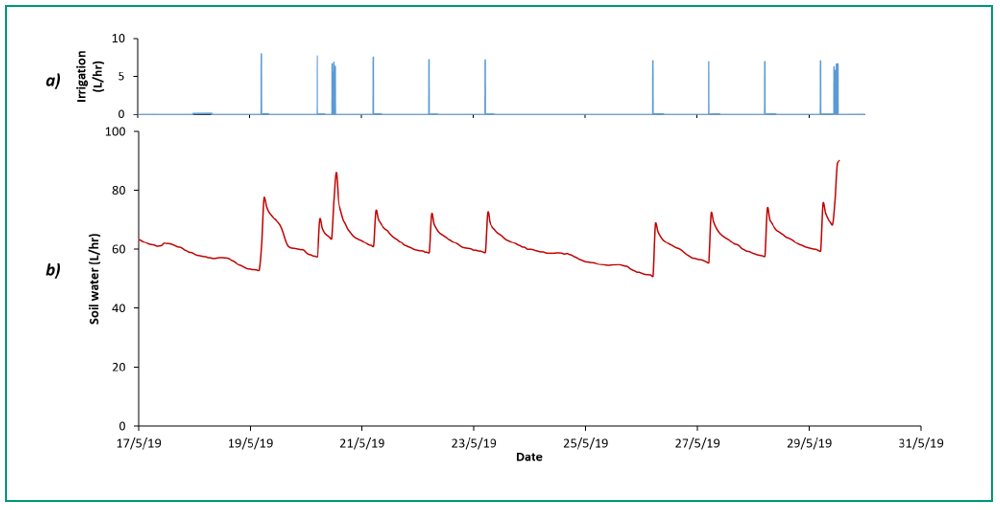
Figure 8: Irrigation rates in planter N1ND (a), produced corresponding responses in soil water (b).
Plant water use
Cumulative “water storage” in the planters was estimated by using Equation 1 above (i.e. inflows minus outflows). An example of cumulative water storage in planter END during 6 months of 2019, is shown in Figure 9, which indicates a continued increase with time, with small scale increases caused by irrigation events. The soil moisture sensors were sequentially deployed across the 10 green façades, and interpolated soil water between deployments in END demonstrated a gradual decline in soil water as the daytime air temperatures increased (Figure 9). It is evident that soil water made up a very small component of the cumulative water storage, the majority being used by plants.
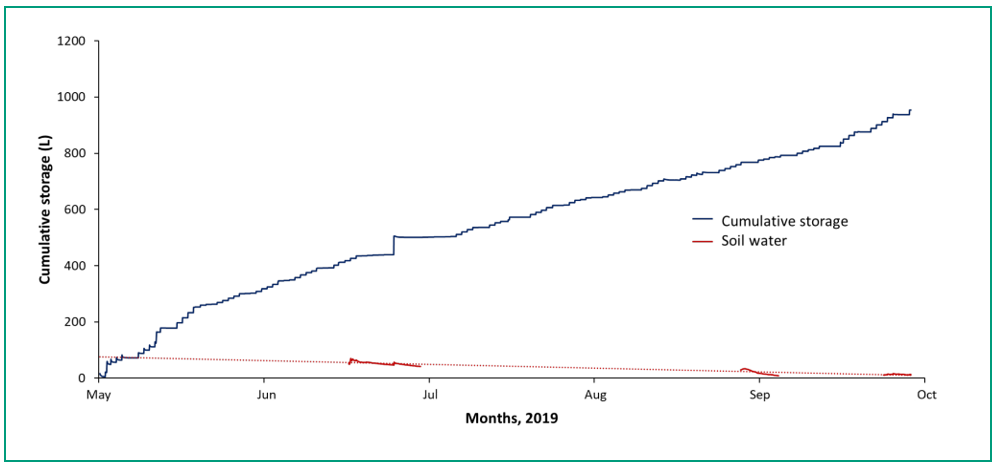
Figure 9: Cumulative water storage in planter END. The red solid lines measured soil water, the dotted red line indicates interpolated soil water between monitoring periods.
DISCUSSION
Temporal variability of outflows
The outflow was sensitive to irrigation rates and frequencies, and therefore responded to the different irrigation regimes. Figure 10 shows the outflow responses to the four irrigation regimes from planter N1ND. In regime 1, the rate of outflow peaked at 5 L per hour in response to high irrigation volumes. Frequent high outflows were observed at the beginning of regime 2, due to intercepted rainfall. Outflow rates and frequencies were reduced under regime 3 as the rainfall ceased, the warmer season approached and plant water use increased. Under regime 4, the façade outflows increased again as a result of high irrigation volumes deliberately delivered the hot summer months.
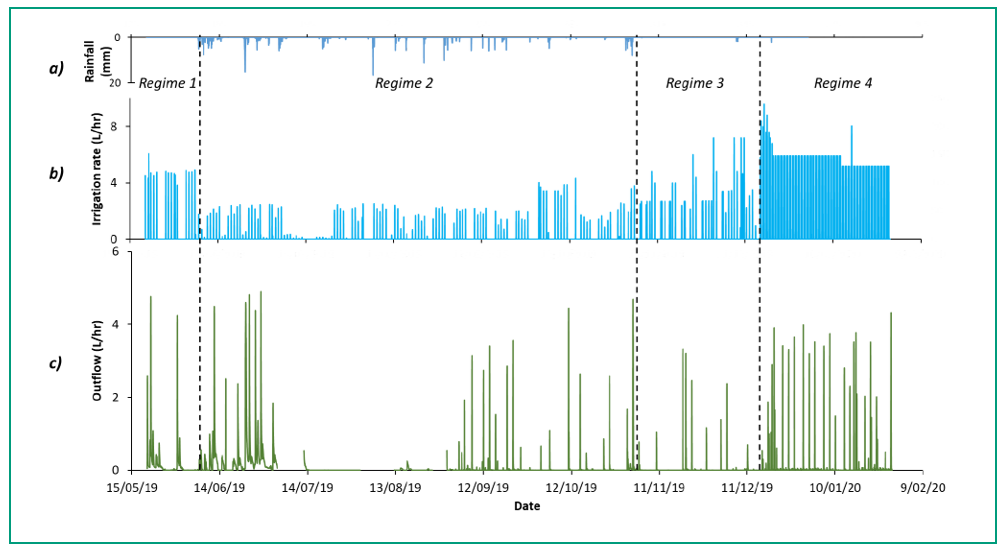
Figure 10: Rain events (a) and changing irrigation regimes (b) created variable outflows from planter N1ND (c).
The growth media was selected for its appropriate drainage characteristics that allowed excess water to drain from the planter after irrigation. A higher rate of irrigation was specifically applied under regime 4, to determine the outflow responses and plant water use. The cumulative water storage for all green façades was calculated from 20 May 2019 to 31 December 2019 (Figure 11) and differences in water use between non-deciduous climbers and deciduous climbers, was observed across this period. In most planters, the soil water steadily declined over the period.
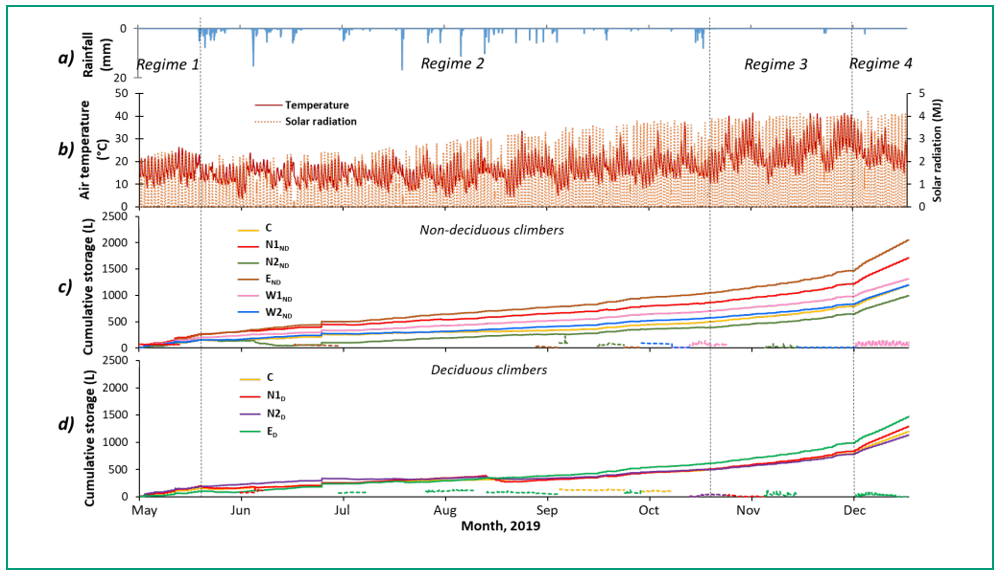
Figure 11: The controls on plant water use at the Bentley Primary School study site include a) rainfall, b) air temperature and solar radiation. The plant water use is indicated by the slope of cumulative storage, and we could compare planters with c) non-deciduous climbers and d) deciduous climbers. The coloured lines indicate orientation of planters, with the yellow lines indicating the control planter (no plants) where water loss would only be due to soil evaporation.
Temporal variability of plant water use
The average water use of façades with deciduous climbers was around half of that of façades with non-deciduous climbers (Figure 11c and d). The estimated net storage or evapotranspiration (ET) of the green façades for different regimes is presented in Table 2. Across the winter months, the water use from deciduous climbers was lower than water use by non-deciduous climbers. However, under regime 3, as the weather became warmer during spring, leaves appeared on deciduous climbers, and water use increased across all planters. During the hot summer, plant water use clearly responded to increased water supply as we transitioned between irrigation regimes 3 and 4. Beikircher & Mayr (2017) found that the hydraulic (water use) function of deciduous plant species was gradually restored as the soil temperature increased in spring. Studies also found that increased daylight hours (photoperiod) and elevated ambient temperatures triggered some adaptive traits of deciduous plants that recognise seasonal shifts in spring and may also increase the plant water use (Balasubramanian et al., 2006; Song et al., 2015).
Table 2: Average plant water use under different irrigation regimes at the Bentley Primary School study site. ET denotes evapotranspiration, which in the Control planters is only soil evaporation.
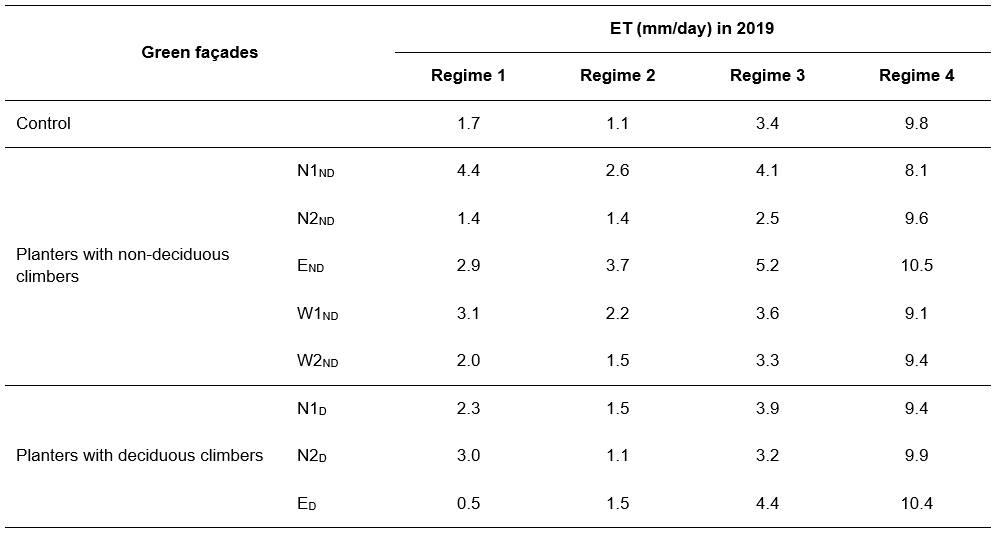
During the 2019 cooler months, when the average maximum air temperature remained below 25⁰C and 09:00 air humidity remained around 70% (May–September), an irrigation volume of 5 mm/day for five days a week was sufficient for the plants. As air temperature increased, an irrigation rate of 7 mm/day irrigation rate was required for good plant health. During the summer, under regime 4, irrigation rates of higher than 10 mm/day were applied. As irrigation rates increased, the plant water use increased (Table 2). With an excessive irrigation rate, not only did the ET increase in regime 4, but so did the outflow (Figure 10). These results demonstrated the average water use of the green façades increased in summer to 9.6 mm/day, when the irrigation source was not greywater limited.
Average monthly rates of evapotranspiration were calculated in 2020, and highlighted again the higher plant water use during summer months and lower water use during the cooler winter months. The differences in water use between deciduous and non-deciduous climbers is also apparent; deciduous climbers exhibit much lower water use during early winter months when they have lost their leaves, but mild temperatures continue to drive water use in non-deciduous climbers (Figure 12). Interestingly, during the summer months the control planter (containing only media) sometimes had higher water use than the green façades, most likely due to high soil evaporation rates.
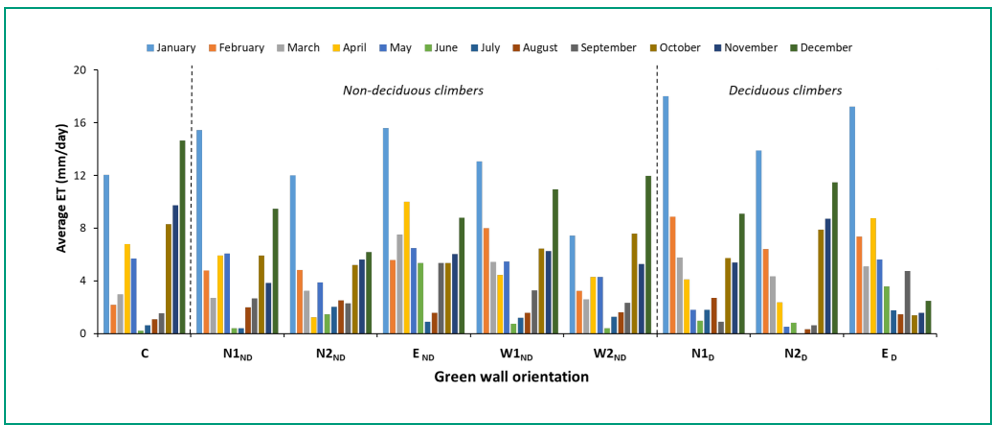
Figure 12: Monthly variation in average daily evapotranspiration in 2020 at the Bentley Primary School study site. An average gradual decline was observed from January to June and which gradually increased until December for most green façades.
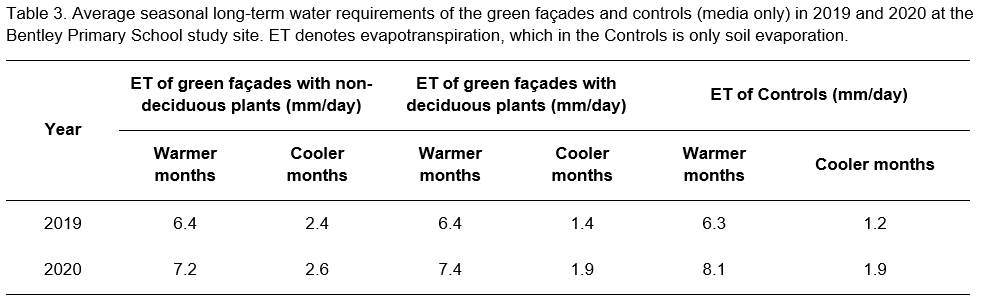
The annual seasonal evapotranspiration, or plant water use, increased between 2019 and 2020 (Table 3). As the plants grew and matured, they consumed more water. This aligns with previous findings by Zegada-Lizarazu et al. (2012) that higher leaf area increased water demand of the plant and photosynthetic rates. Concomitant higher root growth extracts more water from the soil, thus might promote water use by the plants. Qiu et al. (2008) and Xue et al. (2006) reported higher evapotranspiration rate as a result of higher irrigation volumes, and this also matches our findings. During Covid-19 lockdown and school closures in 2020 (March–May), greywater supply was minimal and the system was irrigated with more regular (potable) water than was typical under greywater irrigation. Once the school resumed, increased hand washing caused higher greywater production and therefore high rates of irrigation. We therefore expect the higher water use in 2020 to be a result of both maturity of the plants and increased water availability.
Bare soil evaporation measured in the control planters was about 50–85% of plant water use in 2019, and 70–90% of plant water use in 2020. A comparison of bare soil evaporation with plant water use is problematic due to the use of groundcovers alongside the climbing plants. Some of the planters experienced thick groundcovers, where in the warmer months soil water may evaporate and produce high humidity underneath the groundcovers. This atmospheric moisture trapped by the groundcover would only be released if the groundcover was disturbed, e.g. by wind.
The green façade pilot study has continued in 2021, and recent data is consistent with the trends observed in 2019 and 2020. Most plant species that we used in our system have demonstrated vigorous growth over the three years and the climbers covered the frames by the second year of establishment (except for Sollya Heterophylla that needed replacement due to ant infestation). To ensure consistent conditions for our study, the coverage of the climbers was maintained to the frame area by regular pruning of the plants. The relative impact on cooling of shade versus evapotranspiration is outside the scope of this article, and will be presented in subsequent articles.
We note that no additional fertiliser was applied in the three years since establishment due to ongoing assessment of water quality treatment by the façades; the water quality performance assessment is outside the scope of this article and thus will be presented elsewhere. In brief, we regularly sampled inflows and outflows and analysed for water quality improvement (nutrients and metals). We also confirmed that the soil salinity was within the recommended threshold for healthy plant growth. We note that the greywater used in our system was ‘light and cleaner’ (electrical conductivity 0.1 – 0.5 mS/cm) in nature compared to residential greywater (electrical conductivity 0.3 – 1.9 mS/cm) (Van Dok, 2013) and the additional potable water irrigation during the warmer season and rainwater might flush out some salt deposits.
The plants in the east-facing green façades used more water than other planters throughout the study period, and the temperature of the corten planter boxes at times reached > 55⁰C. The plants were noticeably stressed and plant growth was inhibited. During the first summer, the planter boxes were wrapped in shade cloth and plant health improved. This suggests that partial shading of east-facing planters is needed in summer to optimise plant health, particularly in Mediterranean and arid areas. This finding is supported by Montero et al. (2014) who found that solar
exposure and orientation of a green walls impacted their water demand and some orientations may require higher irrigation rates. The east-facing planter also experienced longer solar irradiance and this likely contributed to its higher water use.
The differences in plant water use between deciduous and non-deciduous climbers highlights that the choice of plant species should be guided by the desired outcomes from the green façades. If minimal outflow is desired throughout the year, to constrain discharge of greywater to sewer or soakwell, then non-deciduous plants provide the most consistent water use. However, deciduous plants may allow greater penetration of solar radiation during winter, particularly on north-facing orientations and this must also be considered during façade design. If the facades were being used to polish greywater for re-use in the household, minimal plant water usage would be the objective and deciduous plants would be the preferred choice. We note however that more outflow occurred in cooler and wetter months when there would be less demand for an alternative water source in the household. The outflow volumes are also a function of greywater irrigation volumes and Rathnayaka et al. (2015) showed that the generation of domestic greywater (specifically from the shower) was seasonal. Over summer, shower durations reduced but increased in frequency, while in winter there are few showers of longer duration.
The greywater outflow from the façades could be reused depending on an associated risk-assessment. For example, applying grey water to horticultural plants and wood lots via sub-surface greywater irrigation is considered a ‘low and extra-low exposure risk’ in Western Australia (Department of Health, 2010). A gravity-fed system for discharged greywater could irrigate turf grass or big trees with minimal cost. The broad-scale use of outflows from the green façades could transform them from being viewed as water consumers to water producers (Prodanovic et al., 2017). Careful analysis of risks associated with greywater irrigation would be required for appropriate approval from the relevant authorities.
CONCLUSIONS
We have demonstrated that green façades irrigated with greywater can thrive across north, west and east-facing orientations. We have quantified the plant water use, and demonstrated that the water use increases with increased irrigation rates and as the plants matured. We have shown that in cooler seasons (May–September in Perth), when average maximum air temperature < 25⁰C and 09:00 relative air humidity > 70%, daily greywater irrigation of 5 mm/day for five days a week was sufficient for healthy plant growth. This increased to 7 mm/day during the summer. Under these irrigation rates, average outflow ranged from 0.5 to 4 mm/day in the cooler months, and declined to a range of 0 to 0.2 mm/day in the warmer months. Changes in plant water use was also quantified across seasons, for both non-deciduous and deciduous plant species. The daily average evapotranspiration for green façades with non-deciduous climbers was 2.4 mm/day in cooler months that increased to 6.4 mm/day in warmer months. Green façades with deciduous climbers used 1.4 mm/day of water in cooler months and 6.4 mm/day of water in warmer months. With increased irrigation volumes in 2020, the evapotranspiration increased on average by 1–2 mm/day. We demonstrated that greywater irrigated green façades could be viable under Perth’s Mediterranean climate with prolonged hot and dry summers and wet winters, by selecting suitable soil media and plant species. We also showed that, with higher available irrigation rates, both outflow and plant water use increased thus creating opportunities for reuse of outflow. The choice of deciduous or non-deciduous plants should be guided by the desired outflow volumes, along with other design criteria not associated with greywater treatment.
ACKNOWLEDGEMENTS
This research was supported via Cooperative Research Centre of Water Sensitive Cities Regional Project 6-3. Financial support was provided by the Department of Communities, the Water Corporation of Western Australia, and the Department of Water and Environmental Regulation. The design of the façades was approved by the Department of Health and the Department of Education. The first author was funded by the CFH & EA Jenkins Postgraduate Research Scholarship for her PhD. We thank Andrew van der Ven and Reza Bakhshoodeh for their support in the field, and Jude Coldicutt and Richard Coldicutt from Zariba Landscapes for designing the planters.
REFERENCES
Al-Jayyousi, O. R. (2003) ‘Greywater reuse: towards sustainable water management’, Desalination, 156(1), pp. 181–192. doi: https://doi.org/10.1016/S0011-9164(03)00340-0.
Australian Bureau of Meteorology (2020) Climate data online. Available at: http://www.bom.gov.au/climate/data/index.shtml (Accessed: 19 February 2020).
Australian Bureau of Statistics (2010a) ‘1367.5 - Western Australian Statistical Indicators, 2010’. Available at: https://www.abs.gov.au/ausstats/abs@.nsf/Latestproducts/1367.5Feature Article82010?opendocument&tabname=Summary&prodno=1367.5&issue=2010&num=&view= (Accessed: 25 February 2020).
Australian Bureau of Statistics (2010b) Australia’s Environment: Issues and Trends, Jan 2010. Available at: https://www.abs.gov.au/ausstats/abs@.nsf/mf/4613.0 (Accessed: 25 February 2020).
Australian Bureau of Statistics (2019) 4610.0 - Water Account, Australia, 2016-17. Available at: https://www.abs.gov.au/AUSSTATS/abs@.nsf/Lookup/4610.0Main+Features22016-17#:~:text=Households spent %2410.6 billion on,%25 increase in 2016-17. (Accessed: 1 June 2021).
Balasubramanian, S. et al. (2006) ‘Potent Induction of Arabidopsis thaliana Flowering by Elevated Growth Temperature’, PLOS Genetics. Public Library of Science, 2(7), p. e106. Available at: https://doi.org/10.1371/journal.pgen.0020106.
Bates, B. C. et al. (2008) Climate Change and Water. Technical Paper of the Intergovernmental Panel on Climate Change. IPCC Secretariat, Geneva. doi: 10.1029/90EO00112.
Beikircher, B. and Mayr, S. (2017) ‘Annual patterns of xylem embolism in high-yield apple cultivars’, Functional Plant Biology, 44, pp. 587–596. doi: http://dx.doi.org/10.1071/FP16048.
Bureau of Meteorology (2020) Daily maximum temperature, Australian Government.
Core, L. N. (2020) Perth’s fresh water thinking for urban water security. Available at: https://blogs.worldbank.org/water/perths-fresh-water-thinking-urban-water-security (Accessed: 1 June 2021).
Department of Health (2010) Code of Practice for the Reuse of Greywater in Western Australia. doi: 10.1017/CBO9781107415324.004.
Department of Health (2011) Guidelines for the non-potable uses of recycled water in Western Australia. Government of Western Australia. Available at: http://www.public.health.wa.gov.au/cproot/2280/2/Guidelines for the Non-potable Uses of Recycled Water in WA_120528.pdf.
Van Dok, W. (2013) Effective and Responsible Grey Water Irrigation.
Duckham, R. (2015) Bentley Regeneration Project Local Structure Plan.
Fernández-Cañero, R., Pérez Urrestarazu, L. and Perini, K. (2018) ‘Vertical greening systems: Classifications, plant species, substrates’, in Nature Based Strategies for Urban and Building Sustainability, pp. 45–54. doi: 10.1016/B978-0-12-812150-4.00004-5.
Giordano, R. et al. (2017) ‘Living Wall Systems: A Technical Standard Proposal’, Energy Procedia. The Author(s), 111(September 2016), pp. 298–307. doi: 10.1016/j.egypro.2017.03.093.
Loh, M. (2003) Domestic water use study : in Perth, Western Australia, 1998-2001 / Michael Loh, Peter Coghlan. Edited by P. Coghlan and W. A. W. Corporation. [West Leederville, W.A.]: Water Corporation.
Masi, F. et al. (2016) ‘Green walls for greywater treatment and recycling in dense urban areas: A case-study in Pune’, Journal of Water Sanitation and Hygiene for Development, 6(2), pp. 342–347. doi: 10.2166/washdev.2016.019.
METER Group Inc. (2017) Soil-specific calibrations for METER soil moisture sensors. Available at: https://www.metergroup.com/environment/articles/method-a-soil-specific-calibrations-for-meter-soil-moisture-sensors/ (Accessed: 1 December 2018).
Miller, E. and Buys, L. (2008) ‘The impact of social capital on residential water-affecting behaviors in a drought-prone Australian community’, Society and Natural Resources, 21(3), pp. 244–257. doi: 10.1080/08941920701818258.
Mohajerani, A., Bakaric, J. and Jeffrey-Bailey, T. (2017) ‘The urban heat island effect, its causes, and mitigation, with reference to the thermal properties of asphalt concrete’, Journal of Environmental Management, 197, pp. 522–538. doi: https://doi.org/10.1016/j.jenvman.2017.03.095.
Montero, J. L. et al. (2014) ‘Comportamiento de especies mediterráneas en cubiertas ajardinadas con uso de aguas jabonosas (Behavior of Mediterranean species on green roofs with the use of soapy water)’, in Sciences, S. S. of H. (ed.) VI Iberian Conference on Ornamental Horticulture. Spain, pp. 299–307. Available at: https://dialnet.unirioja.es/servlet/libro?codigo=692309.
Nagle, L., Echols, S. and Tamminga, K. (2017) ‘Food production on a living wall: Pilot study’, Journal of Green Building, 12(3), pp. 23–38. doi: 10.3992/1943-4618.12.3.23.
Nearmap (2018) ‘Bentley Primary School’.
Ocampo, C., Rennie, B. and Oldham, C. (2017) Performance of two urban stormwater biofilters in an area with seasonally high groundwater. Melbourne, Australia: Cooperative Research Centre for Water Sensitive Cities.
Pangarkar, B. L., Parjane, S. B. and Sane, M. G. (2010) ‘Design and economical performance of gray water treatment plant in rural region’, World Academy of Science, Engineering and Technology, 37(1), pp. 896–900.
Payne, E. et al. (2015) Adoption Guidelines for Stormwater Biofiltration Systems. Melbourne, Australia: Cooperative Research Centre for Water Sensitive Cities. Available at: https://watersensitivecities.org.au/content/stormwater-biofilter-design/.
Prodanovic, V. et al. (2017) ‘Green walls for greywater reuse: Understanding the role of media on pollutant removal’, Ecological Engineering. Elsevier B.V., 102, pp. 625–635. doi: 10.1016/j.ecoleng.2017.02.045.
Qiu, Y. G. et al. (2008) ‘Water use efficiency and evapotranspiration of winter wheat and its response to irrigation regime in the north China plain’, Agricultural and Forest Meteorologyogy, 148, pp. 1848–1859. doi: 10.1016/j.agrformet.2008.06.010.
Rathnayaka, K. et al. (2015) ‘Seasonal demand dynamics of residential water end-uses’, Water (Switzerland), 7(1), pp. 202–216. doi: 10.3390/w7010202.
Seah, T. T. T. (2011) A preliminary investigation of readily available local soils that are suitable filter media for biofiltration systems in Western Australia. The University of Western Australia.
Smakhtin, V., Revenga, C. and Döll, P. (2004) ‘A pilot global assessment of environmental water requirements and scarcity’, Water International, 29(3), pp. 307–317. doi: 10.1080/02508060408691785.
Song, Y. H. et al. (2015) ‘Photoperiodic Flowering: Time Measurement Mechanisms in Leaves’, Annual Review of Plant Biology. Annual Reviews, 66(1), pp. 441–464. doi: 10.1146/annurev-arplant-043014-115555.
Steffen, W. et al. (2018) Deluge and Drought : Australia’s Water Security in a Changing Climate. Available at: https://www.climatecouncil.org.au/wp-content/uploads/2018/11/Climate-Council-Water-Security-Report.pdf.
Vuppaladadiyam, A. K. et al. (2019) ‘A review on greywater reuse: quality, risks, barriers and global scenarios’, Reviews in Environmental Science and Biotechnology. Springer Netherlands, 18(1), pp. 77–99. doi: 10.1007/s11157-018-9487-9.
Wang, R. and Zimmerman, J. (2016) ‘Hybrid Analysis of Blue Water Consumption and Water Scarcity Implications at the Global, National, and Basin Levels in an Increasingly Globalized World’, Environmental Science & Technology. American Chemical Society, 50(10), pp. 5143–5153. doi: 10.1021/acs.est.6b00571.
Water Corporation (2021) Climate & water. Available at: https://www.watercorporation.com.au/Our-water (Accessed: 1 June 2021).
Wynne, E. (2017) ‘Study suggests Perth uses double the water of other capitals, but is that the whole story?’, ABC Radio Perth. Available at: https://www.abc.net.au/news/2017-07-11/perth-water-guzzling-is-it-misunderstood/8697898.
Xue, Q. et al. (2006) ‘Physiological mechanisms contributing to the increased water-use efficiency in winter wheat under deficit irrigation’, Journal of Plant Physiology, 163, pp. 154–164. doi: 10.1016/j.jplph.2005.04.026.
Zegada-Lizarazu, W., Zatta, A. and Monti, A. (2012) ‘Water uptake efficiency and above- and belowground biomass development of sweet sorghum and maize under different water regimes’, Plant and Soil, 351(1–2), pp. 47–60. doi: 10.1007/s11104-011-0928-2.
THE AUTHORS
Azrina Karima
Azrina is a PhD candidate in Environmental Engineering at The University of Western Australia. She has been investigating the seasonal water requirements and nutrient removal performance of the greywater irrigated green walls for three years. Her previous research includes investigation on solar desalination and abattoir wastewater treatment.
Email: azrina.karima@gmail.com
Carlos Ocampo
Carlos is a Senior Research Fellow at the Faculty of Engineering and Mathematical Sciences at the University of Western Australia (UWA). Carlos leads research on urban hydrology modelling and field investigations into the interactions between groundwater and surface water, and impacts on nutrient cycling in rural and urban environments.
Email: carlos.ocampo@uwa.edu.au
Louise Barton
Louise is an Associate Professor at The University of Western Australia. Over the past 25 years, she has researched soil nitrogen cycling in a variety of land uses with a focus on developing land-management strategies that maximise plant growth by minimising undesirable losses of nitrogen into the environment.
Email: louise.barton@uwa.edu.au
Carolyn Oldham
Carolyn is a Professor of Environmental Engineering at The University of Western Australia. Over the past 10 years, she has led research in the CRC Water Sensitive Cities on the performance of green infrastructure under Mediterranean climates, including the performance of systems when they interact with seasonally high groundwater.
Email: carolyn.oldham@uwa.edu.au
Share