


Forecasting Energy and Carbon Reductions

DOWNLOAD THE PAPER
Abstract
Sydney Water has assessed sustainability performance for the Lower South Creek Treatment Program (the Project) to gain its first independent Infrastructure Sustainability (IS) Rating. The Project has adopted several innovative process technologies that help drive sustainability outcomes and will deliver significant energy and carbon savings for Sydney Water.
To measure the Project’s sustainability performance for operational energy and carbon, we benchmarked against Water Services Association of Australia (WSAA) Wastewater Treatment Plant (WWTP) energy data from 245 wastewater treatment plants across Australia and New Zealand, rather than developing a reference model to represent a business as usual (called the ‘base case’ in the IS Rating tool).
This approach gives a robust comparison against ‘business as usual’ energy performance in the wastewater sector and can offer a “level playing field” for benchmarking and comparison across the water services industry.
Introduction
An additional half a million people will live in Sydney’s North West by 2040, placing increased demands on the city’s ageing wastewater infrastructure. To improve the wastewater treatment process and cater for increasing loads, Sydney Water established the Lower South Creek Treatment Program (the Project), which includes the process and reliability renewal project at Quakers Hill Water Recycling Plant (WRP) and St Marys WRP. These works, which are currently in construction, are Sydney Water’s first to obtain an independent sustainability rating using the Infrastructure Sustainability Council of Australia (ISCA) Infrastructure Sustainability (IS) Rating tool.
The IS rating process has helped to drive sustainability outcomes for the Project, by targeting resource efficiency and carbon emissions in value engineering, considering sustainability performance of suppliers in procurement, and actively monitoring energy, water and waste in construction.
Innovations driving sustainability outcomes
The Project design includes several innovative process technologies which will provide long-term benefits to the environment, deliver significant energy and carbon savings for Sydney Water, and help pave the way to a more sustainable water services industry. Innovations include the transfer of sludge from Quakers Hill WRP to a regional biosolids hub at St Marys WRP. Centralising biosolids processing provides for more cost effective anaerobic digestion with energy recovery through a cogeneration plant. The anaerobic digester will utilise the Thermal Hydrolosis Process (THP) for sludge pre-treatment, which improves biogas generation during digestion, reduces the volume of biosolids through improved de-watering, and stabilises pathogens allowing for beneficial reuse in the Sydney Basin.
These process technologies will deliver significant savings in transport emissions by significantly reducing truck movements to dispose of large quantities of biosolids. The THP and anaerobic digester have also been designed with the capacity and capability to receive organic food waste (from food processing, etc.) for co-digestion with biosolids. This may be implemented after the commissioning of the main upgrade works (forecast 2020-21), and would significantly increase biogas production and energy recovery, beyond that assumed in this assessment.
Mechanical Primary Sedimentation (MPS) screens will be used in lieu of primary sedimentation tanks, achieving reduced power consumption and greenhouse gas emissions due to reduced aeration requirements in the bioreactor. Solids harvested in the MPS are anaerobically digested, producing biogas and further enhancing energy recovery. MPS also enables pre-sedimentation to take place in a much smaller footprint, using fewer materials, with more efficient odour control.
Quakers Hill will utilise the Nereda Aerobic Granular Sludge (AGS) process where treated effluent is decanted after a very short settling period. This has many sustainability benefits: the footprint is much smaller, the construction costs are substantially lower and embodied carbon from concrete and steel is saved. The move to AGS has preserved threatened native vegetation that would have been cleared for a conventional four stage bardenpho reactor (FSBR). The material savings compared with the base case FSBR will include an approximate 24% savings on concrete and steel, or 1,400 m3 of concrete and 300 tonnes of reinforcing steel.
The AGS process also uses approximately 25% to 30% less energy than a conventional membrane type bioreactor, delivering significant greenhouse gas reductions for the project.
The Infrastructure Sustainability Council of Australia Infrastructure Sustainability (IS) rating tool
The IS rating tool is a voluntary third-party assured standard that measures performance and rewards beyond compliance sustainability in infrastructure. ISCA defines infrastructure sustainability as ‘infrastructure that is designed, constructed and operated to optimise environmental, social and economic outcomes of the
long-term’.
In the energy, carbon, water and materials IS categories, several of the credits require modelling and measuring the performance of the project, asset or process (e.g. resource consumption and greenhouse gas emissions) and comparing it to a business as usual (BAU) ‘base case’ footprint. This paper deals particilarly with the energy and carbon related credits, as shown in Table 1.

Table 1: ISCA credits associated with GHG assessment
The base case selected for the Project is ‘New Plant with Raw Sewage Feed and Aerobic Digestion’, an option considered as part of the Quakers Hill WRP Strategic Options Study by AAJV (August 2014), for both Quakers Hill and St Marys. This option applied the existing treatment processes operating at Quakers Hill and St Marys, and is deemed representative of business as usual for Sydney Water and the wider water industry.
The standard approach for the IS base case is to calculate a custom footprint, using inputs and assumptions representative of the selected base case, developed specifically for the project. While the intent is to compare and measure reduction against business as usual, this creates a lack of comparability between projects across the industry, since differing assumptions, data inputs and modelling approaches result in differing reference cases and results.
For operational energy consumption, the Project has taken an alternative appoach and used Water Services Association of Australia (WSAA) WWTP energy benchamark data to measure improvement against the base case (explained further in the methodology section below).
Methodology
The preliminary energy and carbon forecast modelling for energy use and Greenhouse Gas (GHG) emissions in both construction and operation was undertaken during detailed design to support the IS ‘Design’ submission. This modelling (aligned with the IS Rating Tool v1.2) will be updated after design is finalised, and prior to the IS ‘As Built’ submission in 2020.
Greenhouse Gas (GHG) reporting scope
The reporting of GHG emissions is broken down into reporting scopes, as per technical guidelines from the National Greenhouse Gas and Energy Reporting (NGER) scheme (Department of Environment and Energy, 2017):
- Scope 1 – Direct GHG emissions
- Scope 2 – Electricity indirect emissions
- Scope 3 – Other indirect GHG emissions
The following were excluded from the scope of assessment:
- Landfill of screenings and grit removal
- Staff transport to site
- Deconstruction and end-of-life disposal at end of plant life
Modelling and benchmarking approach
The Project has taken a new approach for the energy and carbon base case modelling, using WWTP energy benchmark data to represent the operational energy performance of the selected base case. This data was collated by WSAA and published in 2017, and is based on benchmarking of 245 WWTPs in Australia and Auckland, categorised by WWTP type and size class.
To align with the selected base case, the average for ‘Extended aeration activated sludge’ WWTPs was used with adjustment for size class (larger plants such as Quakers Hill (38ML/day) and St Marys (48 ML/day) are more efficient than smaller capacity plants). The energy consumption is benchmarked using kWh/Equivalent Population (EP)/year, with EP derived from total BOD removal (1 EP = 55 g BOD/day). A sensitivity analysis was undertaken for base case energy consumption for Quakers Hill and St Marys to test the sensitivity of the results against alternative benchmarks from the WSAA data, to improve the robustness of the study (discussed in the results section).
Construction inputs and assumptions
Construction energy, waste and water use for both the base case and forecast was estimated by benchmarking monitoring data from construction of the Riverstone WWTP, which is part of a wider program and being delivered ahead of Quakers Hill and St Marys WRPs works. Land clearing from construction activities was taken from the Project REF and Decisions Report. Although a larger construction footprint is required for the base case, land cleared was assumed to be the same for the forecast, taking a conservative approach to claiming GHG reductions.
The embodied impacts from manufacturing and transport of construction materials and chemical dosing waste was estimated using ISCA’s IS Materials Calculator. The forecast scenario included some savings in construction materials from value engineering, and also the installation of an AGS reactor in lieu of FSBR at Quakers Hill which saved >1,500 m3 of reinforced concrete. Chemical dosing estimates were based on the design conditions for the proposed treatment plant and assumed to be the same for both the base case and forecast scenarios. These estimates will be confirmed and optimised during commissioning.
Operational inputs and assumptions
The operational phase assumed 50 years of operation, and the flow rates estimated to occur in 2043 formed the basis of design.
To calculate operational electricity demand for the forecast scenario, equipment lists were supplied for the St Marys and Quakers Hill upgrade works from the design teams. Details for each piece of equipment included the power capacity (max kW) and usage profiles (standby or duty and percentage of average usage in a 24-hour period). Taking a conservative approach, no de-rating factors were applied to account for equipment operating under partial load. The power ratings either came from supplier specifications or assumptions from the design teams in the absence of available data. Diversity factors were estimated by designers based on required capacity to treat the estimate effluent flow rate coming into the treatment plants.
The forecast scenario also included anaerobic digestion and cogeneration, with total annual biogas generation (115,358 GJ/year or >5,000,000 Nm3/year) provided by the process engineer responsible for solid stream detailed design, which included basis of design details provided by the supplier of the anaerobic digester and Thermal Hydrolosis Process (THP) system. Two 800kW cogeneration engines are estimated to produce 13,329 MWh/year electricity output.
The base case for operational energy use was estimated using the WSAA 2015/2016 Wastewater Treatment Plant (WWTP) Energy Benchmark data. The guide value of 35 kWh/EP/y representing ‘Extended aeration activated sludge, size class 5 (EP >100,000)’ was used for the benchmark. The following options for benchmarks were also tested in a sensitivity analysis:
- average for all WWTPs in Australia/NZ
- average for all WWTPs in Australia/NZ with activated sludge treatment and separate sludge stabilisation, anaerobic digestion and cogeneration
- existing Quakers Hill and St Marys operation.
The base case assumptions used for this assessment have been developed through consultation with the delivery partner, Sydney Water and design teams.
Fugitive emissions
Fugitive emissions are common in any biological breakdown process. Nitrous oxide and methane are the two key gases released from effluent treatment processes and handling, which have global warming potentials of 285 and 25 times that of carbon dioxide respectively. Accurate estimation of the fugitive emissions are challenging for operational facilities, and even more so during design.
Nitrous oxide can be produced during the conversion of nitrogen in WWTP processes, as well as downstream in effluent and biosolid disposal. Both the base case and the forecast scenario apply the NGER technical guidance for nitrous oxide released from wastewater handling (domestic and commercial). Due to a lack of information around N removed in biosolids and screenings, it was assumed that all N is removed during the treatment process or contained in effluent. The NGER method assumes 4.9 tonnes CO2-e in nitrous oxide emissions per tonne of N is removed in the treatment process, and 4.7 tonnes CO2-e if nitrous oxide emissions per tonne of N is discharged to enclosed waters in effluent.
Emissions of methane in WWTPs can be expected from influent works (excluded in this case), anaerobic/anoxic tanks as part of activated sludge systems and sludge digestion and handling. Methane is formed under anaerobic conditions, and despite the presence of oxygen in the aeration tanks, methane can also be emitted from these tanks. This methane is most likely formed earlier in the treatment process, or upstream in the sewerage network.
At WWTPs that are equipped with an anaerobic sludge digester, such as the one being installed at St Marys WRP, methane can be emitted from different locations in the digester. Methane can also be emitted during biogas combustion (leakages, incomplete combustion) or during storage of digested sludge. The amount of methane emitted from these storage facilities will depend on the sludge retention time applied in the activated sludge system, the temperature and the level of dissolved methane, which in turn depends on the type of transport system prior to the WWTP.
As with nitrous oxide, there are NGER methods available for estimating fugitive methane emissions, which have significant degrees of uncertainty. At the time of assessment, there was insufficient information to accurately forecast a difference in emissions between the base case and forecast.
Taking a conservative approach to avoid overclaiming reductions in carbon emissions, the base case (aerobic process) was assumed to have no fugitive methane emissions. For the forecast scenario it was assumed 1% of the methane captured in the anaerobic digester is released as fugitive methane. Since the anaerobic digester is designed with a double skin and external pressure system, it is expected that there would be very little or no methane leakage under normal operation. These assumptions will be verified, and revised if required during commissioning.
Combustion of biogas
Combustion of biogas captured from anaerobic digestion is treated as carbon neutral, apart from the unoxidised methane fraction which is assumed to be 4.8 kg CO2-e per GJ captured and combusted. This is based on the NGER technical guidance for estimating GHG emissions from wastewater treatment facilities (Department of Environment and Energy, 2017).
Results
The energy and GHG forecast modelling show that the Project will achieve a significant 42% reduction in total GHG emissions (>712,000 tonnes CO2-e over construction and 50 years’ operation), including embodied GHG emissions from construction materials and treatment chemicals. These reductions are primarily from a reduction in scope 2 emissions from imported electricity (see Figure 1) due to improved energy efficiency and onsite generation from anaerobic digestion and the co-generation plant.

Figure 1. GHG emissions by emission source over construction and 50 years of operation
Table 2 shows the detailed breakdown of GHG emissions over construction and a 50-year operation for both the base case and forecast. The main GHG contributions in the forecast are fugitive emissions (58.7%), electricity imports during operation (23.7%), and embodied emissions from construction materials and chemical dosing (10.7%), from which chemicals contributed the most. Scope 1 emissions are slightly higher for the forecast, since it is assumed that there are fugitive methane emissions from the anaerobic digestion process. Unoxidised methane emissions from combustion in the cogeneration plant were also assumed. This would represent a worst-case scenario for increase in methane emissions from the base case.
Since the base case has no energy recovery, the main GHG contributions in the base case are scope 2 and 3 emissions from operational electricity consumption (58.36%), and these emissions are more than the entire GHG footprint for the forecast. Fugitive emissions are 32.5% and embodied GHG emissions from materials and treatment chemicals are 6.34%. The transport of biosolids, with greater volumes and distance to disposal, are significant with 2.3% of total emissions (these are reduced to 0.4% in the forecast).
There are also significant reductions in GHG emissions from construction materials (7.1%) which are primarily due to materials savings from the MPS screens in lieu of primary sedimentation tanks and Nereda AGS in lieu of FSBR at Quakers Hill.

Table 2: GHG assessment results by scope and emission source (tonnes CO2-e)

Table 3: Credit points achieved under ISCA Ene-1
The following table (Table 3) shows the reduction in GHG emissions over construction and 50 years of operation. This excludes embodied emissions from materials which are covered separately in Mat-1 (materials footprint measurement and reduction). The project is achieving 44.7% reduction in GHG emissions, which exceeds the 30% threshold to achieve maximum points in ISCA Ene-1. The project is also targeting an innovation point for exceeding this benchmark.

Table 4: Credit points achieved under ISCA Ene-2
Table 4 shows the total electricity demand and portion supplied by onsite renewable energy generation. The project is achieving 69% renewable energy supply which exceeds the 40% threshold to achieve maximum points in ISCA Ene-2. The project is also targeting an innovation point for exceeding this benchmark.
The following table (Table 5) shows the total material footprint and reduction against the base case. The project is achieving a 4% reduction in embodied GHG emissions from construction materials and treatment chemicals.

Table 5: Credit points achieved under ISCA Mat-1
Sensitivity analysis
A sensitivity analysis of the Ene-1 carbon reduction results against a selection of the WSAA WWTP benchmarks for electricity consumption was completed. Figure 3 shows a comparison of the total electricity demand for Quakers Hill and St Marys (26.5 kWh/EP/y) and net electricity demand / import (7.9 kWh/EP/y) against a range of WSAA WWTP benchmarks and measured consumption from current operations at Quakers Hill and St Marys (FY 15-16).

Figure 3: Comparison of forecast operational electricity use against WSAA WWTP benchmarks and current operation at Quakers Hill and St Marys
Table 6 shows the impact of base case operational energy benchmark selected on the base case GHG emissions (excluding embodied carbon) and reduction of the forecast against base case. This shows that the guide benchmark of 30 kWh/EP/y is more efficient than other possible benchmarks, and that even if the most efficient ‘target’ benchmark was selected (treatment plants in the top 10% energy performance) for the base case, the forecast would still achieve a 30% reduction and achieve full points.
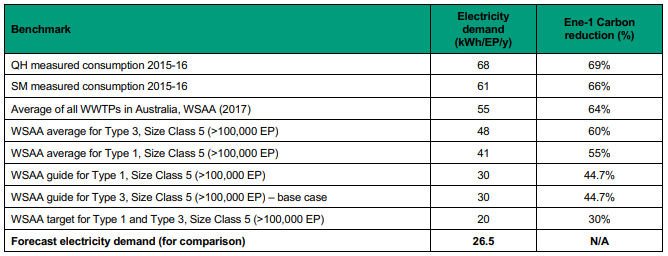
Table 6: Sensitivity analysis of base case electricity demand benchmark selected and carbon reduction for Ene-1
Further opportunities for ‘As Built’ IS rating
The above analysis uses the 50-80% detailed design and, as mentioned, is for the IS ‘Design’ rating submission. This assessment will be revised for the IS ‘As Built’ rating submission at the end of construction in 2020. Further opportunities to reduce GHG emissions are still being investigated in the construction and comissioning phase, including:
- Monitoring of fugitive methane and nitrous oxide emissions during commissioning, e.g. ensure there is no leakage of methane from the anaerobic digestion and cogeneration plants.
- Opportunities to reduce embodied impacts from chemical dosing, e.g. use of liquid sugar in place of methanol for carbon dosing.
- Installation of solar PV on existing buildings and on ground.
- Implementation of co-digestion of food waste with sludge at St Marys to increase biogas production and onsite energy generation.
- Investigate substitution of fossil-based methane with bio-based liquid sugar for carbon dosing.
Discussion on suitability of benchmarking approach
When undertaking any energy or greenhouse gas assessment, there are significant challenges in defining a baseline or reference scenario from which to forecast, measure and monitor reductions. The ISCA base case sets out a detailed framework for projects to define the reference scenario, however this allows significant flexibility for projects to define their BAU technologies and design.
The WSAA WWTP energy benchmarking data offers a definitive measure of average performance to measure reductions and improvement against. This data is based on the treatment load through the plant, and can be further specified by treatment type and size class of plant.
It is important to note that there are some challenges to using this data as follows:
- Benchmark data represents existing WWTPs, which may perform worse than business as usual for new plants being constructed.
- There is significant variance in the ‘average’, ‘guide’ and ‘target’ benchmark values for which the results are particularly sensitive – agreement on which benchmarks are most appropriate is required to ensure a “level playing field”.
- The WSAA energy benchmarking data only covers electricity consumption and does not include fugitive emissions which are significant for the GHG assessment.
We also note that no quantitative analysis has been undertaken to compare against the more standard approach of developing a customised base case. However, we propose that this method offers significant potential benefits that need to be investigated further. The IS rating tool applies to all infrastructure asset types, and there are challenges to ensuring a consistent and fair approach which does not disadvantage other sectors that may not have access to equivalent benchmark data.
Despite these challenges, we suggest that the benchmarking approach can provide greater consistency between projects, if an agreed and consistent framework exists for how to apply the benchmark data.
This benchmarking approach also allows project teams to focus efforts on driving performance against a fixed reference point, rather than spending considerable time developing a hypothetical “business as usual” base case. “Business as usual” is challenging to define, and two projects with identical scope are likely to develop a significantly different base case scenario – especially when the credit point scoring mechanism in the IS rating tool creates an incentive for projects to develop a base case with the poorest performance possible.
Conclusion
An alternative benchmarking approach to the ISCA base case for wastewater infrastructure projects has been tested and presented, using the extensive WSAA WWTP energy benchmark data to compare the energy consumption forecasts for the Project.
This approach has potential to establish a data-based and more robust definition of ‘business as usual’ energy performance in the wastewater sector. It has potential to improve comparability between projects by offering a “level playing field” when calculating energy and carbon savings against a base case. Consultation between the wider water services industry (WSAA and AWA) and ISCA would help to ensure a consistent and fair benchmarking approach for future wastewater infrastructure projects.
Acknowledgements
Django Seccombe (Sydney Water) for assistance developing the ISCA base case, and providing valuble information on the planning phase and development of innovations.
Greg Appleby (Sydney Water) for providing information and assistance with applying the WSAA WWTP energy benchmark.
AAJV and Stantec design teams for providing information to assist with the greenhouse gas assessment including mitigation measures in design.
About the authors
Gill Fowler | Lead Environmental Scientist, Sydney Water.
An environmental leader with over 16 years’ experience in the water industry focusing on integrated water planning and seeking better environmental, sustainability and customer outcomes. Gill leads and contributes to integrated environmental and planning teams to deliver environmental services, strategies, assessments, and project approvals for major infrastructure projects and programs across Sydney Water. This includes new infrastructure in Sydney’s growth areas and wastewater treatment plant upgrade projects such as the Lower South Creek Treatment Program.
James Logie | James is the sustainability adviser for the Lower South Creek Delivery Partner, and has been working closely with Sydney Water to undertake the first Infrastructure Sustainability (IS) Rating for a Sydney Water project. His experience spans across the built environment from buildings, precincts, transport infrastructure, and waste water projects, and his expertise is in life cycle assessment, greenhouse gas assessment, whole of life cost analysis and sustainable procurement processes.
James is a member of the Green Building Council of Australia Life Cycle Assessment Expert Reference Panel, is an Infrastructure Sustainability Accredited Professional, and a Life Cycle Assessment Certified Practitioner.
Kevyn Lockyer | Kevyn is a design manager who had delivered infrastructure upgrade projects for a wide range of water authorities throughout Australia, UK and Europe. He is a chartered chemical engineer with over 25 years’ experience in the industry. Kevyn has been an independent consultant and, for MWH, was a global leader in odour management, sewer septicity, corrosion and odour control.
His wide range of skills include process engineering, design management, project management sewer corrosion, odour management, engineering management, environmental management, air pollution control and HAZOP facilitation. Successful projects have involved a variety of industries wastewater treatment. Having worked for many specialist air pollution control contracting and consultancy companies, he has extended his experience in conceptual and detailed design as well as the installation and commissioning of a wide range of abatement equipment and technologies.
Kevyn has a proven ability to establish and manage multi-disciplined teams of engineers and technical experts in Europe and Australia, winning business and executing projects.
References
Department of Environment and Energy. (2017). National Greenhouse and Energy Reporting Scheme Technical Guidelines for the estimation of emissions by facilities in Australia. Canberra: Australian Government. Retrieved from http://www.environment.gov.au/system/files /resources/0e76f367-dfad-451d-8f41-859acfad327a/files/ ngers-technical-guidelines-2017-18.pdf
Department of Environment and Energy. (2018). National Greenhouse Accounts Factors – July 2018. Canberra: Australian Government. Retrieved from http://www. environment.gov.au/climate-change/climate-science-data/greenhouse-gas-measurement/publications/national-greenhouse-accounts-factors-july-2018
GHD. (2017). Report for WSAA – WWTP Energy Benchmarking 2015-2016: Part 1 – Summary Report. Water Services Association of Australia (WSAA).
IPCC. (2006). IPCC Guidelines for National Greenhouse Gas Inventories. Intergovermental Panel on Climate Change.
ISO. (2006). ISO14064-2 – Greenhouse gases: Part 2 – Specification with guidance at the project level for quantification and reporting of greenhouse gas emission reductions and removal enhancements. Standards Australia.
TfNSW. (2016). Transport for NSW Carbon Estimate and Reporting Tool v2. Sydney: TfNSW (Transport for NSW). Retrieved from https://www.transport.nsw.gov.au/industry/ doing-business-transport/sustainability-at-transport
Share