


Feasibility of mini hydropower in water transmission pipelines

A case study conducted in South Australia examining small scale energy solutions
DOWNLOAD THE PAPER
ABSTRACT
Hydropower, with an efficiency averaging 80-90%, remains one of the most compelling renewable energy technologies on the market. However, with the substantial capital cost associated with the construction of large hydropower schemes and the lack of available land, small scale hydropower systems are an alternative. This paper explores mini hydropower which has a power output of approximately 100 kW up to 1 MW and due to its significantly lower capital investment, has potential to be widely distributed.
This study assesses the economic viability of installing a mini hydropower turbine in an existing water transmission pipeline at the location of an energy dissipator in Hahndorf, South Australia. In addition to exploring the economic impact with the installation over a 25 year period, this research explores environmental and social implications of the technology. The paper highlights the potential of installing mini hydropower while considering future uncertainty with a changing climate and dynamic water demands.
Key Words: Mini Hydropower, Energy Generation, Renewable Energy, Green Energy, Hydropower, Turbine, Mini, Feasibility, AEMO
INTRODUCTION
With the irreversible effects of climate change becoming more apparent with the world now facing potential loss of entire countries in the Pacific and a global food shortage, the need to reduce our carbon footprint has never been more paramount. From data provided by the Carbon Dioxide Information Analysis Centre of the World Bank, Australia is recorded as being the 15th highest carbon dioxide emitter per capita (The World Bank 2018). Among Australia’s contribution, 85% of emissions come from the energy generation industry which is the highest percentage of any country (IEA 2018). For this reason, it is clear the solution to Australia reducing its CO2 emissions lies in the transformation to clean, renewable energy production sources.
Among the energy generation methods being heavily exploited in Australia are wind and solar power farms; with their integration with large scale pumped hydropower schemes aiming at producing sustainable base load energy to replace current non-renewable projects. These technologies are paving the way for a renewable future, however, there is a large capital cost associated with their construction and a lack of suitable areas for their implementation. For this reason, there is a need for small scale energy production methods which can be widely distributed and contribute to the renewable energy supply.
Mini hydropower involves the implementation of small scale turbines into water transmission systems to produce energy from existing water flow through a pipeline. Not only do these have an efficiency of up to 90%, much larger than rooftop solar panels with 15% (GreenMatch 2018), but they do not produce the same environmental effects as large hydropower schemes such as damage to biodiversity, altering natural flows in river systems, facilitating eutrophic water conditions and significant greenhouse gas emissions during its construction (Senarath et al. 2018). There is uncertainty, however, over whether the benefits in terms of energy generation outweigh the capital cost of construction and therefore, whether the technology is viable for implementation into water transmission systems.
To explore this concept, this paper analyses the potential for its construction in the Murray Bridge to Onkaparinga Pipeline (MBO) at the current site of the Hahndorf Dissipator near Adelaide, South Australia. This turbine would be used in conjunction with the existing dissipator to take advantage of kinetic energy from water flows. These flows would normally be wasted through the dissipator, but harnessing them will generate renewable energy without causing harm to the surrounding environment.
In partnership with the state government water utility, SA Water, the viability of the mini hydropower project is explored through modelling optimal distribution timing of energy into the National Energy Market. This is explored with an in-depth economic analysis and a future uncertainty analysis through multiple plausible scenarios to determine whether the implementation of mini hydropower is cost effective when considering the prerequisites for a prosperous future.
When considering a project, a balance must be achieved between social, environmental and economic factors. While this research considers implementing a green energy project to reduce our fossil fuel reliance, this focus primarily looks at weighing up the project economically. This is because feasibility is constrained on institutions having ample financial capacity to install such a scheme into pipelines which enhances the focus on financial aspects. If the project is financially viable, a social benefit results as the introduction of clean energy will not only benefit this generation but future generations to come. If feasible, this research may stand at the forefront for green energy production in high demand water distribution systems.
CASE STUDY AT HAHNDORF, SOUTH AUSTRALIA
The SA Water–owned Hahndorf Dissipator is located in the Adelaide Hills and adjacent to the Onkaparinga River in South Australia (Figure 1). Water is transported from the Murray River through the MBO pipeline and up a rising main; where it is stored in Summit Storage reservoir before being passed through the Dissipator into the Onkaparinga River.
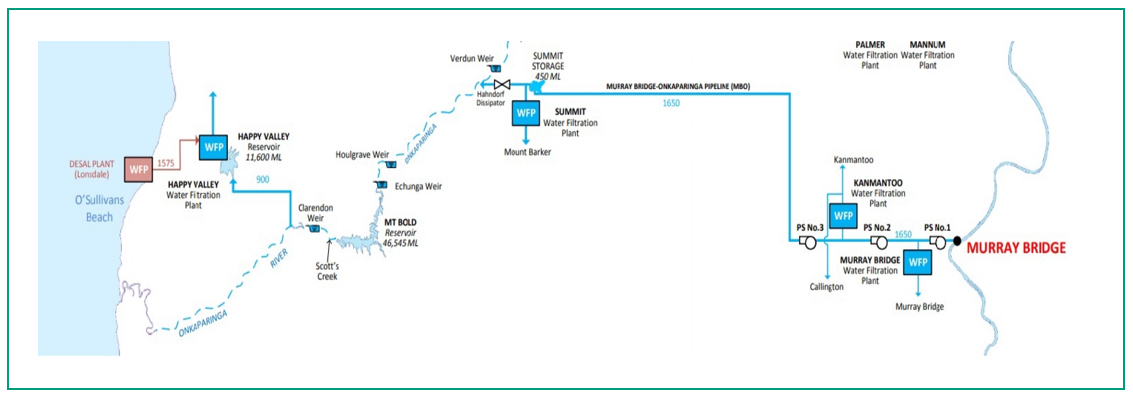
Figure 1. Plan of Hahndorf and Murray Bridge to Onkaparinga Pipeline (SA Water 2017).
Once flows reach the Hahndorf Dissipator, they supply southern Adelaide water demands after being treated at the Happy Valley Water Treatment Plant. The MBO pipeline varies in diameter across its total length, but predominantly is 1.4 metres along its gravity main, and 1.7 metres along its rising main. Currently, flows are diverted into three different pipes with three butterfly valves to control flow passage through the Hahndorf Dissipator. There are also three discharge regulator valves used to dissipate energy as water flows through. There is incentive for an engineering project which will utilise the wasted energy being burnt off within the Hahndorf Dissipator.
A case study at the Hahndorf Dissipator will be explored to determine the feasibility of installing a mini hydropower turbine at this location.
METHODOLOGY
- Hydraulics for the Hahndorf Dissipator
To study the viability of mini hydropower at the Hahndorf Dissipator, the particular site characteristics that determine its hydraulic capacity is required. These characteristics determine the optimal turbine size to maximise energy output from existing flows.
The US EPA water distribution modelling software, EPANET, was used with a detailed network of the MBO system. This model provides characteristics for the reservoirs found along the system from the Murray River to the Hahndorf Dissipator as well as information on pumps and different segments of pipe. By specifying different base demands at a location after the Dissipator that replicates the size of the turbine being considered, the turbine head was found from the difference between total head from the inlet and outlet of the Dissipator node. This accounts for the frictional losses along the pipeline to this point. With these turbine head values and turbine design flows, a turbine selection table produced by Paish (2002) was used to determine the type of turbine most suitable for these conditions. As shown in Figure 2, the yellow ellipse containing seven data points represents the region containing all turbine sizes considered for this research: 1000, 1500, 2000, 2500, 3000, 3500 and 4000 L/s. As historical flows at the dissipator were not found to exceed these values, it is considered infeasible to invest in a larger sized turbine.
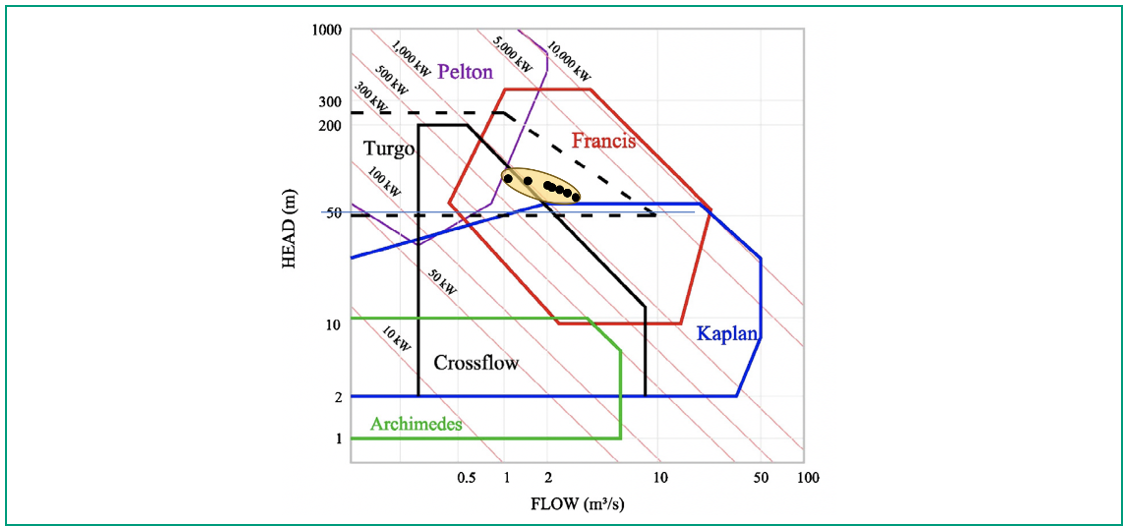
Figure 2. Region representing the appropriate turbine selection for different turbine sizes determined by the site hydraulic characteristics.
From these data points, it is clear that the only possibilities for the most suitable turbine are a Turgo and Francis Turbine. Through communicating with a turbine manufacturer, the merits of installing a Turgo turbine were highlighted due to its ability to have a relatively constant efficiency for different flow rates. This is a desirable quality for a turbine at this site as inflows are known to fluctuate readily depending on climate and downstream demand. With these qualities, the turbine power was calculated through Eq. 1.
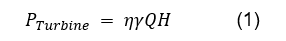
where is the specific weight of water (kN/m3), is the volumetric flow rate (m3/s), is the efficiency of the turbine and is the turbine head (m). An efficiency of 0.85 was assumed as the turbine characteristic curves for a Turgo turbine remain relatively constant at this value.
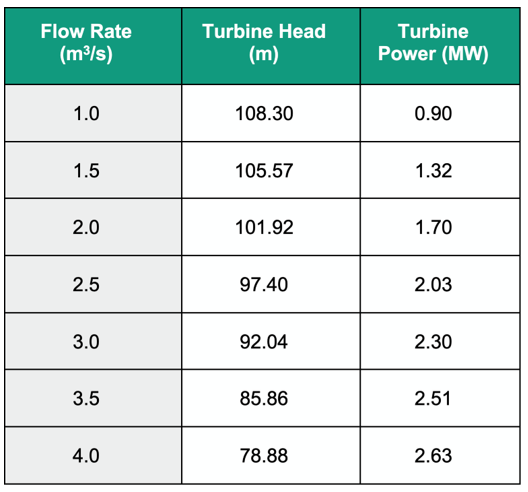
The power potential for each turbine size differs greatly from applying this equation, as can be seen in Table 1.
Table 1: Turbine power potential for different turbine sizes.
prices in descending order. This ensures the turbine transfers the flow requirements in the most profitable times.
Table 1 shows that the mini hydropower turbine at the Hahndorf site has the potential to provide 0.9-2.63 MW of power. This is promising as an average mini hydropower turbine usually provides up to 1 MW of power (Renewables First 2015); enough energy to power approximately 1000 homes.
The time to transfer is another property affecting the energy output as if the demand required to be passed downstream exceeds the capacity of the turbine, water will need to be passed through the Dissipator and hence a portion of potential energy is wasted. A time to transfer of over 24 hours indicates the turbine size has insufficient capacity to meet downstream demands. The time to transfer is defined by Eq. 2.
- The Australian Energy Market Operator
The Australian Energy Market Operator (AEMO) 30-minute spot prices were utilised in order to calculate the amount of profit that a mini hydropower turbine can produce, and therefore, determine if it is cost effective to install the technology. The AEMO operates the Australian retail energy market whereby they facilitate the selling of energy from gentailers and buying by consumers in the National Energy Market (NEM) (AEMO 2017). The 30-minute spot prices are capped between -$1,000 and $14,000 per MWh.
- Feasibility Scenarios
To determine the viability of mini hydropower, the returns an introduced mini hydropower turbine can generate needs to be determined. To do this, historic pipeline flow data and AEMO spot prices were required. Three alternate scenarios were explored, each involving operating the transfer of energy from the turbine in a unique way. The development of these scenarios allowed for a net present value (NPV) analysis to be performed to determine if the associated capital costs can be outweighed by the returns produced from the turbine.
3.1 Scenario 1
Scenario 1 is configured in such a way that it calculates the annual returns from the turbine from electrical energy transfer into the NEM through assuming the operator can perfectly predict the AEMO spot prices in advance. As analysed below, assuming the operator is provided with daily flows requirements to be transferred and manages the AEMO price predictions throughout the day, this assumption is not unreasonable. A model was created using the computer language of Fortran to predict the annual profits from observed flow data by ranking the historic AEMO spot
prices in descending order. This ensures the turbine transfers the flow requirements in the most profitable times.
AEMO Prediction Accuracy
To understand the efficacy of applying the premise stated above for Scenario 1, it is necessary to determine the accuracy of the AEMO spot price predictions. The AEMO report to the Reliability Panel annually to discuss the year’s operational consumption and demand (AEMO 2017). From an analysis using the report for a period from 2016 to 2017, the AEMO demonstrated a Mean Percentage Error (MPE) of approximately 1.1% between observed and predicted prices for South Australia. Additionally, the previous report published for the period of 2015 to 2016 shows an MPE of 2.2%. These figures emphasise the high accuracy of the AEMO’s prediction abilities. To analyse the reliability of these MPEs, real-time observation of the AEMO electricity spot prices was conducted. September 23rd in 2018 was explored using 12 hours of 30-minute spot price forecasts which were compared with the actual prices observed after the time period had elapsed. This comparison is presented in Figure 3.
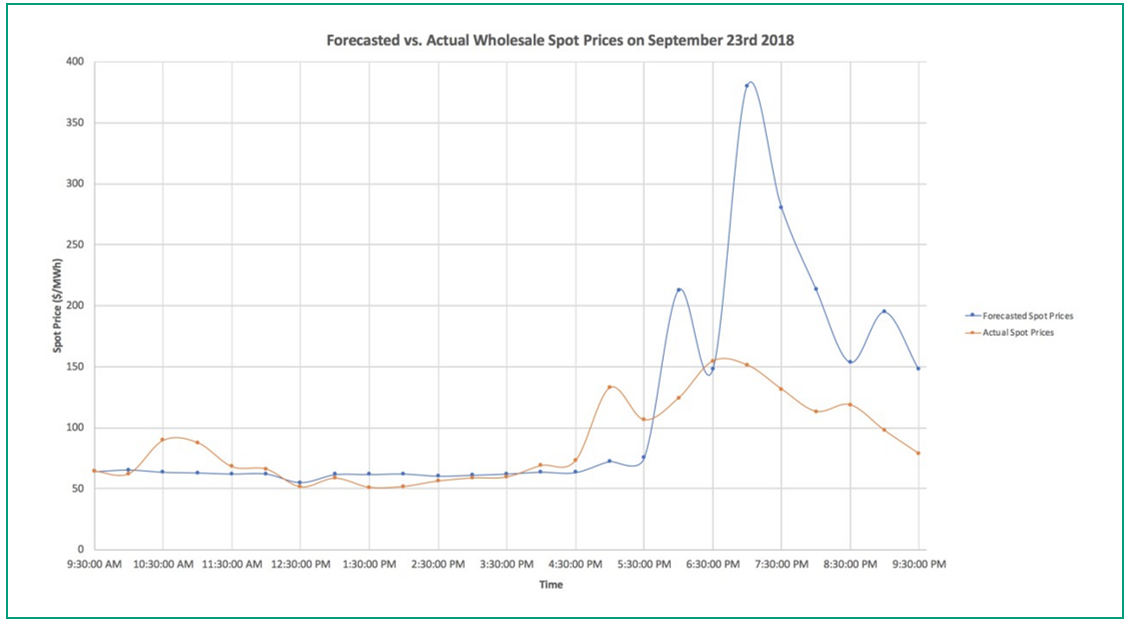
Figure 3: Forecasted versus actual wholesale spot prices by the AEMO on the 23rd of September 2018 over a 12 hour period (AEMO 2018).
It can be observed from 9:30 AM to 4:30 PM that there is very little discrepancy between forecasted and actual spot prices. However, after 4:30 PM there are some large differences occurring in peaks due to the predictions becoming more inaccurate further in advance. Fortunately, an operator has access to AEMO spot price predictions throughout the day so can make revisions when necessary. Also, although there is relative inaccuracy at the end of the time period, the predictions still correctly predict the order or magnitude of the spot prices which is beneficial information for maximising energy generation profits.
Hence Scenario 1 was formulated with the knowledge that it is reasonable to predict the returns from energy generation of the mini hydropower turbine by “ranking” electricity price predictions and monitoring them throughout the day.
The methodology for Scenario 1 suggests that an operator has the capability to know the AEMO electricity prices before they occur and can subsequently rank them accordingly from highest to lowest for each given day. This methodology assumes the operator can perfectly forecast the optimal distribution timing of water flow into the mini hydropower turbine.
Selection of Time Series Data
In selecting a suitable time series of data to be used in the Fortran modelling, there needs to be a satisfactory amount of historic data to reduce bias towards specific anomalous events. The available historic data for flows through the Dissipator was limited to 2001-2017. For a detailed and accurate prediction of returns for Scenario 1, the AEMO spot prices only for the period of January 2010 to December 2017 were analysed for the specific case study at Hahndorf. This was decided due to the major El Niño event which affected southern Australia from 1999-2009 and caused the longest uninterrupted series of years below median rainfall (van Dijk 2013). This event caused what's referred to as the Millennium Drought, in which the capital cities implemented strict water restrictions and abnormally high electricity prices were observed (van Dijk 2013). The scope of this event was extremely rare and has since been calculated to be 97-98% more severe than any drought observed in the region since 1783. The period of January 2001 to December 2009 constitutes 50% of the historically available data set which, if used, would assume that Adelaide will be in a Millennium Drought for half the design life of the mini hydropower project. This would also mean that for half the time period, there would be an overestimation of water flow through the dissipator to meet demands downstream and therefore an unrealistically large energy output.
Computational Methods
Within the Fortran model for Scenario 1, using the calculated turbine power (Eq. 1) and the time to transfer flow through the turbine (Eq. 2), the energy output could be calculated using Eq. 3.
where P is the turbine power output and t is the time to transfer.
The energy produced by the turbine was calculated every thirty minutes so that the corresponding profits could be calculated using the AEMO spot prices. This process yields the total returns for each day in a year. This methodology was repeated for each year of data and its resulting mean was used in the NPV analysis to represent the expected energy generation profits for a particular turbine size.
3.2 Scenario 2
The formation of the second feasibility scenario was developed from an understanding of the inaccuracies when assuming the operator would be able to perfectly predict the order of magnitude of AEMO energy spot prices. Despite being similar to Scenario 1, this scenario is more of an advanced scheduling method rather than assuming perfect predictions of AEMO spot prices are always possible. This scenario allows for an increased level of flexibility for an operator who may be managing multiple sites simultaneously that will require scheduling in advance to determine when to pass flows through the turbine. Although it is unlikely that an operator would completely neglect energy price predictions, having prior knowledge of how energy prices fluctuate daily at different times of the year can greatly assist an operator to schedule flows through the turbine up to a week in advance.
This justification led to the creation of a frequency analysis for the eight years of AEMO spot price data, to determine what constitutes a highly priced period of time. Given a regular occurrence, the hours in a given day that are almost certainly going to be highly priced were identified. After this, in order to replicate the reviewing process an operator would be required to go through to determine when to distribute the remaining water demands, the scenario follows the same ranking procedure as Scenario 1.
Determining the Historically Optimal Priced Period of Time
When selecting high priced periods, vigilance must be used to best capture the regular high priced periods and not underestimate the period length; as some important periods of the day may not be utilised.
Through conducting a frequency analysis, a final table of periods of time deemed optimal for transferring flow through the turbine was created. The results demonstrate the periods in a given day, for each month, experiencing high electricity prices. The highest priced times for each month are presented in Table 2.
Table 2: Periods concluded for each month as being highly likely to produce the highest energy prices.
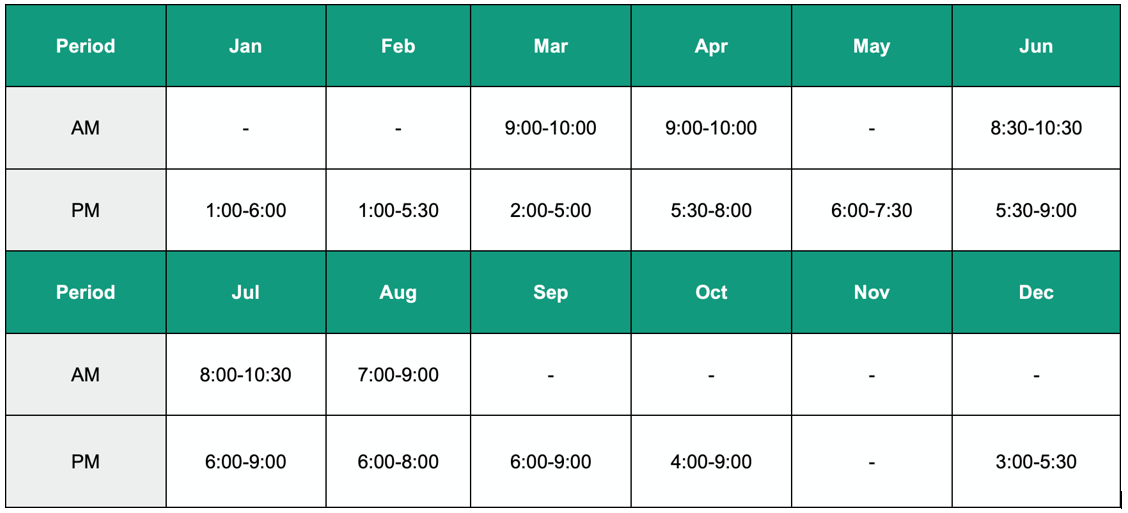
With the highest priced energy time periods determined for each month, a model was developed such that the turbine prioritises passing flows in these times. If remaining water flow needs to be delivered outside of these periods, the model follows the same process as Scenario 1 and ranks the electricity prices not already allocated. This represents the daily reviewing process an operator would likely go through.
3.3 Scenario 3
As there is some inherent uncertainty surrounding the optimal times flow should be delivered through the turbine, Scenario 3 considers a different methodology to eliminate this ambiguity. It delivers water flows which allow for a maximum energy output from the turbine whilst ensuring reservoir and environmental constraints are not violated. In order to do this, additional flows were passed through the turbine that were greater than downstream demands and consequently required extra pumping costs to be factored into the NPV analysis. Reservoir operations ensure that even in this drought prone region of Australia, there will be ample storage to meet the water demands downstream of Happy Valley Water Treatment Plant and environmental flows. Additionally, excessive flow rates at Hahndorf are avoided to prevent erosion of the river bank at the site or damage to the riparian zone.
In order to have the minimal environmental impact, the maximum allowable flow was passed through the turbine where the Hahndorf Dissipator was not used. To examine if the current infrastructure could meet this constant demand, it was determined if it could cater to the maximum possible flows that could be passed through the system without violating environmental constraints downstream.
This analysis was undertaken through the use of an Australian hydrological modelling and water resources management software provided by eWater. “Source” can operate through calibration, stochastic or single analysis runs to provide results which show the balance of reservoir levels given environmental or consumer demands downstream, rainfall-runoff inputs and losses from evapotranspiration. By studying the site diagram from Figure 1, Figure 4 was produced in the software to represent the main features of the system that will affect flows through the turbine. The configuration of this model is dependent upon understanding the hydraulic characteristics of each node along the MBO system as well as the way in which water is stored and supplied to Happy Valley (end user node representing the water supplied to Metropolitan Adelaide).
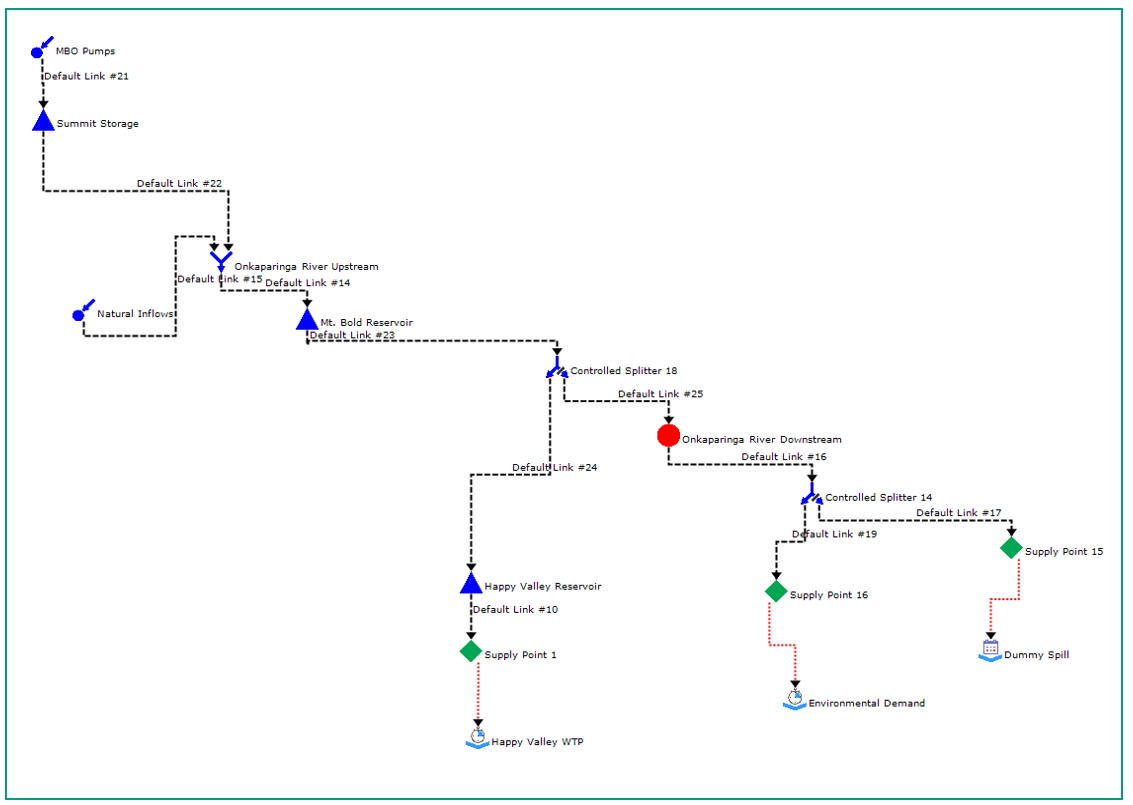
Figure 4: Source diagram of the main processes of the MBO pipeline system.
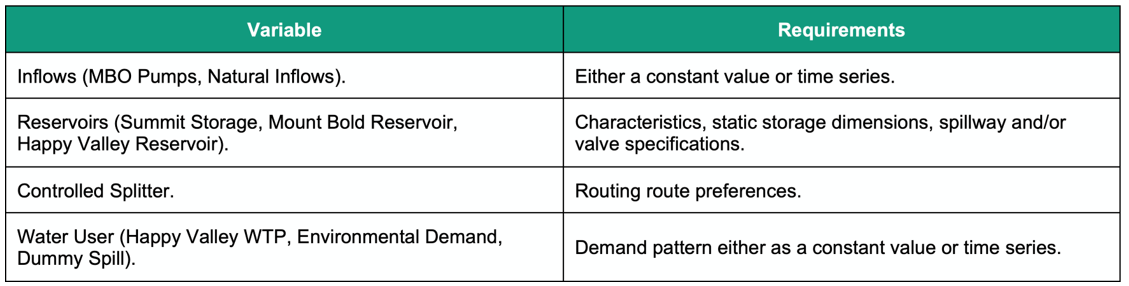
The specific requirements to configure this system, for each node, are outlined in Table 3.
Table 3: Requirements for Source node specifications.
The model was further refined to include a “dummy spill” in which the maximum flow could be discharged into the Onkaparinga River without violation of environmental constraints.
Results from running the model proved existing infrastructure can handle fixed, high flow discharges which provides reassurance when demand increases are expected in the future due to population growth and climate change. Summit Storage Reservoir has the smallest capacity of the three reservoirs displayed in Figure 4. Despite this, consistent with the other reservoirs, the storage volume remained stable across the eight year modelling period.
Given the system can successfully pass the maximum possible flow which adheres to environmental considerations, the Fortran model was used to undertake an economic analysis for passing the minimum flow through the turbine that produces the maximum energy output. A ranking model for AEMO spot prices, similar to Scenario 1, was used in the algorithm for Scenario 3 to minimise pumping costs and maximise returns.
3.4 Summary of the Feasibility Scenarios
Each of the three feasibility scenarios described in the previous sections are summarised conceptually in Figure 5.
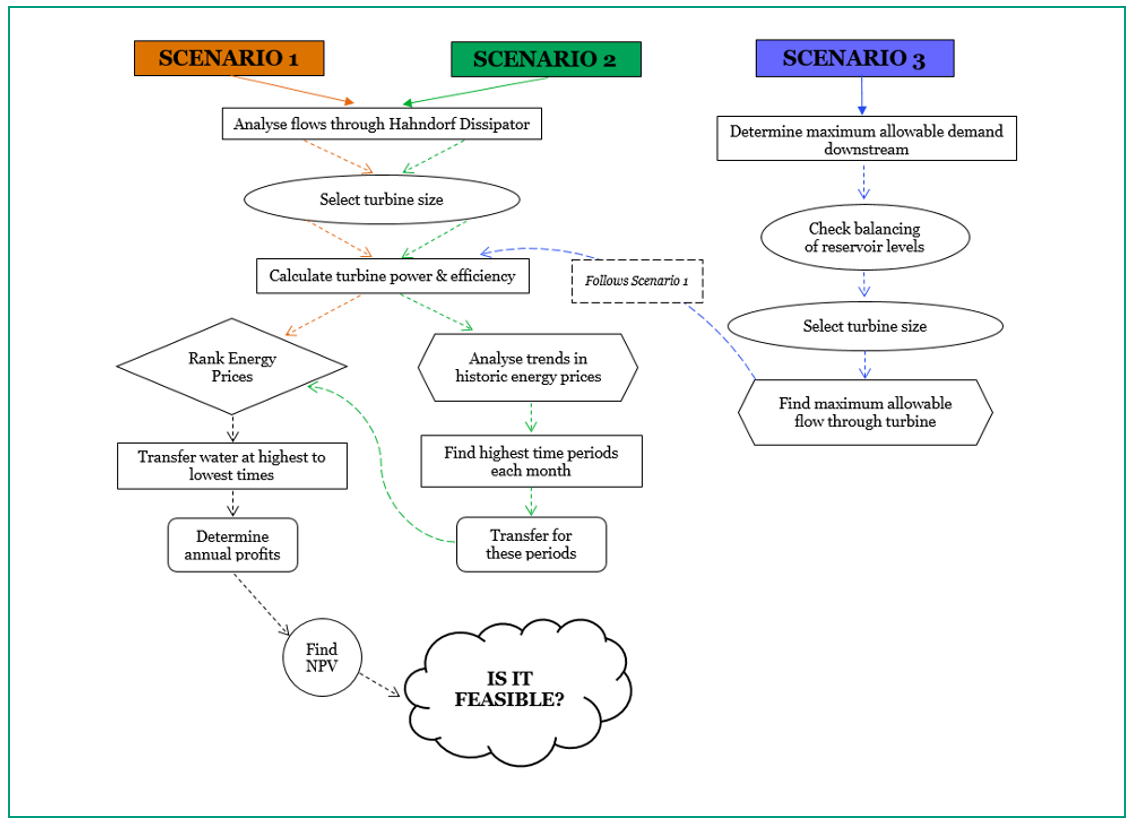
Figure 5: Conceptual flow chart of the three feasibility scenarios.
- Multiple Plausible Future Scenarios (MPFS)
The three feasibility scenarios, though differing in focus, each assume that the trends of water demands and energy prices will be maintained into the future. In reality, market inflation, population growth and climate change are key drivers which will cause significant fluctuations. The greatest drivers in this study are water demands downstream of Happy Valley Reservoir and energy prices. Whilst it can be deduced that a likely decrease in rainfall from climate change could cause water restrictions to be re-implemented like they were early this century, this was captured by a reduction in magnitude increase of the demand variable.
4.1 Capturing Demand Increases
In 2009, International Consultant KPMG released a report examining future water demands in Adelaide as a result of population growth and two future climate scenarios (KPMG 2009). The report predicts that if demand were to be modelled off population growth alone, by 2050 when the population of Greater Adelaide is predicted to reach 2.08 Million, water demand is expected to increase by 37%. Coupled with SRES climate scenario A2, the demand is expected to grow by a total of 54% by 2050 or 42% for SRES scenario B2.
SRES scenarios are alternative future pathways considering differing developments in energy technologies which have an equal probability of occurrence (IPCC 2018). SRES climate scenario A2 describes a future in which there is a lack of equality on social and economic stance across countries whilst there is a large push to maintain local culture and traditions. SRES scenario B2 represents a future in which there is a motivation towards developing local solutions to economic, social and environmental sustainability.
Although SRES climate scenarios were superseded by RCP scenarios, there is no direct correlation with pathways of the two and no study has been conducted on Adelaide’s water demand since the initial report by KPMG (2009). Therefore, it was decided most accurate to monitor Happy Valley Water Treatment Demands through SRES scenarios.
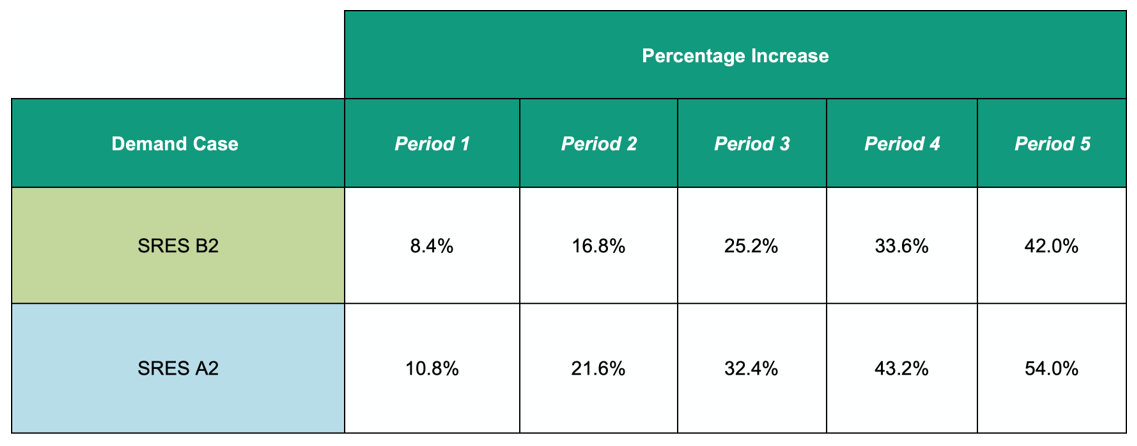
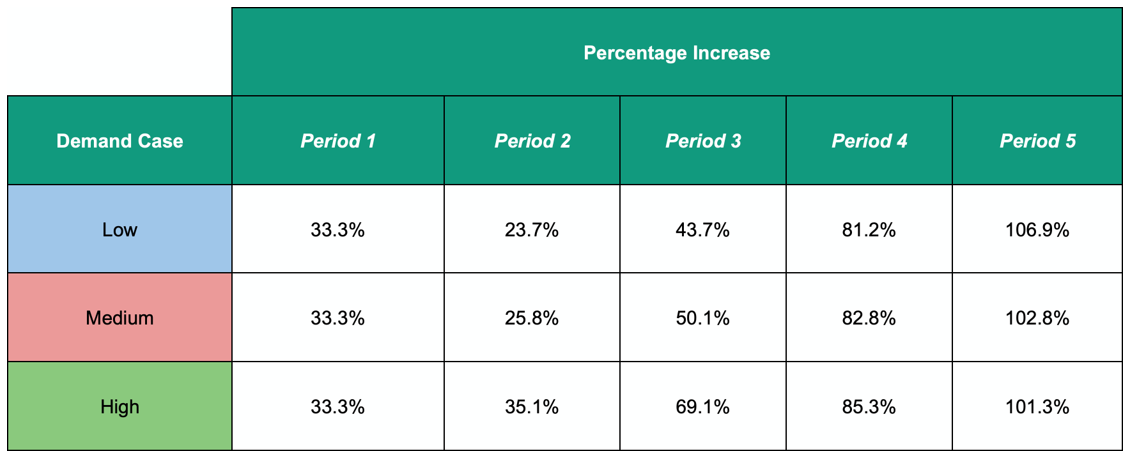
In order to make the altered demands reflective of these projections, the eight years of observed flow data were averaged to produce a singular subset of data spanning 365 days. Increases in water demands were then assumed to follow a linear pattern in five equal periods over the turbine design life. The percentage increase for each period is presented in Table 4.
Table 4: Percentage increase in Adelaide water demands for each period.
The KPMG report also lists possible demand reduction strategies and an analysis of their applicability to a set of social, environmental and economic criteria. Only the strategies aggregating a net positive score were implemented into our model. By calculating the demand savings through conducting a proportion analysis with the Southern Adelaide and Metropolitan Adelaide water demands, a total reduction of 5500 ML was predicted annually. This reduction is assumed to increase proportionally with demand increases across the five periods.
4.2 Synthesising Energy Prices
In 2014, The Australian Renewable Energy Agency (ARENA) released the Australian Electricity Market Analysis Report which explores the likely changes to energy prices over a 25-year horizon (2010-2035).
Brinsmead et al. (2014) from ARENA developed these price prediction changes based on expected national renewable energy targets in Australia (RETs). Two different renewable energy target schemes are examined; a fixed, and a flexible RET. A fixed RET is set as a level of supply or fixed quantity of renewable energy generation. A flexible RET represents fulfilling a percentage of energy generation with renewable sources.
For each of the two, ARENA explored a low, medium and high RET. Each of these represent different levels of electricity demand provided by renewable sources. It was deemed more realistic to go with flexible RETs as in general, South Australia’s renewable energy goals are centred towards having a percentage of total energy generation supported by renewable sources rather than a total output. This is indicative of South Australia’s renewable energy goal of achieving 50% of total energy generation supplied by renewable sources by the year 2025 (ABC 2017).
In the analysis of future energy price fluctuations, the flexible RET scheme was employed for the high, medium and low cases. The percentage increase of energy prices for each period is shown in Table 5
Table 5: Percentage increase of energy prices for each period using the flexible RET scheme.
These percentage increases were applied to the average AEMO prices for each thirty minute period in the eight years of data.
The changes in water demands and energy prices were implemented into a Fortran model as five different time slice inputs and consequently, the model determined the annual profits for each year in each period. Scenario 1 was once again employed for this analysis as it represents the most optimal way to operate the turbine for economic benefits.
- Future Benefits Analysis
The NPV analysis of each of the scenarios offers insight into the long term economic impacts from installation of a mini hydropower turbine.
5.1 Turbine/Site Capital Costs
Turbine Capital Costs
The capital costs for the turbine were obtained by the manufacturer whose turbine characteristics were used in the feasibility scenarios (Tamar Hydro). These costs are for a 3-Jet Turgo turbine and are presented in Table 6.
Table 6: Turgo turbine capital costs for each turbine flow size and the estimated annual maintenance costs associated (Carré 2018) (IRENA 2012).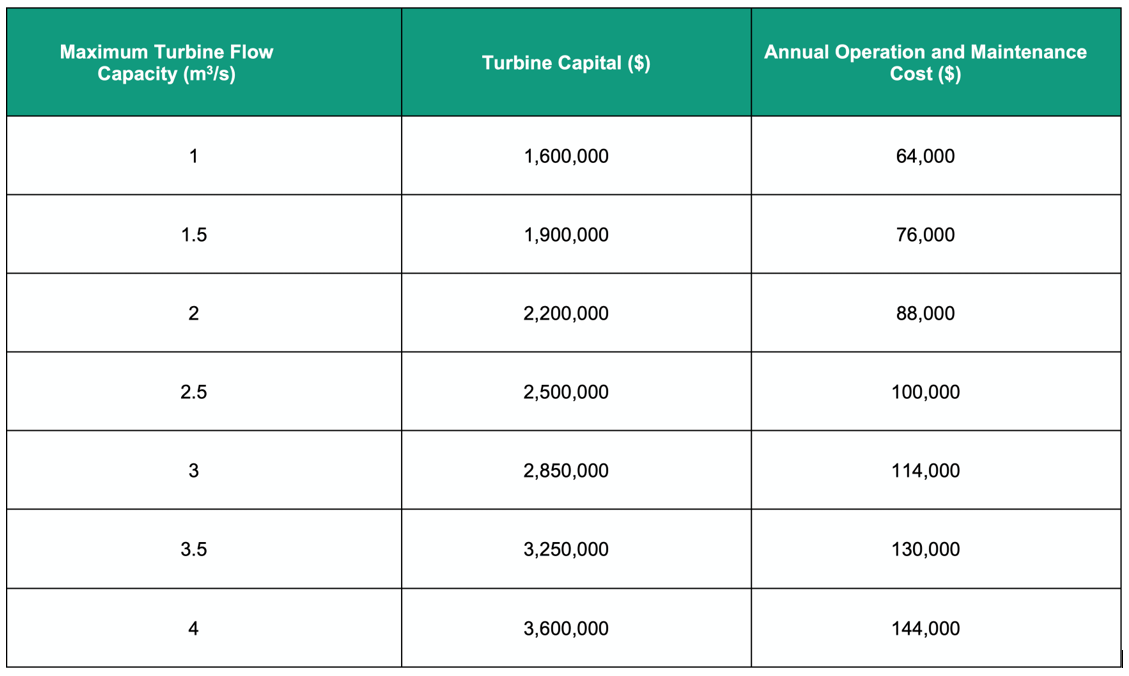
Larger turbines require increased expenditure towards operations and maintenance (O&M) throughout its design life. In order to make a reasonable assumption of these costs, a paper by IRENA (2012) was explored. This paper provides the necessary information for hydropower project O&M costs. According to IRENA (2012), these costs are usually quoted as a percentage of the initial investment cost per kW and are usually between 1 and 4% for mini hydropower projects (IRENA 2012). For conservative measures, 4% of the total turbine capital was selected. The computed O&M costs can be gathered from Table 6 also.
Site Capital Costs
The site capital is site specific and differs for each location according to project construction costs and civil works (including switch rooms, pipework, valves and flowmeter), levies, overhead costs, contractor design and engineering; among other contingencies and insurance costs. For the Hahndorf case study, the site capital was determined to be $4,711,214.
5.2 NPV Analysis
An NPV is used in projects to determine the profitability of a projected investment into the future. For the case of determining the feasibility of mini hydropower, the NPV results in either a positive or negative value. A positive value indicates a profitable outcome from instalment whereas a negative indicates losses over the turbine design life.
A method is used to determine the present value for a stream of costs with a series of fixed payments over the design period of 25 years. This is expressed as Eq. 4 (Simpson 2008).
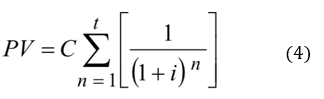
where C is the ongoing payment occuring at the end of each period, n is the number of periods and i is the discount rate. The ongoing payment, C, is the returns that will be provided by the feasibility scenario outputs and the value of n is 25 years representing the project design life.
5.3 Selection of Appropriate Discount Rates
There is great importance in selecting an appropriate discount rate for determining the feasibility of a future project or investment. A larger discount rate produces a smaller present value of a future sum. A discount rate of 6-8% is known as a higher economic focused discount rate, and one less focused on intergenerational equity. This is due to the higher discount on the future present value of the project, which puts more emphasis on the cost and benefits currently rather than the costs and benefits of the future (Simpson 2008). A smaller discount rate allows more focus to be on future benefits from the approval of the project in comparison to its future costs. This means using a more social discount rate allows for more upfront investment on projects today so future generations can be prioritised. This is due to green projects, like mini hydropower, mitigating future impacts from climate change, which reduces our reliance on fossil fuels. For this purpose, not only were the larger, commonly used, discount rates utilised for this paper, but results were compared with a lower, social discount rate. Sir Nicholas Stern of the UK Government recommends using a social discount rate of 1.4% as it takes into consideration both equity and environmental aspects in the decision-making process (Stern 2006).
The decision-maker for a project generally has the final say, and in South Australia, this is usually the Essential Services Commission of South Australia (ESCOSA). ESCOSA currently enforce a discount rate of 4.63% to several South Australian governmental departments.
From this analysis, the discount rates explored for the case study were 1.4%, 2%, 4.63%, 6%, and 8%. From the NPV analysis, the sensitivity of the feasibility of the mini hydropower project was investigated.
RESULTS
The NPV analysis for each of the three feasibility scenarios which consider perfect forecasting using historic trends in water demands and energy prices are displayed in Table 7. In addition to this, the payback period calculated for Scenario 1 was 11.5 years, 12.4 years for Scenario 2 and 7.1 years for Scenario 3.
Table 7: NPV calculated for each feasibility scenario under the constraints of different discount rates.
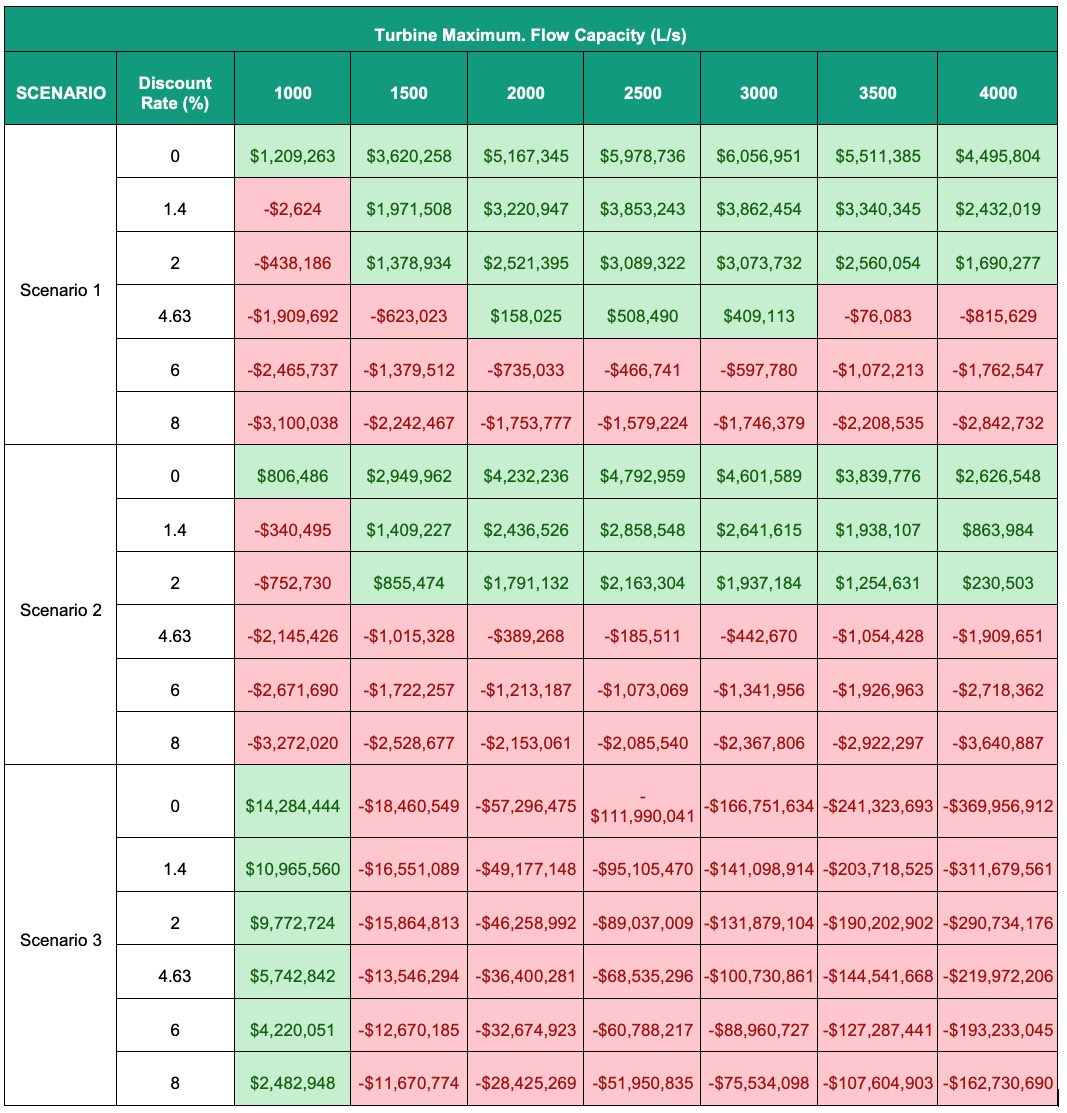
Table 7 shows that the optimal turbine size for Scenario 1 lies on the border of 2500 L/s and 3000 L/s; whereas Scenario 2 is 2500 L/s and Scenario 3 is 1000 L/s. Scenario 1, although recording large annual returns, shows only a positive NPV for discount rates up to 4.63%. Contrastingly, Scenario 2 only shows feasibility up to 2%. Under these values, it is expected that if this technology is decided to be implemented into the MBO pipeline at this location, the operator would have to monitor the AEMO forecasts throughout a day closely to ensure the project is feasible.
Scenario 3 shows significant profits for the smallest turbine size but records significant losses for all other sizes. This implies the pumping costs to Summit Storage are large when compared to the profits from energy generation; despite ensuring pumping occurs in the lowest priced times of the day. Although under this scenario the system can successfully pass additional flows through the turbine, by reflecting on the goals of green projects, one that has a potentially negative impact on the environment should be approached with caution. Passing extra flows in this drought prone semi-arid region of Australia can pose risks to water security by unnecessarily depleting Adelaide’s primary drinking water resource; the Murray River. These increased flows will also cause a disturbance to the natural ecosystem of the Onkaparinga River. For this reason, it is recommended that water be passed through the system only when required for downstream demand.
With Scenario 1 being concluded as representing the method an operator should employ to control the mini hydropower turbine, it is necessary to compare these results with the MPFS explored as it is understood demand and energy price changes are inevitable with the growing population and effects from climate change.
The payback periods for each of the MPFS are all very low and do not differ greatly with values ranging from 4.57 years for the SRES climate Scenario B2 low case to 4.20 years for the SRES Scenario A2 high case. The corresponding NPV results from the economic analysis can be seen in Tables 8 and 9.
Table 8: Economic analysis results under the future scenarios SRES B2 low.
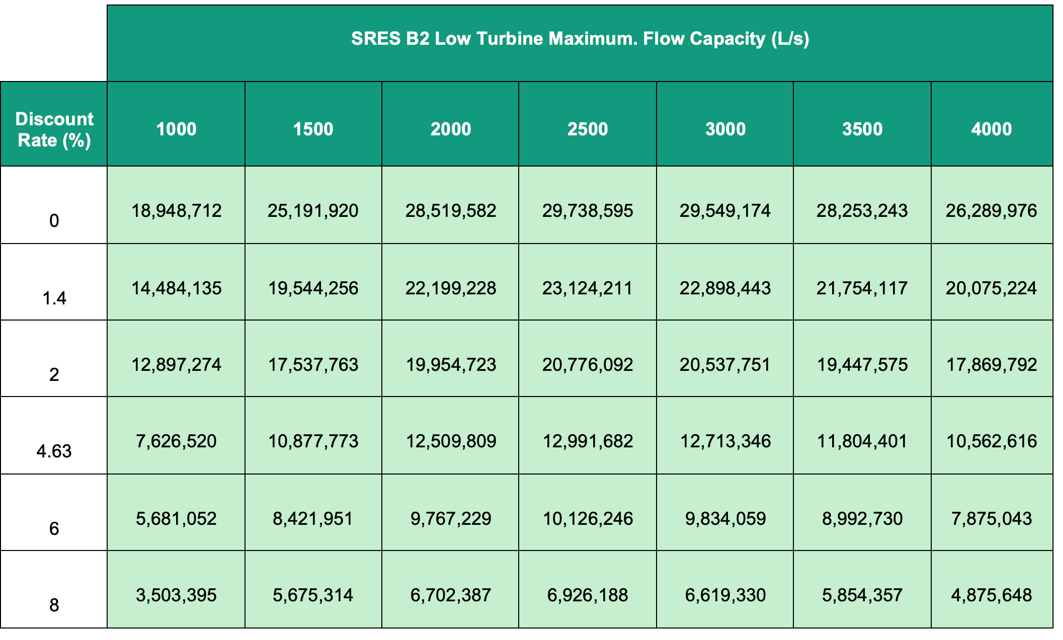
Table 9: Economic analysis results under the future scenarios SRES A2 high.
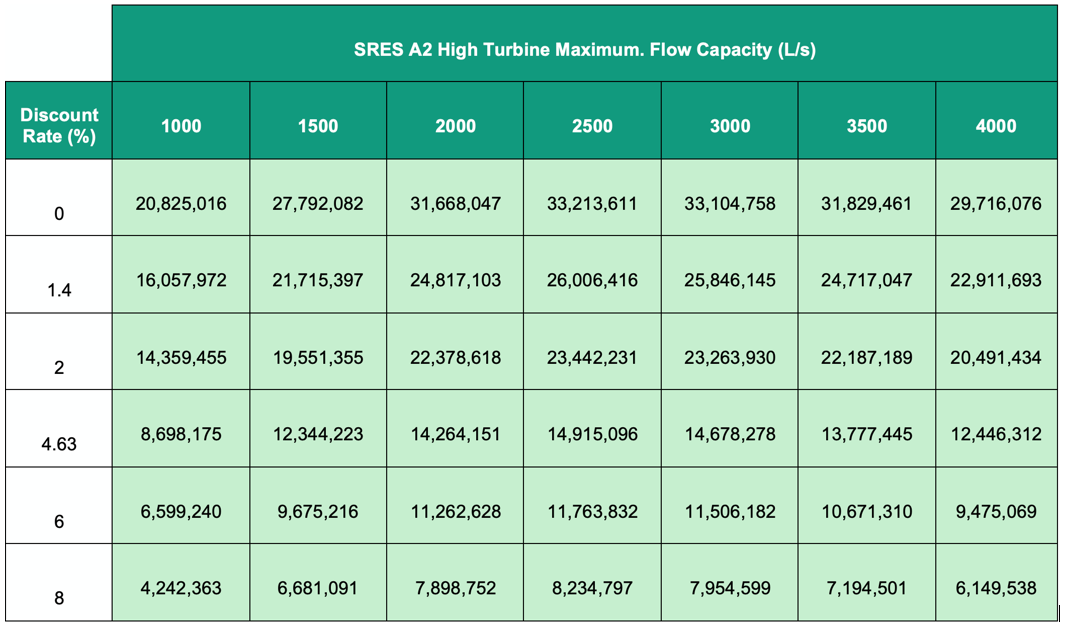
Tables 8 and 9 show the optimal turbine size under both scenarios was 2500 L/s, which is equivalent to the other scenarios explored. This table also shows for an optimal turbine size, if considering the full variation of discount rates and all MPFS analysed, the NPV can range between six and 33 million dollars. Although this range is large, it can be said with near certainty that the project will be cost effective into the future.
This shows the project will have significant positive outcomes environmentally, socially and economically. This renewable energy project reduces our reliance on fossil fuel energy production methods and has minimal impact on the environment as it is being installed in existing pipelines rather than natural river systems. The profits generated from the system provides positive outcomes to society as it not only provides additional employment to the local community but the profits generated can be diverted to other beneficial sectors such as health care and education. Additionally, given the positive results of this technology, the impact from its installation in third world countries can be assessed. Compared to other renewable energy projects, it is relatively cheap and causes minimal environmental degradation given there is existing pipe infrastructure in place. Although the feasibility of this technology is case specific, the results shown from this case study give hope in achieving a green energy future much sooner.
CONCLUSION
This paper explored the feasibility of installing a mini hydropower turbine into a water transmission system at the site of the Hahndorf Dissipator in South Australia.
Through this research, a series of perfect forecasting feasibility scenarios were developed to allow for the operation of the turbine to be manipulated in different ways to replicate reality. Each of these three scenarios were studied with an economic future benefits analysis to determine the long term benefits from the technology over its 25 year design life.
If there was to be no change to current circumstances and historical trends of water demands and energy prices were to prevail, the installation of mini hydropower is feasible in Scenario 1 for discount rates up to 4.63% but only for turbine sizes of 2500 and 3000 L/s. Scenario 1 demonstrated a payback period of approximately 11.5 years. Scenario 2 demonstrates feasibility for discount rates up to 2% and a payback period of 12.5 years only for an optimal turbine size of 2500 L/s. This produces uncertainty with deciding whether or not to implement mini hydropower as a positive NPV at higher discount rates is desired. The selection of the discount rate is dependent on the decision maker or the organisation implementing this technology with the level of risk they are willing to accept and therefore, cannot be suggested here. Scenario 3 displays large feasibility for a turbine size of 1000 L/s. However, given the additional pumping required for optimisation, the fact the project is situated in a drought prone region and the environmental nuisance that may arise, Scenario 3 is not the preferred operating procedure.
When considering the inevitable changes that are to occur over the 25 year design life of the project in terms of downstream water demands and energy prices, all the MPFS displayed promising results. They showed for an optimal turbine size of 2500 L/s, under the full range of discount rates, potential profits can range between six and 33 million dollars which provides assurance of positive returns in all cases. Additionally, under all MPFS, the payback period for the project ranges between 4.4 and 4.6 years.
Through this case study, the implementation of mini hydropower has proven to achieve an optimal equilibrium between environmental, social and economic factors and as a result, brings hope for this technology being widely distributed in water transmission systems globally.
ACKNOWLEDGEMENTS
The authors acknowledge Professor Angus Simpson and Dr. Jinzhe Gong for their continued support over the course of the project. Thanks also goes to SA Water for providing an innovative research opportunity and data contribution.
REFERENCES
Australian Broadcasting Commission (ABC), 2017, ‘Renewable energy target of 50pc reached early in South Australia’, ABC News, viewed Oct 5 2017, <http://www.abc.net.au/news/2017-04-10/south-australia-renewable- energy-target-reached-early/8429722>.
Australian Energy Market Operator (AEMO), 2017. ‘Forecast Accuracy Report 2017’, National Electricity Forecasting Report, viewed October 2017, <https://www.aemc.gov.au/sites/default/files/content//FORECAST-ACCURACY-REPORT-2017-final.pdf>.
Australian Energy Market Operator, 2017, ‘National Electricity Market Fact Sheet, viewed October 25 2018, <https://www.aemo.com.au/-/media/Files/Electricity/NEM/National-Electricity-Market-Fact-Sheet.pdf>.
Australian Energy Regulator, 2017, ‘State of the Energy Market May 2017’, viewed Oct 2018, Commonwealth of Australia, pp. 1-162.
Brinsmead, T, Hayward, J, Graham, P, 2014, ‘Australian Electricity Market Analysis Report to 2020 and 2030’, CSIRO Report No. EP141067, Available at: <https://arena.gov.au/assets/2017/02/CSIRO-Electricity-market-analysis-for-IGEG.pdf>.
Carré, D, 2018, Director at Tamar Hydro. Regular remote meetings from March-July 2018.
Energy Policies of IEA Countries: Australia 2018 Review, International Energy Agency, viewed 25 September 2018.
GreenMatch 2018, Which Factors Determine Solar Panel Efficient?, blog, viewed 2 October 2018, < https://www.greenmatch.co.uk/blog/2014/11/how-efficient-are-solar-panels>.
Intergovernmental Panel on Climate Change 2018, Emissions Scenarios, Intergovernmental Panel on Climate Change, viewed 25 September 2018, <http://www.ipcc.ch/ipccreports/sres/emission/index.php?idp=3>.
International Renewable Energy Agency (IRENA), 2012, ‘Renewable Energy Technologies: Cost Analysis Series’, Hydropower, Volume 1: Power Sector Issue 3/5, Available at: <https://www.irena.org/documentdownloads/publications/re_technologies_cost_analysis-hydropower.pdf>.
International Renewable Energy Agency (IRENA), 2012, ‘Renewable Energy Technologies: Cost Analysis Series’, Hydropower, Volume 1: Power Sector Issue 3/5, Available at: <https://www.irena.org/documentdownloads/publications/re_technologies_cost_analysis-hydropower.pdf>.
KPMG, 2009, Water demand and supply scenarios for Greater Adelaide and the Water Security Plan, KPMG Office for Water Security, viewed 17 August 2018.
Renewables First, 2015, ‘What is the difference between micro, mini and small hydro?’, Renewables First, viewed 31 August 2017, <http://www.renewablesfirst.co.uk/hydropower/hydropower-learning-centre/what-is-the-difference-between-micro-mini-and-small-hydro/>.
Senarath, P, Khaniya, B, Baduge, N, Azamathulla, H, Rathnayake, U, 2018, ‘Environmental and Social Impacts of Mini-hydropower Plants—A Case Study from Sri Lanka’, Sri Lanka Institute of Information Technology Journal of Civil Engineering and Architecture, vol. 1, pp. 1130-1139.
Simpson, A, 2008, ‘Selecting A Discount Rate for Evaluating Water Distribution Projects – The Sustainability Controversy’, 10th Annual Symposium on Water Distribution Systems Analysis, American Society of Civil Engineers, Kruger National Park, South Africa, pp. 1-13.
The World Bank Group 2018, CO2 Emissions(metric tonnes per capita) Data Set, Carbon Dioxide Information Analysis Centre of the United States, viewed 2 October 2018, <https://data.worldbank.org/indicator/en.atm.co2e.pc?name_desc=false&view=map>.
Trading Economics, Australian Inflation Rate, Trading Economics, viewed 27 September 2018, <https://tradingeconomics.com/australia/inflation-cpi>.
Van Dijk, A, et al. 2013, ‘The Millennium Drought in southeast Australia (2001–2009): Natural and human causes and implications for water resources, ecosystems, economy, and society’, Water Resources Research, vol. 49, issue. 2, pp. 1040-1057.
AUTHOR BIOGRAPHIES
Anthony Cox
Anthony graduated from the University of Adelaide in the middle of 2020 achieving an Honours Degree in Civil and Environmental Engineering as well as a Bachelor of Science majoring in Ecology and Spatial Science. Anthony previously worked as an Environmental Engineer in the site contamination industry but is now currently working as a Civil Engineer in the water industry. He is excited about undertaking further innovative projects in the future in order to find sustainable solutions to global challenges.
Amber Smith
Amber graduated with an Honours Degree from the University of Adelaide in Civil and Environmental Engineering in 2018. She is a Postgraduate student at the Australian National University studying a Masters of Climate Change in policy, climatology and economics. Amber began her career as an Environmental Engineer in 2019 and is now a hydrologist specialising in water resources management and major flood assessment. Amber aspires to work in a leading engineering field that considers the impacts of climate change on water resources and natural phenomena.
Share