


Evaluating and Comparing Circular Economy options in Yarra Valley Water’s 2030 Strategy
First published in Water e-Journal Vol 8 No 1 2022.
This innovative project resulted in the development of a circular baseline analysis framework specially adapted for water utilities and identified new opportunities that go far beyond the water cycle impacts and benefits.
DOWNLOAD THE PAPER
Abstract
This paper describes the development and application of a circular economy analysis framework created especially for water utilities, to inform strategy development and implementation. The work was triggered by Yarra Valley Water recognising the need to build in circular economy principles into its 2030 strategy. Drawing upon international best practice in circular economy and sustainability assessment, the framework was used to conduct a pilot circular baseline analysis of the business. The flows of water, nutrients and materials into and out of the business were mapped and evaluated, and the level of circularity of each flow was calculated using the material circularity indicator. Life cycle assessment was used to translate these materials flows into impact on climate change. This combined approach allowed the comparison of a suite of circular economy options that were generated through a cross-business engagement process. The circular economy analysis framework revealed the most meaningful and impactful opportunities among the options, also highlighting trade-offs between different project types. New opportunities to embrace the circular economy were identified that go beyond the water cycle in terms of both impacts and benefits, such as in construction materials and methods. Thorough analysis, alongside successful staff and contract partner engagement, created new ideas and momentum for the circular economy.
Introduction
Strategic Context
The circular economy is a framework that aligns economic and environmental interests by retaining maximum value in products, components and materials. This is achieved by establishing systems in which assets and products are designed to last longer; be shared, repaired, repurposed and remanufactured; and only after several ‘lives’ be recycled to recover materials.
While governments around the world have used policy to transition towards more circular economies for decades, it is a relatively new concept in Australia. Japan ratified its ‘law for the promotion of efficient utilization of resources’ in 2000. China passed its ‘Circular Economy promotion law’ in 2008 to improve industrial production and address the environmental and health impacts of rapid industrialisation. The European Union introduced its first Circular Economy package in 2015, with the Netherlands commiting to being fully circular by 2050.
Until recently, China was the major destination for most of Australia’s recyclable waste. This however ended abruptly in 2018 when the Chinese government restricted imports of 24 types of solid waste and introduced stringent contamination thresholds that the Australian recycling system was unable to meet.
Since then the Federal Government has updated the National Waste Policy under the banner of ‘less waste, more resources’. In August 2019, the Council of Australian Governments agreed to ban the export of waste plastic, paper, glass and tyres, while building Australia’s capacity to generate high value recycled commodities and associated demand. The Victorian Government released its Circular Economy policy and action plan ‘Recycling Victoria: a new economy’ in 2020.
Yarra Valley Water (YVW) recognised that to meet its 2030 strategic objective to deliver a healthy ecosystem, it needed to adopt a ‘regenerative’ mindset - recognising that meeting compliance is not enough to prevent environmental degradation. The ‘regenerative’ approach means looking more holistically at impacts and opportunities. YVW identified that to enact this change it needed to focus on three areas, namely: ‘Beyond zero carbon’, ‘Healthy Ecosystems’ and ‘Circular Economy’. A key point to note is that this commitment was developed together with the Board and is integral to how the utility undertakes its core business, rather than an add on. The goal is to embed circular economy into the business, across operations, design and delivery.
Yarra Valley Water is not alone in the ambition to embrace the circular economy: In 2020, the Water Services Association of Australia (WSAA) has correspondingly produced a paper to guide water utilities to unlock the circular economy to better manage resources, make and use products and to regenerate natural systems; Jazbec et al (2020). Icon Water were recently recognised with the Banksia award for their “No opportunity wasted” work in circular economy, that addresses waste creation, resource reuse (biochar, agri-ash, spoil) and use of recycled materials in construction (Icon Water, 2021).
Method
The circular economy is an emerging concept and its application in an organisation of YVW’s size and complexity is challenging. While much work is underway around the world, there are not yet accepted methodologies for measuring and applying circular approaches in the water sector.
To understand where the water utility can have the biggest impact through applying circular economy approaches, a circular baseline analysis was applied using material flows analysis, life cycle assessment and the material circularity indicator (Ellen Macarthur Foundation, 2015). This baseline framework and process resulted in a shared understanding of what circular economy means to a water utility, and how it translates into action at both strategy and project levels.
A collaborative process was undertaken between April and July 2020 to develop a circular baseline analysis. The project team workshopped results with a multidisciplinary group of professionals operating across the business, including two key construction partners.
The flows of the following three significant value streams were modelled through the business (based on 2019 data):
- Water: From an urban metabolism perspective, water is the largest mass that flows into and out of a city. It is a limited resource, that uses considerable energy to distribute and treat, and it can carry both precious materials to be captured, and potential pollutants to remove from natural systems. As a water authority, it is imperative to understand circular flows of water through water supply, use and disposal via wastewater treatment.
- Nutrients: Water treatment is the source of one of the biggest leakages of nutrients out of the economy, alongside agriculture and food waste. The flow of nitrogen was modelled as a proxy for all nutrients: from the production of nitrogen fertilisers, through the food cycle, to the sewer, and the eventual treatment of sewage.
- Materials: As a first step toward understanding all material flows, material flows associated with the company’s pipe network were modelled: from the original extraction of raw materials, the installation of pipes and use of bedding materials, through to the management of spoil.
The purpose of the material flow analysis is to understand how these key elements—water, nutrients and materials—flow through the water utility and beyond, considering stakeholders and uses both upstream and downstream.
The bespoke assessment framework in Figure 1 was used to understand the relative circularity of each of these value streams, incorporating the following evaluation methods:
- material flow analysis (MFA) to map how water, nutrients and materials flow through the water utility
- evaluation of circularity using the material circularity indicator (MCI)
- life cycle assessment (LCA) to translate mass of materials into impact on climate change.
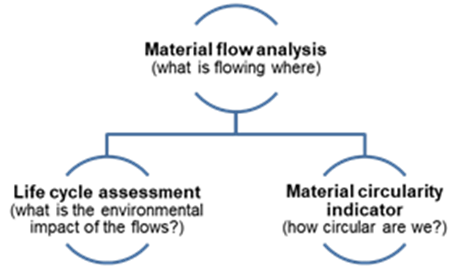
Figure 1: Preliminary circularity baseline analysis framework
The Ellen Macarthur Foundation’s Material Circularity Indicator (MCI) (2015) calculates a ratio between the ‘circular’ part of the flow (the proportion of a product coming from reused or recycled sources), and the total flow (which includes both ‘circular’ and ‘linear’ flows such as virgin materials and landfilled wastes).
Calculation of the MCI for the flows of water and materials considers:
- reused/recycled water and materials used as inputs
- outputs that go on to be reused or recycled
- increased functionality through improved material efficiency per unit of service (for example, delivering the same amount of water services through less water via successful demand management strategies).
Nutrients were treated differently as they are not a resource that is used by the water utility, rather they come into the system as a “pollutant” to be treated. Hence, only outputs were considered in the calculation of the nutrient MCI.
Baseline results were workshopped to identify nine potential opportunities for the water utility to contribute to the circular economy, which were analysed according to potential climate change benefits, circularity impacts, barriers and engagement potential.
Impacts on climate change for the nine opportunities were estimated using Life Cycle Assessment (LCA) according to ISO 14040 ISO 14044 (International Organization for Standardization, 2006). Life cycle calculations of climate change impacts of each opportunity drew upon prior studies undertaken for the water utility, published studies and Australian and international LCA databases.
Results
An overview of the mass of the three value streams explored in the pilot study is provided in Figure 2. The flow of water is so preponderant, that the graph is in logarithmic scale.
Exploring material flows in terms of mass does not consider the impacts of different materials on the environment and their relative value. Life cycle assessment has also been used to represent the impact on climate change of each material stream, as shown in Figure 3.
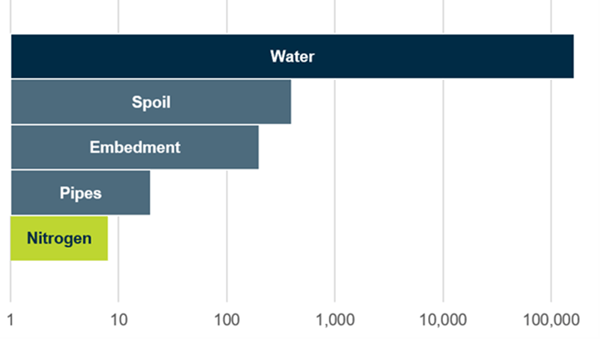
Figure 2: Mass of most important value streams through Yarra Valley Water, 2019 (tonnes).
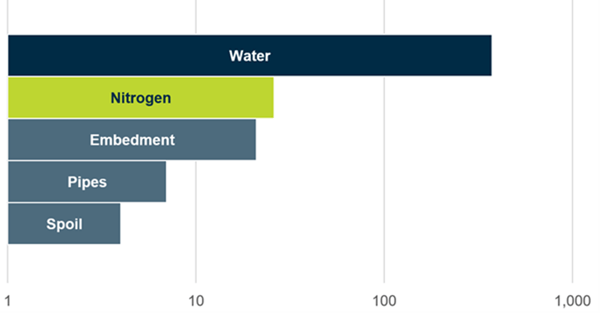
Figure 3: Climate change impact of most important value streams through Yarra Valley Water, 2019 (tonnes CO2e)
While water remains the most important flow when considering climate change impact, nitrogen and spoil swap positions between second and last priority.
The baseline Material Flow Analysis for materials, water and nutrients are presented in Figures 4, 5 and 6, respectively. They show how each value stream flows through YVW and beyond, considering stakeholders and users both upstream and downstream.
Materials
The analysis of the manufacture and installation of all pipes in YVW’s network based on mass is shown in the left diagram of Figure 4. Products associated with excavation and bedding are so dominant when only considering mass that the pipe materials themselves are barely visible. The climate change lens provides a useful indication of the environmental value of different materials for decision making (see Figure 4, right).
These results show that while the emissions associated with aggregates and spoil remain substantial, pipe material and production become more significant when considering their impact on climate change rather than purely mass flow.
Figure 4 also shows that while there is considerable recycling of materials, this has only minimal impact on GHG emissions reductions as the material recovery takes some effort, and the manufacturing impacts are not recovered. Likewise, the impact of materials to landfill is minor due to their inert nature.
This highlights the importance of considering the environmental impacts of materials coming into the system first and foremost. Focussing on waste management approach to become more circular would somewhat miss the point.
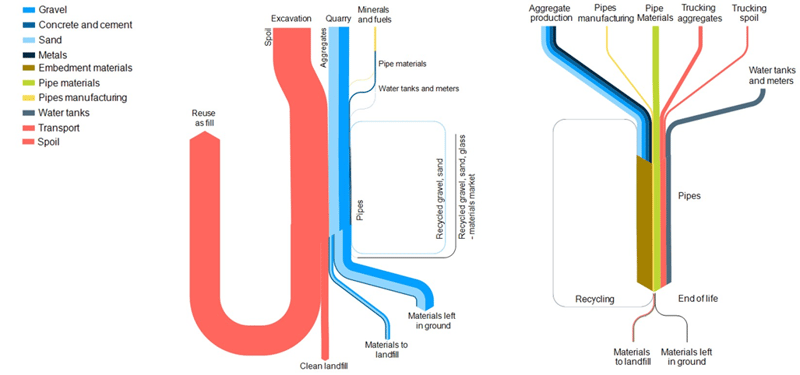
Figure 4: Material flows associated with pipe manufacture and installation for Yarra Valley Water, 2019 (left in tonnes of material, right in tonnes of CO2e)
The preliminary estimation of the MCI of YVW’s material flows is approximately 2.5%. This evaluation considers pipe and embedment materials only and includes considerable estimates on the proportion of recycled materials used as this data is not systematically collected.
On the input side, embedment materials from recycled sources include gravel, sand and glass. Overall, around 2.4% of input materials are estimated to be from recycled sources, based on current information available.
Regarding outputs, the majority of materials are considered to be left in ground, with 10% of pipe and embedment materials that are dug up estimated to be reused or recycled. Overall, only 2.6% of outputs are considered circular. Data on this side of the flow is more reliable at this stage.
Spoil was excluded in the analysis as it is neither a scarce resource, nor does it have a high environmental impact when landfilled. The high natural level of reuse of spoil would distort the results.
Water
Figure 5 shows the flow of water through customers, the upstream supply of this water and the downstream use. YVW’s catchment water supply comes essentially via another company, Melbourne Water—hence water flow through the two organisations is key to understanding circularity of the system.
The average water supply profile from Melbourne Water has been proportioned to YVW’s demands for the mass flow analysis:
- traditional catchment-sourced water is the greatest component
- water from desalination has a high energy cost, and impact on climate change
- while not directly used by YVW, a portion of Melbourne Water’s reuse program has been included in the analysis to show the importance of this ‘circular’ source, in the same way that a portion of desalinated water is included.
Water is then delivered by YVW to businesses and residents, whose usage profiles are included in the analysis. Home water tanks are considered as a separate source of ‘circular’ water flows here.
The sewerage system is mapped through both YVW and Melbourne Water’s collection and treatment networks. Most of YVW’s sewerage outflows to Melbourne Water are discharged to Port Philip Bay and Bass Straight with a small portion for land application.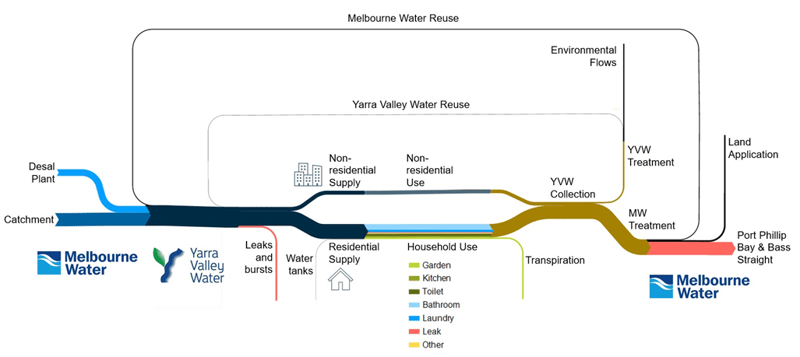
Figure 5: Water flows through Yarra Water Valley, 2019 (ML)
Our preliminary assessment indicates that the MCI of water flows is currently 12%.
On the input side, 2.4% of water supply is currently considered as circular. This includes the recycled water delivered to customers through third pipe systems, and water captured by home tanks.
Circular use of sewerage collected is higher at 21.5%. This beneficial reuse includes recycling schemes, land application and environmental flows. Land application and environmental flows can be likened to ‘open-loop’ recycling: while the water is not feeding directly back to residents and businesses, it is creating value in the environment and in agriculture.
Nutrients
Nutrients are a critical issue for the circular economy. As a precious resource for agricultural systems, their loss to air, landfills and receiving waters is a massive economic and environmental waste. They are also problematic as pollutants in water bodies.
The Stockholm Resilience Institute highlights that the overuse and wastage of both nitrogen and phosphorous have both passed the planetary boundary conditions (Steffen et al. 2015). Declining stocks of these nutrients (particularly phosphorous) increase the price of fertilizers – hence the price of agricultural production. Wasted nutrients end up in aquatic systems potentially changing species compositions and causing algal blooms and other ecological damage.
While both nitrogen and phosphorous are present in the system, nitrogen has been used in this material flow analysis as an effective proxy, recognising that the amounts of nitrogen and phosphorous are correlated.
Figure 6 shows the pathway for how nitrogen gets from the industrial system into agriculture, food and then eventually into customers’ sewer. From here, the fate of the nitrogen through wastewater treatment both at YVW and Melbourne Water is tracked.
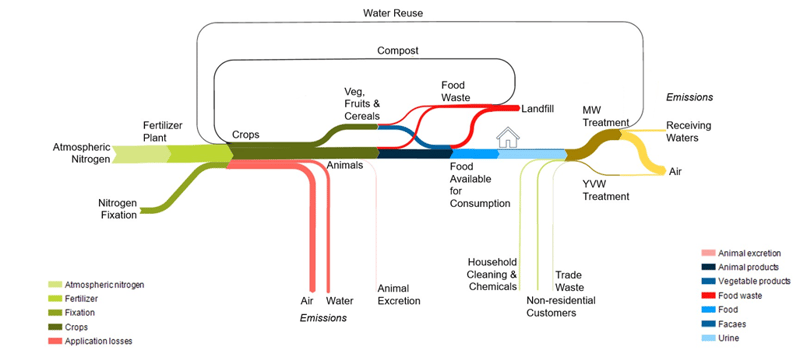
Figure 6: Nutrient flows through Yarra Valley Water, 2019 (tonnes of nitrogen)
From a circularity perspective there are two reuse loops; one from composting of food waste and the second from the reuse of water to agriculture and soils.
The three most important losses of nutrients are:
- losses to air and water during wastewater treatment (46%)
- emissions to air and water during agricultural production (39%)
- food waste going to landfill (15%).
The calculation of the circularity of nutrient flows only considers regenerative flows of nutrients leaving YVW’s treatment plants and the benefits of food waste treated at YVW’s ReWaste facility at Wollert. As nutrients are not a resource used to deliver YVW’s services, the input side of the MCI calculation is irrelevant.
The MCI of nutrient flows was evaluated at 6.6%.
Circularity Opportunity Identification and Assessment
The results of the preliminary baseline and research into best practice circular approaches were workshopped with a multidisciplinary group of 29 professionals operating across the utility, including key construction partners.
The purpose of the workshop was to engage key stakeholders in understanding the importance of the circular economy to YVW’s future, and identify circular strategies and actions for further exploration.
The circular economy is a complex concept requiring the application of systems-thinking. The opportunities included a mix of tangible actions that could be implemented quickly, longer term projects that are more cutting-edge, projects that result in big greenhouse gas emission savings, and those that win hearts and minds.
Nine opportunities were explored from increasing home water tanks to changing procurement processes. Potential benefits, barriers and who should be engaged were discussed for each opportunity. Where possible, the potential benefits were evaluated according to impact on the relevant material circularity indicator(s) and impact on climate change, as shown for three of the opportunities in Table 1.
Opportunity 1: Increasing water recycling and reuse looked at overall shifts required to improve the circularity of YVW’s water flows by (i) increasing Melbourne Water’s reuse into ‘third pipe’ systems from 5% to 50%, (ii) expanding land application of residual water flows out of Eastern and Western treatment plants from 11% to 50% and (iii) rolling-out more third pipe systems for YVW customers based on water recovered from wastewater treatment plants, or stormwater retention and recovery, increasing the percentage of customers with third pipes from 3.4% to 15%.
The use of Class A water for garden applications and the recycling of water to agricultural land have the double benefit of recovering the value of the water and recovering the residual nutrients in the recycled water. In Europe’s 2015 circular economy package, reuse of water in agriculture was underlined for its contribution to nutrients recycling and substitution of solid fertilizers (Steffen et al. 2015).
Opportunity 2: Using recycled materials in pipe bedding involved taking advantage of the increased availability of materials in the Melbourne area, and the increased acceptability of this practice following considerable pilot projects in civil works. This practice is particularly supported by Victoria’s circular economy strategy ‘Recycling Victoria’ (2020).
This scenario assumed that approval for recycled aggregates is extended to all pipe systems, and not only sewer pipes as is currently the case. Modelling involved increasing the use of recycled sand from 0.5% to 20%, recycled crushed glass from 1%to 20% and recycled aggregate from 2% to 20%.
Opportunity 3: Innovating in construction methods looked at increasing horizontal directional drilling (HDD), to reduce the impact of soil excavation during installation as highlighted in the material flow analysis. By drilling through the ground rather than excavating, HDD avoids the energy use and import of material to achieve the right level of compaction after laying. It is commonly used in built up areas to avoid the disruption and costs of excavating through pavements and areas that are environmentally sensitive or of cultural heritage value. HDD is more costly than the conventional open-cut excavation technique. Other trenchless technologies (such as micro-tunnelling) could also be explored.
The construction methods scenario explored increasing the uptake of HDD in construction for water pipes from 15% to 80% and sewer pipes from 50% to 80%.
|
|
Climate change |
MCI of water flows |
MCI of nitrogen flows |
MCI of material flows |
|
Current performance |
- |
12.0% |
6.6% |
2.5% |
|
Increasing water recycling and reuse |
19,000 |
á 40.8% |
á 13.0% |
- |
|
Using recycled materials in pipe bedding |
2,000 |
- |
- |
á 15.4% |
|
Innovating in construction methods – horizontal directional drilling |
8,500 |
- |
- |
á 6.4% |
The detailed results of this study are recorded in Lifecyles (2020).
Discussion
The circular baseline analysis results provided valuable insight into:
- the relative importance on water, nutrient and material flows for the circularity of a water utility
- relative benefits of implementing different strategies with regard to ‘circularity’ and impact on climate change
Recommendations were made for integrating circular approaches, including:
- Tracking flows of materials and implementing systems to measure impacts
- Further pursuing circular opportunities that appear beneficial in the study, and beginning investigation in other areas identified during the process
- Shifting culture through working collaboratively and training
The process of co-designing the circular baseline analysis framework, and engaging across the organisation to identify meaningful projects has increased capacity on circular economy approaches in a practical way. Through active participation, the project team laid a strong foundation for culture change to tackle the systemic shift required to achieve a circular economy.
Since the circular baseline analysis in 2020, opportunities for applying circular economy are systematically identified and investigated with a high level of staff engagement, for example:
- YVW is working with contractors to integrate use of recycled and reprocessed materials and those with a lower carbon footprint in construction and maintenance practices.
- New measures to better track the use of recycled materials, and waste and recycling are being tested and implemented.
- Tender documents reflect YVW’s ambitions in the circular economy space, and contractors continue to positively surprise YVW with new initiatives and ideas that embrace the circular economy (for example one maintenance partner has teamed up with a local manufacturer to develop a protective ramp over temporary water pipes that is made from recycled tyres, phasing out the current plastic ramp).
- YVW are analysing how much more of the water and nutrient resources from treatment plants could be recovered, for example as part of adaptive pathways planning for the renewal of one of the major treatment plants.
- The high-level analysis of carbon in construction is being assessed in more detail by determining a carbon baseline of multiple projects in the design-phase.
- Together with delivery partners we kicked off a pilot on dewatering and reusing spoil that was dug out to replace pipes and would otherwise be destined for landfill under current regulations.
- YVW has started monitoring more closely the circularity of the water cycle across their own operations, for example by metering the use of stormwater and rainwater on our main office site.
- An employee engagement program for the circular economy and other environmental matters has commenced and has led to the emergence of several additional circular economy initiatives that are now at business case development stage.
Conclusion
The circular baseline analysis showed that while the biggest opportunities to contribute to a circular economy are in the water cycle (in terms of mass flows and climate change impact), there is great and immediate potential in choosing alternative embedment materials and scrutinising construction methods for their climate change impacts.
The biggest strides can be made if project managers from across the business and contract partners are on board, and the opportunities are explored together.
While pilot-tested with Yarra Valley Water, the circular baseline analysis framework designed during this project is suitable for all water utilities.
References
Ellen Macarthur Foundation (2015) Circularity indicators: An approach to measuring circularity.
Icon Water 2021. Press Release 25 March 202. Icon Water wins Bank...~https://www.iconwater.com.au/Media-Centre/Media-Releases/2021/March/24/banksia-award.aspx, accessed 27/10/21
International Organization for Standardization (2006). International Standard, ISO 14040, Environmental Management Standard- Life Cycle Assessment, Principles and Framework.
International Organization for Standardization (2006). International Standard, ISO 14044, Environmental Management Standard- Life Cycle Assessment, Requirements and Guidelines.
Jazbec M, Mukheibir P and Turner A. (2020) Transitioning the Water Industry with the Circular Economy, prepared for the Water Services Association of Australia, Institute for Sustainable Futures, University of Technology Sydney, September 2020
Lifecyles (2020) Circular economy analysis and opportunities for Yarra Valley Water. Internal report.
Smol M, Adam C, Preisner M. Circular economy model framework in the European water and wastewater sector. Journal of Material Cycles and Waste Management. 2020;22(3):682-97.
Steffen W, Richardson K, Rockström J, Cornell SE, Fetzer I, Bennett EM, et al. (2015) Planetary boundaries: Guiding human development on a changing planet. Science.;347(6223):1259855.
The State of Victoria Department of Environment L, Water and Planning (2020). Recycling Victoria: A new economy.
Author Biographies
Lisa Ehrenfried | Lisa leads Yarra Valley Water’s Circular Economy program, and is in charge of YVW’s Climate Resilience Plan development and implementation. She previously worked as manager for research and innovation at the Water Services Association of Australia, in integrated water planning in the Victorian State Government, and as project engineer at Yarra Valley Water. Lisa is a fellow of the Peter Cullen Trust and has a Masters in Mechanical Engineering from Technical University of Munich and a PhD in Materials Science from the University of Cambridge.
Francis Pamminger | Francis Pamminger is the Manager of Strategic Research at Yarra Valley Water. He has over 40 years’ experience in the water industry. His contribution to the water industry has been recognised with two Research Excellence Awards (in 2008 and 2010) by the Sustainability Specialist Group of the International Water Association.
Tim Grant | Tim has worked for two decades in LCA from a background in mineral process engineering and then waste management consulting. He was the founding president of the Australian Life Cycle Assessment Society (ALCAS) and is a pillar of the international Life Cycle community internationally through his involvement with the UNEP/SETAC Life Cycle Initiative, ISO standards development committee for ISO14048 and the Forum for Sustainability through Life Cycle Innovation.
Jodie Bricout | Jodie is one of Australia’s leading circular economy experts, with two decades’ experience working alongside research, government and industry in Australia, Dubai and Europe. In addition to her roles at lifecycles and the University Adelaide, Jodie is a board member of NSW Circular, and member the expert advisory group for the Victorian Government's Circular Economy Business Innovation Centre and the Australian Circular Economy Hub metrics working group. She is also a certified Life Cycle Executive and is currently undertaking a PhD on higher-value circular economy approaches at the University of Adelaide.
Share