


Driving innovation by measuring affordability

DOWNLOAD THE PAPER
Abstract
Measuring affordability can provide a water utility with direct benefits. It can be used to identify and support customers experiencing financial stress and also be a driver for innovation. Affordability is the ratio of cost to disposable income.
With more customers now having difficulty paying their water bills, it is important that the industry better understands the impact of its bills on household finances. Particularly, as water affordability is a recommended indicator for Australia’s performance measure against Sustainable Development Goal No 6, to ensure we are ‘not leaving anyone behind.’
At an aggregate level, Yarra Valley Water (YVW) has improved affordability over the last eight years. However, when the data is disaggregated into the lowest income group (those below the fortieth percentile), we notice an increase in households in this cohort experiencing financial water stress rising from 26% to 34% over the same period. Identifying where these customers are and identifying the unique characteristics of such groups allows a utility to better design assistance programs.
Committing to provide water services at a constant affordability ratio could stimulate innovation since all future service advancements would need to be supplied without increasing relative price to customers and especially those most vulnerable to price rises. This mirrors a dynamic that occurs in the market place.
Introduction
This study focusses on two key questions. Firstly, with financial stress to meet utility bills becoming a major societal problem, Yarra Valley Water wanted to make sure that it wasn’t adversely impacting this wellbeing pressure. This is a view shared by Yarra Valley Water customers, who asked the company to do more to help financially vulnerable customers. The hypothesis was that if Yarra Valley Water could gain a deeper understanding of who these customers are and how to reach them, they could then provide better targeted assistance. And secondly, Yarra Valley Water wanted to explore if they could replicate market drivers, where product innovation has to be found at the same time as keeping prices down.
Like many other water utilities, Yarra Valley Water’s purpose is to contribute to the liveability of its customers. While it is easy to conceptualise the health benefit of providing safe water and sanitation, Yarra Valley Water is looking at how to deliver services that further contribute to liveability for customers. Financial stress is known to correlate with diminished quality of life, so it was concerning when an internal survey in 2018 identified that 47% per cent of Yarra Valley Water’s customers had trouble paying a utility bill in the past 12 months. Yarra Valley Water wanted to make sure that they were not exacerbating this.
The utility’s customers requested that more should be done to help financially vulnerable customers. This was specifically drawn out through a Citizens Jury process that asked customers to determine what balance of service and prices they expected from Yarra Valley Water in their five-year Water Plan; as summarised in YVW (2017).
The notion of affordability has been made more transparent in the Sustainable Development Goals (SDGs), with the introduction of this as an indicator into the measurement of the water goal (SDG 6). Yarra Valley Water has made a public commitment to the SDGs.
Accordingly, Yarra Valley Water has translated its customer request into a business commitment to connect with a total of 150,000 financially vulnerable customers by June 2022 to make them aware of help available. To achieve this, Yarra Valley Water programs could be significantly enhanced with a better understanding of the spatial and temporal distribution of these customers.
And finally, Yarra Valley Water was interested in exploring whether it could synthesise the attributes of the market place. Specifically synthesing competition to keep prices down while at the same time needing innovation to differentiate product offering.
For example, when analysing the car industry over the last 60 years (as shown in Figure 1), prices have stayed relatively stable compared to income. Yet over the same period of time the industry has delivered a broad range of service advancements including the addition of bucket seats, seat belts, disc brakes, sound systems, air conditioning, air bags, and GPS navigation systems, to name a few.
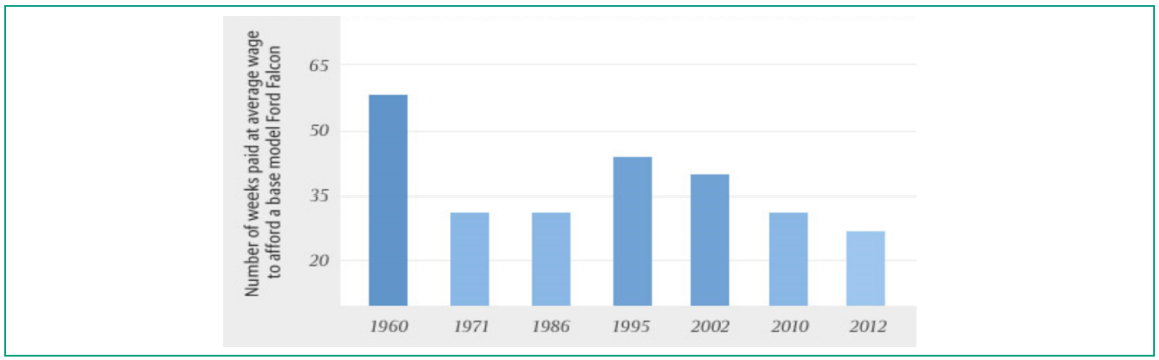
Figure 1: Affordability of the Ford Falcon since 1960; ABS (1996)
Method
A widely used approach to measure and monitor the impact of a product or service is to measure the affordability of the product to a customer. Affordability in this context is the ratio of water bill to income. Disposable income was chosen as the better income measure, as this is the actual purchasing power of a customer. The benefit of such a ratio is that it is directly linked to how it impacts a customer, and therefore independent of differences in inflation, wages, and manufacturing costs. An example of how affordability is already measured in Australia is housing affordability. Arundel et al (2017) showed how this could be spatially mapped in the Australian capital cities to compare actual performance with policy objectives.
Affordability is also widely used internationally, to measure energy and water affordability, for example. Threshold rates are used to highlight when customers are considered to be experiencing financial stress.
A summary of different threshold rates used around the world is provided in Table 1. This table is shown for three reasons. Firstly, to highlight that the concept of affordability is already extensively used internationally. Secondly, it varies between countries, hence each country needs to select what is most appropriate to its own unique situation. And finally, some countries even go as far as enshrining threshold targets into law requiring utilities to supply their service under that specific target. Examples of these include Lithuania (2%), Northern Ireland and France (3%), Venezuela (4%), Chile and Kenya (5%) and Mongolia (6%).

Table 1: Benchmarks used in measuring affordability (in percent of total household income / expenditure).
Fankhauser et. al. (2007).

Figure 2: Affordability stress (measured as percent of customers paying more than 3% of their disposable income for their water bill), for each percentile of disposable income
It is also common to evaluate these thresholds at specific disposable income amounts. This recognises that customer income level is important. For example, those on high incomes are unlikely to experience any financial stress from utility bills, while those who have low income may experience extreme impacts. A commonly adopted disposable threshold is the fortieth percentile, which is considered to capture the majority of those who are susceptible to financial stress from utility bills. The affordability ratio for Yarra Valley Water customers in each percentile is shown in Figure 2. This data confirms the theory recommending that the fortieth percentile represents a suitable threshold to measure affordability since it captures the majority of those experiencing financial water stress.
Plans are also in place to monitor the affordability of water services in Australia as part of the Sustainable Development Goals (SDGs) initiative. This work is being coordinated by the National Sustainable Development Council (NSDC). The NSDC is a collaborative body that brings together experts across a breadth of domains relevant to the SDGs that draws on member experiences across government, business, research and civil society. A copy of the recommended affordability indicator from the National Sustainable Development Council (2018) is shown in Figure 3. The principle is that universal and equitable access to safe and affordable drinking water should be available to all.

Figure 3: How water affordability stress monitoring is being incorporated into SDG 6 in Australia, The National Sustainable Development Council (2018)
While conceptually simple, calculating affordability at a household level is made more complicated because of the difficulty in accessing the required data. While Yarra Valley Water has access to individual household water bill data, it does not have the associated disposable income. This study had to build a dataset using the Yarra Valley Water individual billing data and join simulated values to estimate disposable income.
Disposable income had to be modelled, and the values micro-simulated, as they are not published at a unit level and also are not available for each year and each location of interest. The Australian Bureau of Statistics (ABS) only publishes total income at an aggregate level to protect the confidentiality of individuals. The aggregated data represents local communities and suburbs. These can range in size between 2,000 to 25,000 people with an average of around 10,000 and is described as an SA2 scale. Other scales of ABS data include the smaller SA1 (measuring data at a neighbourhood level, averaging 400 households), and larger scales of local government area, statistical local area, state and national level.
The model for the disposable income data came from three sources:
- SA2 Selected Medians and Averages, for 2011 and 2016 Census (total income)
- National Centre for Social and Economic Modelling (NATSEM) SA2 OECD Indicators: Income, Inequality and Financial Stress, 2011 (disposable income)
- ABS Housing and income surveys (SIH): 2011-12,
2013-14, 2015-16 (unit level disposable income for greater Melbourne)
We used the SA2 level of aggregation as that was the finest level of data published by NATSEM.
We used these three data sources to obtain a disposable income distribution for each SA2 for each year from 2010 to 2017, and then simulated from these distributions to obtain disposable income values for each quarterly bill for each household.
From the 2011 and 2016 censuses we were able to estimate median total income for each year for each SA2 by interpolating the intervening years. From NATSEM we obtained median disposable income for 2011 and were able to work out the relationship between disposable and total income, thereby inferring median disposable income for each SA2 for each year. This was possible because we found a very high (r = 0.984) correlation between disposable income and total income.
Once we had the medians we had to estimate the means and standard deviations to obtain a distribution to sample from. For that we used the SIH unit level data for greater Melbourne, and transformed these to the desired median, then transformed these to an approximate normal distribution. We then simulated from these normal distributions and inverse transformed to obtain the quarterly disposable income figures for each household.
Further details of the methodology are provided in Melbourne eResearch Group (2018).
Results
A comparative analysis of affordability was undertaken at the SA2 level over the last eight years. The objective was to analyse temporal and spatial variability. We wanted to identify if water bills were causing greater financial stress for Yarra Valley Water customers.

Figure 4: Mean water affordability of Yarra Valley Water customers per year
At the highest aggregated data level of averages, affordability (calculated as the ratio of total water bill for the business area divided by the total disposable income for the same business area), we noted an improvement, dropping from 2.3% in 2010/11 to 1.7% in 2017/18 (Figure 4). This also compares well against a commonly adopted international threshold of 3%, above which customers are considered to experience water affordability stress. However, when we disaggregate the analysis into different income categories, we see an increase in affordability stress for the lowest income groups. For example, when we analyse Yarra Valley Water customers whose disposable income is in the lowest fortieth percentile, we notice an increase in numbers above the water stress threshold of 3%, rising from 26% to 35% over the same period (Figure 5).
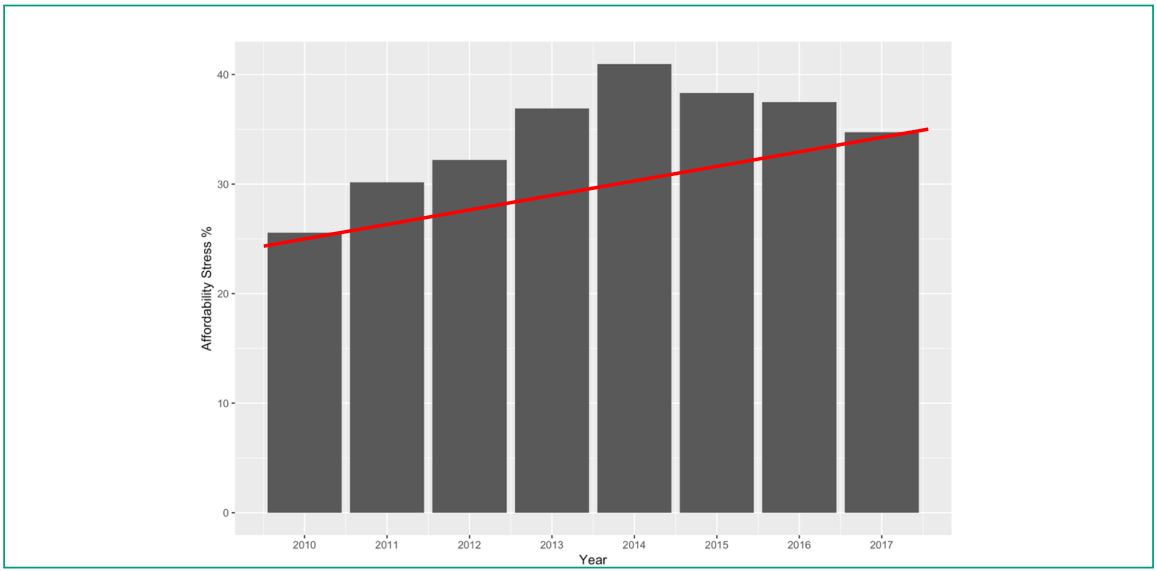
Figure 5: Affordability water stress of Yarra Valley Water customers whose disposable income is in the bottom 40%
Analysing the spatial distribution of financial water stress, we noticed a large variability across the Yarra Valley Water business area, as seen in Figure 6. In this, we had approximately one quarter of the Yarra Valley Water region in the worst category, with 40% to 49% of customers experiencing affordability stress from their water bill.

Figure 6: Percent of customers in each suburb experiencing water stress (Measured for the bottom 40% of disposable income whose affordability ratio is above 3%. Legend records percentage range.)
This analysis defined affordability stress as those below the 40th percentile of disposable income paying more than 3% of that income on their water bill.
Having this level of information provides Yarra Valley Water with an opportunity to help shape support programs to help customers experiencing financial stress. It provides greater insight into where they live, along with added knowledge about the unique characteristics of the associated region.
Discussion
With the advances in computing capability, we are now able to bring together previously large data sets managed by different entities. This presents the water industry with many new possibilities to improve how it provides services to customers. An example of one such possibility is presented in this report with the recommendation of measuring and monitoring affordability.
Gaining access to more detailed data on water affordability down to such disaggregated levels provides utility companies such as Yarra Valley Water with many improvement opportunities. If they know how to identify and reach vulnerable customers, they can refine programs to help them financially. It opens up oppportunities to improve how concessions are processed and managed. It can also be used to stimulate innovation.
Improve target programs
While we have qualitative data indicating that more and more customers are having difficulty paying their bills, quantitative data adds greater insight into the problem. The use of mixed methods helps to generate evidence to inform the development of targeted assistance programs.
Socio-economic conditions vary across the suburbs of Melbourne. It is not surprising that those with a lower socio-economic ranking will find it more difficult to pay their water bills. The ABS measures such socio-economic ranking using the Socio-Economic Indexes for Areas (SEIFA), ABS (2018).
However, when we analyse the spatial distribution of affordabiility in Figure 6, we can see that other groups, not just those on very low incomes, experience financial stress. Such information is extremely valuable, as it prompts a deeper analysis of what is meant by financial vulnerability. From this analysis, we have been able to segment three other factors contributing to financial stress in the given region.
Looking for explanations, we notice that some regions have a higher number of retirees without an ability to generate additional income, thus leaving them susceptible to financial stress. We also notice a region across the middle suburbs of Melbourne and postulate that this correlates well with the ‘working poor’, who are characteristed as young couples, recently married with a mortgage who suddenly find their income halved when they drop to only one income upon the arrival of their first child. This challenges utility providers like Yarra Valley Water to also think of financial stress as a transient situation that many people may find themselves in at certain periods in their life.
Becoming aware of the many different situations that contribute to financial stress allows utility companies to think about more targeted assistance programs for each unique group and situation, for example moving from mass communication to more specific approaches to meet the needs of target groups.
Improve the management of concessions
Water bills and concessions work hand in hand to provide a signal to all water users regarding the cost of providing water, together with supporting those who require financial support for a commodity that is a basic human right. From an ideal theoretical situation, concessions would lift all customers above the water stress threshold of 3%.
The ability to measure how customers are actually performing provides an opportunity to reflect on the effectiveness of the design and operation of the concession process. We conducted a mathematical analysis at a decile increment and concluded that the $50M in concessions we are currently processing each year was sufficient to bring all disposable income groups above the 3% affordability threshold, which is an encouraging outcome.
However, further detailed analysis that applied the existing water concession rules to each decile uncovered that those in the lowest decile group were not getting a sufficent level of concession to lift them above the 3% water stress threshold. This conversely meant that there were in fact customers who were benefiting from concesssion amounts using the threshold level of 3% that actually didn’t need it.
Interestingly, we now have three independent sources concluding that the concession payment system can be improved. This study identifies that our existing concession process is only about 80% effective, which correlates with what our practitioners experience in the field. Chan (2017; p379) also notes that “there would be substantial efficiency gain and budget saving by improving the Victorian utility concession schemes to target towards those households at utility stress.”
Introduce business drivers linked to affordability
Measuring and monitoring affordability could potentially bridge the conceptual gaps between companies competing in the market place and government owned utilities. In the commercial market place, companies are forever pursuing innovation to improve their product against their competitors, while delivering it at the same or lower price. If the water industry were to adopt the concept of an affordability threshold, and seek to provide all of their service improvements within these limits, it could synthesise the same innovation driver as the commercial market palce. This could also potentially change how utility companies plan for new water supply sources. Hypothetically, they could begin with a price constraint, and pose the challenge to innovators to design the technological solution to fit within that constraint.
Conclusion
With the advances in computing capability, data linkage and geospatial analysis we are now able to bring together previously large data sets managed by different entities. This presents the water industry with many new possibilities to generate evidence which can be used to develop strategies to improve service to customers. An example of one such possibility is presented in this paper with the recommendation that water utilities can get a direct benefit from measuring and monitoring affordability.
Measuring affordability answers two water industry challenges. Firstly, with financial stress now a major societal problem, many companies are exploring what their role will be to tackle this challenge. It is well known that financial stress has an adverse impact on both personal and community wellbeing. It is in this context that we aspire to improve our service delivery. Secondly, we wanted to explore if we could better replicate market drivers. This includes taking into account competition to keep prices down, while at the same time driving product innovation.
Affordability is a concept that provides a quantifiable measure of financial stress. A commonly adopted threshold used internationally is 3%, above which customers are then considered to be in financial water stress. Some countries even use this threshold as a fundamental requirement for water utilities to provide their services.
Yarra Valley Water has mapped affordability both spatially and temporally back to 2010. At the highest aggregated data level, it has found that it has improved affordability over the last eight years. However, when the data is disaggregated into deciles of affordability, it was shown that the lowest income group, measured at the fortieth percentile, has experienced an increase in financial stress with water bills rising from 26% to 34% over the same period. Identifying where these customers reside, and analysing unique characteristics of households and their associated regions, provides a utility the opportunity to better tailor assistance programs.
Measuring affordability, and in particular, selecting a threshold to supply water services could be a major strategic business driver. It could be used as a mechanism to replicate the forces that exist in the marketplace to drive innovation. In a competitive marketplace, businesses utilise innovation to pursue product improvements over their competitors, while keeping their prices down. A benefit that customers would appreciate.
About the authors
Francis Pamminger | Francis Pamminger is the Manager of Strategic Research at Yarra Valley Water. He has over 35 years’ experience in the water industry. His contribution to the water industry has been recognised with two Research Excellence Awards (in 2008 and 2010) by the Sustainability Specialist Group of the International Water Association.
Philip Greenwood | Philip Greenwood (email: philip.greenwood@unimelb.edu.au) is a software engineer at the University of Melbourne. His experience includes software development, working within agile methodologies, business analysis, and delivering solutions across commercial, academic and government sectors. Areas of application include spatial information, epidemiology and biostatistics, 3D visualisation, and urban design.
Luca Morandini | Luca Morandini is the Data Architect at the University of Melbourne. He has been working on data analytics, software development, and geo-spatial technologies since graduating in Statistics. In this time, he has developed numerous software applications, designed architectures and databases, led development teams, and contributed to open-source projects.
Richard Sinnott | Richard Sinnott is the Director of eResearch and Professor of Applied Computing Systems at the University of Melbourne. He has a PhD in Computing Science, an MSc in Software Engineering and a BSc in Theoretical Physics (Hons). He has over 400 peer-reviewed publications across a range of computing and application-specific domains.
References
Australian Bureau of Statistics (1996) Australian Social Trends. Special Features: Registered Cars https://www.abs.gov.au/ausstats/abs@.nsf/2f762f95845417aeca25706c00834efa/71dfde1556ed2ab7ca2570ec0073f3e1!OpenDocument (Accessed 19 June 2019).
Australian Bureau of Statistics (2018) Socio-Economic Indexes for Areas (SEIFA) https://www.abs.gov.au/websitedbs/censushome.nsf/home/seifa (Accessed 30 July 2019).
Arundel J., Lowe M., Hooper P., Roberts R., Rozel J., Higgs C., Giles-Corti B. (2017) Creating liveable cities in Australia: Mapping urban policy implementation and evidence-based national liveability indicators. Published by Centre for Urban Research (CUR) RMIT University.
Chan W., W., (2016) Rethinking water and energy affordability in Australia: an analysis of the efficiency, effectiveness and equity of current policy. A thesis submitted for the degree of Doctor of Philosophy of The Australian National University August 2016 https://openresearch-repository.anu.edu.au/bitstream/1885/108597/1/Chan%20Thesis%202016.pdf (Accessed 31 Aug 2017).
Fankhauser, Samuel and Sladjana Tepic (2007). Can poor consumers pay for energy and water? An affordability analysis for transition countries. Energy Policy 35: 1038-1049.
Melbourne eResearch Group (2018) Yarra Valley Water Affordability Study. Unpublished report.
The National Sustainable Development Council (2018) Sustainable Development Goals. Transforming Australia. Progress Report. https://www.sdgtransformingaustralia.com/#/1247/1271// (Accessed 17 December 2019).
University of Canberra – National Centre for Social and Economic Modelling, (2011): SA2 OECD Indicators: Income, Inequality and Financial Stress 2011; accessed from AURIN on 2018-02-14.
Waddams C., Deller D. (2015) Affordability of utilities services: extent practice and policy. Centre on Regulation in Europe (Cerre) http://www.cerre.eu/sites/cerre/files/Affordability_FinalReport.pdf (Accessed 27 Sept 2017).
Yarra Valley Water (2017) Price Submission.
Share