


Development of System Leakage Management Plan Using Nine Pillars Approach

Abstract
Unitywater has developed a System Leakage Management Plan (SLMP) with a focus on reducing total losses in the network within the Economical Level of Leakage. The SLMP provides a ten-year investment plan with emphasis on nine key parameters (pillars) for systematic reduction of the total losses by achieving efficient use of resources and excellence in operations. The recommended activities have been divided into Enabling Works, which have no direct effect on reducing NRW levels, and Reduction Works, which when implemented will see a direct reduction in NRW. The proposed investment plan in the SLMP will reduce the total losses from 75.8 to 50 Lt/conn/day (Litre per service connection per day) over the period of ten years.
The key measures proposed for the reduction of real losses are; increase the Active Leakage Detection on reticulation mains to 750km/quarter, additional trunk main active detection using acoustic loggers, apply advanced pressure management on 50 DMAs by using flow modulation with three-point data loggers, improve reporting of Minimum Night Flows for DMAs and a planned service mains replacement program.
The key measures proposed for reduction of apparent losses are; replacement of 11,500 (20-25mm) customer meters/year, replace top 8% commercial users with electronic meters, roll out of the digital metering program, and improving accuracy validation of the bulk flow meters.
Introduction
Unitywater is a water distribution and retail utility in South East Queensland, Australia with $3.5billion assets. It operates and maintains approximately 6,200 km of water mains servicing a population of over 770,000 people in the rapidly growing area north of the city of Brisbane. There are approximately 300,000 retail customers in the supply area and customers are metered and billed quarterly. Unitywater imports approximately 68GL of water each year from Seqwater via 28 bulk flow meters. About 11.5% of the imported water has been estimated as Non-Revenue Water (NRW), which is costing Unitywater approximately $25M/annum in lost revenue. About 93% of the NRW in Unitywater is from apparent and real losses (combined termed as total losses).
The water supply area for Unitywater is primarily divided into North and South water supply schemes, which are further divided into 14 water supply zones. At the bottom of the hierarchy are 232 District Metered Areas (DMAs), out of which 194 are operational and managed through the event management system (TaKaDu).
Unitywater has estimated that the Natural Rate of Rise (NRR) of losses in the network as 10.5 Lt/conn/day (Litre per service connection per day) in a year. NRR is the increase in leakage that would occur in the absence of any reduction measures such as; Pressure Management, Active Leakage Control, efficient reporting of leakage and repair and renewal of assets (Lambert & Fantozzi, 2005).
Unitywater has a low level of real losses with an ILI of 0.98, but the purchase price of water is perhaps one of the highest in the world ($3,122/ML). Hence, reducing the already low level of leakage in the network can still provide financial benefit (Goraya & Lukin, 2018b).
Unitywater’s first System Leakage Management Plan (SLMP), developed in 2013-14, had a focus on the implementation of; District Metered Areas (DMAs), intelligent leaks/burst reporting system (TaKaDu), and Active Leakage Detection (ALD). Since then Unitywater has developed a better insight into the distribution and economics of the leakage in the network (Goraya & Lukin, 2018a; Goraya & Lukin, 2018b).
The key to developing the revised SLMP in 2021 is to gain a better understanding of the causes of Non-Revenue Water (NRW) in the Unitywater network and the factors which influence its components. The diagnostic approach used by Unitywater helped in developing procedures and programs tailored to the specific characteristics of the network and influencing factors. According to Farley and Leimberger (2005), the diagnostic approach, followed by the practical implementation of practicable and achievable solutions, is the basis to develop a strategy for NRW management.
The revised SLMP addresses the five diagnostic questions;
- How much water is being lost?
- Where it is being lost?
- Why it is being lost?
- How to improve the performance?
- How to implement the strategy?
The SLMP is intended to provide strategic direction to Unitywater to systematically reduce the cost of NRW by achieving efficient use of resources and excellence in operation.
Methodology
Isle Utilities was engaged by Unitywater to analyse Unitywater’s existing data and benchmark it against the peer utilities in Australia and overseas to elaborate on the five diagnostic questions for the development of SLMP.
How much water is being lost?
Unitywater has adopted the International Water Association (IWA) top-down water balance model, in which some components are assumed for determining the losses in the network. The components such as; unbilled authorised consumption and apparent losses can vary significantly from community to community (Al-Omari 2013), thus impacting the total losses estimations. Unitywater analysed assumed components of the water balance based on the available data and adopted the corrected values. The review of the top-down calculation has provided a more accurate assessment of both the apparent losses and unbilled authorised consumption, hence resulting in the corrected level of reportable real losses. The top-down review suggests Unitywater’s real losses (57.6 Lt/conn/day or 5,200 ML/Year) are relatively low by national and international standards (BOM, 2019; Isle Utilities, 2020). The impact of this is that the lower the absolute level of real losses, the more difficult and expensive further significant reductions are likely to become. The total losses in the network, with the recent meter fleet inaccuracy of 2.5%, is estimated as 75.8 Lt/conn/day (6,750 ML/year).
It is also note-worthy that the system input volume in the water balance is measured by the 28 bulk water meters owned and operated by a bulk water supplier authority (Seqwater). This means that the accuracy of the entire water balance relies on the accuracy of the third-party assets.
Where it is being lost?
Unitywater carried out a bottom up water balance (Goraya & Lukin 2018a) to understand the distribution of losses at the asset class level; reservoirs, trunk mains, reticulation mains and service connections. The real losses in this analysis were classified using the BABE model (Lambert, 1994) as;
- Reported (visible reported to utility)
- Detectable (unreported but detectable by technology such as acoustic sounding)
- Background (small leakage which cannot be detected by technology until it gets gradually worsen to the point it can be detected)
The bottom up analysis showed that (Figure 1) approximately 27% of the total losses in the network are background losses and 50% are reported or detectable losses. About half of the reported and detectable losses are from the high level of failure rates of service connections from the main to the customer meter.
The benchmarking study by Isle Utilises (Isle Utilities, 2020) shows that leak events from the service connection in Unitywater are the second highest in the cohort of the utilities (Figure 2). The statistical analysis of the approximately 5,200km of ALD data and the reactive maintenance records confirms that service connections (ferrule, service pipe, stop cock, meter) are the biggest contributor to the real losses.
The number of reported reticulation main breaks in Unitywater’s network is about 3-5 breaks/100km, which is the lowest in Australia (BOM, 2019). Approximately half of the losses from the reticulation mains are from leaking hydrants and valves.
The losses from the trunk mains are not well understood presently and estimated based on three acoustic logging trials. Also, trunk mains are not part of the DMAs and ALD on these mains is not practical due to lack of fittings and difficult terrain to walk along the mains. The losses from the reservoirs are negligible and can be backed up with the ongoing inspection program and SCADA records.
Unitywater has a comprehensive customer meter testing program using ten-point flow rates to develop performance degradation curves for various meter sizes, models, ages and throughput volumes. Unitywater adopted the strategy of an accelerated meter replacement program in 2015 after analysis (Itron, 2016) showed that apparent losses in Unitywater’s customer meter fleet are 4.96%. Since 2015, a total of 125,000 meters have been installed including planned and reactive replacements, new installations and the Digital Neighbourhood Program (smart meters). With this replacement program, the average age of the meter fleet in 2021 has decreased from 10 years to 6.9 years. The estimated current metering error of the customer fleet is estimated as 2.5%, which is as shown in Figure 1, is close to 22% of the total losses.
The losses through water theft are not well understood and assumed as an IWA recommended value. Unitywater has approximately 5,300 unmetered fire flow connections to the commercial customers. There are anecdotal evidences that water from these connections is being used other than firefighting and system testing.
A better understanding of losses through trunk mains and water theft will help in refining background losses in the network.
Why it is being lost?
Real Losses
Unitywater water service connection strategy has historically followed a run to fail approach that is replacing services as required based on customer requests. Furthermore, the majority of service connection leak events (98%) were identified by the customer and TaKaDu has not been effective in identifying small leaks from service mains for medium to big size DMAs (it may be due to the MNF issue discussed later on in the paper).
Unitywater also does not have comprehensive information on the material of the service connections. A majority (80%) of the connections are assumed PE50 and PE80 constructed between 1970 to 2000. The laboratory testing has indicated that some mains are failing prematurely due to the presence of a resin in the material causing longitudinal splits. Other reasons for service main failures are considered as poor construction and design (lower PN rating for plastic pipes). A strong correlation between service connections age and failure rate has been established in a review of historical reactive maintenance data. The service connection failure rate, based on the last seven-year data, noticeably increases with age over 35 years (Figure 3).
The static pressure across 194 operational DMAs within Unitywater’s network ranges from 25 metres to 90 metres with an average pressure of 48m. Pressure management is only applied in 30 DMAs as reduced pressure can affect the internal property fire flow requirements for higher density and commercial developments. The cost of the retrofit to the internal firefighting infrastructure may be significant (as the installation of new pumps and storage tanks may be required), hence there has been reluctance on the large scale adoption of pressure management. The impact of pressure on reducing losses and breaks is well documented (Martínez-Codina et al., 2015). Unitywater is aware that high pressure has a role in the higher number of service connections failure in the network. Figure 4 shows the relationship between water service failure, over last seven years, and pressure in the Unitywater network.
The Minimum Night Flow (MNF) targets currently used for DMA reporting in TaKaDu are arbitrarily set and have not been reviewed to meet the economic level targets. The DMA specific MNF targets are essential for triggering the ALD activities for lowering the natural rate of rise of leakage.
Although reported leaks are actioned quickly by Unitywater, an efficient active leak detection programme is essential to locate detectable buried leaks (El-Zahab & Zayed, 2019). Currently, Unitywater uses the event management system within TaKaDu as well as a monthly review of nightline flows to assess where to initiate ALD activities. All ALD defined works (for reticulation and services) are prioritised for field services response, however, resourcing limitations result in not all leaks being repaired as quickly as wanted. All visible leaks and leaks larger than 4 L/m are repaired quickly, the smaller buried leaks may take 1 to 2 months to be repaired.
The trunk main pipe network is not monitored regularly and only walked along for any suspicious leaks based on high NRW calculated for a water supply zone in the quarterly water balance.
Apparent Losses
Small meters 20-25mm sizes, represent 97% of Unitywater’s customer meter fleet and measure approximately 77% of the total billed volume. The remaining 23% volume is measured through the larger meters (32-150mm) and accounts for 50% of the revenue losses.
The laboratory testing of larger meters (32mm to 150mm) is not extensive with a total of 180 meters tested since 2015. The number of meters tested for 50mm and 100mm diameter are 49 and 34 respectively. The larger meters are predominately mechanical meters (with impellor), which need greater torque to turn, thus are less sensitive to the lower flows (Arregui et al., 2011). The risk of unaccounted water for the lower flows increases if the meters are oversized. There is an opportunity to review the metering strategy to replace the mechanical meters with smaller diameter static (electromagnetic/ultrasound) meters.
There are approximately 5,300 unmetered fire flow connections within the Unitywater service area. The existing legislation prohibits Unitywater to install mechanical meters on these connections to avoid creating any head losses to the flow. There is potential to install full bore static meters on these connections which cause minimum head losses. As the fire flow connections are unmetered Unitywater needs to do more testing to evaluate whether each one is being regularly used and as such needs a permanent meter installed.
How to improve the performance?
The traditional approach in a System Leakage Management Plan (SLMP) is mainly focused on reducing real losses in the network by converging on the four pillars of leakage management (WASA, 2019). The SLMP for Unitywater focuses on a nine-pillar approach to economically reduce the total losses in the network (Figure 5). The nine pillars are; Water Balance, DMA Reporting, Active Leakage, Detection, Pressure Management, Meter Replacement, Response Time, Digital Neighbourhood Plan, Bulk Metering, Asset Management Plan. The planned measures for each pillar are discussed below.
Water Balance: The IWA standard assumption for unbilled unmetered consumption and water theft to be revised after every five years to develop an understanding of the true total losses in the network. The component level analysis for understanding the distribution of leakage is also to be repeated after every five years.
DMA Reporting: Improve the Minimum Night Flow (MNF) threshold for the 194 DMAs monitored in TaKaDu with additional information on the customer types and night flow data from smart meters. The MNF is to be reflective of the Economic Level of Leakage (ELL) reduction targets and hence provide an earlier trigger for leakage investigation work to reduce real losses. This will result in additional ALD work.
A planned program for; DMA flow meter calibration/verification, closed valve integrity testing, and PRV maintenance is required to maintain confidence in the MNF recorded in TaKaDu (to avoid false triggers for ALD work).
Active Leakage Detection (ALD): The analysis of the last three years ALD records shows that each km of mains surveyed has the impact of reducing the real losses by 0.12ML/year. The analysis shows that to reduce the natural rate of rise of the real losses in the network, 750km of water mains needs to be surveyed per quarter. This will reduce the real losses by 0.2 Lt/conn/day in a year. It is to note that the ALD work might not have a significant downward effect on the losses, but it is effective in maintaining a negative pressure on the natural rate of rise of leakage in the reticulation network. Also, ALD reduces only the detectable real losses as defined in the BABE model. Additional trunk mains acoustic leakage detection planned work is discussed under the Digital Neighbourhood Plan.
Pressure Management: Economic analysis on the pressure management implementation suggests that advanced pressure management can be applied in 50 DMAs over the next five-year period. It will improve pressure management in the network by upgrading the existing PRVs with flow modulation plus installing three-point data loggers to ensure full monitoring and evaluation of pressure control performance. The desktop assessment suggests that an average reduction in real losses of 0.19 ML/year per DMA can be achieved. Advanced pressure management will reduce real losses by 9.55 Lt/conn/day in five years. The flow modulation will reduce the excess pressure in the network during night-time and increase the pressure as the demand increases during daytime (or in the case of fire event), thus removing the requirement for the upgrade of the internal fire flow system for the commercial properties. Pressure management has an impact on all three types of real losses described in the BABE model (Lambert, 1994).
Meter Replacement Program: Replacement of 11,500 water meters (20-25mm)/year will keep the apparent losses in the meter fleet at 2.5%. Replacement of 456 large customer meters, that account for more than 8% of the total consumption, with smart meters will reduce apparent losses to 2.1%. Additional testing of meters (particularly larger meters) is required to refine the degradation model used for the meter replacement program.
A reduction of approximately 10% in unauthorised consumption (water theft) is anticipated by carrying out a campaign to identify the connections with illegal use of water. A trial of Flow.Watch technology (HWM, 2020) on random fire flow connections will help in understanding the extent of water theft through fire flow connections. The standard design for the fire flow connection is updated to include full bore static meter for the new connections.
Response Time: Unitywater’s average response and repairs time for both distribution and service mains is above Australian industry averages in terms of performance as shown in Figure 6. This need to be maintained to reduce the natural rate of rise of leakage in the network.
Digital Neighbourhood Plan (DNP): The DNP is part of the “Intelligent customer and network operations” initiative and enables the collection and analysis of network data from various digital devices to test the usefulness of the technology to improve decision making for customers and asset performance. In the first phase 10,000 digitally enabled (20-25mm) customer meters are to be installed to assess the benefits associated with digital metering technologies and data transmission networks, as well as building staff capabilities in terms of digital meter maintenance and data analytics.
The DNP also includes the installation of 76 acoustic loggers (hydrophones) and pressure transient monitoring devices on 52km of the trunk mains (which is 6.5% of the total trunk network). The acoustic loggers will monitor the acoustic noise in the trunk mains to locate the presence of any leaks. Pressure transient devices will monitor for short duration pressure transit events in the trunk mains to detect, categorise and locate the source of pressure transients. A calmer network reduces the number of leaks and breaks in the water network (Rezaei et al., 2015).
Bulk Metering: The System Input Volume is dependent on the accuracy of 28 bulk meters owned by Seqwater. Historically, very high or low losses in a water supply zone are associated with bulk metering errors. Unitywater to coordinate with Seqwater to ensure these meters are verified electronically every year to confirm meter accuracies. In addition, Unitywater intends to install additional internal verification meters on the mains supplying larger bulk volumes. These measures will reduce apparent losses and provide confidence in the water balance.
Asset Management Plan: Unitywater has currently 266,000+ service mains. Presently, only small number of service mains are replaced every year (approximately 200 replaced along with water mains renewals and about 400 as reactive maintenance program). A proactive planned replacement of poor performing services for the targeted DMAs is required. The key challenge for Unitywater regarding proactive renewal of service connections is the high upfront costs per customer. The process involves considerable reinstatement costs (e.g. sealed roads, driveways, footpaths, lawns) and associated disruption of customers. Unitywater is preparing a business case to trial no-dig technology (e.g internal relining, pipe pulling/extraction)
The desktop analysis predicts that real losses in the network can be reduced by 0.90 l/conn/day each year with a planned program of 2,540 service pipes replaced in a year. Service main renewal has an impact on all three types of real losses described in the BABE model (Lambert, 1994).
How to implement the strategy?
An investment plan proposed in the SLMP has been approved by the Infrastructure Strategy Committee and endorsed by the Capital Investment and Innovation Committee of Unitywater. An NRW Steering Group has been established to implement the plan.
The investment plan is predicted to reduce total losses from 75.8 to 50 Lt/conn/day and apparent losses by 0.52% over the period of ten years. Figure 7, shows that Unitywater has managed to reduce the total losses by 8% in the last five years. The investment plan proposed in SLMP will further reduce the total losses by 30% in the next ten years.
The recommended activities outlined in the investment plan have been divided into Enabling Works, which have no direct effect on reducing total losses and Reduction Works, which when implemented will see a direct reduction in total losses. The examples of enabling works include; a new system loss engineer position, additional trunk verification meters, re-calibration of meter replacement model, DMA integrity testing, PRV and DMA flow meter maintenance program. A full time position for an additional system loss engineer is recommended to undertake further work related to; additional ALD work, manage trunk leak detection data, deployment of three point loggers for pressure management, DMA integrity testing, DMA flow meter verification and closer monitoring of TaKaDu specifically management of minimum night flows.
Figure 8 shows the additional investment profile with the corresponding cumulative saving achieved with reduced real and total losses. The investment plan does not include the budget for DNP as it is delivered under the smart utility initiatives to deliver additional benefits to the community. The investment has a positive result with a ten-year NPV. The effectiveness of the implementation of the plan will be measured by the semi-automated quarterly and annual water balances.
Conclusion
A comprehensive System Leakage Management Plan provides an opportunity for Unitywater to employ a coordinated approach within the business for the next ten years with the focus on reduction of the total losses in the network with an Economical Level of Return on Investment.
The breakdown of the investment cost shows that the major investment is in the planned replacement of the service mains and planned meter replacement program. As shown in Figure 1, these are the two asset classes in Unitywater with higher losses in the network.
The biggest risk to the implementation of the plan is to undertake a planned service connections renewal program using trenchless/no dig technology. This technology is not commonly practised in Australia yet. A business case development is underway to identify such technologies for a medium scale trial.
References
Al-Omari A (2013) A methodology for breakdown of NRW into real and administrative losses. Water Resources Management 27: 1913-1930
Arregui, A., Cabrera, C. Jr, Cobacho, R. (2011) Integrated Water Meter Management. IWA Publishsing, London, UK.
BOM (2019) National performance report 2017–18: urban water utilities, part A - Published by the Bureau of Meteorology, Australia http://www.bom.gov.au/water/npr/docs/2017-18/nationalPerformanceReport2017_18UrbanWater Utilities.pdf
El-Zahab, S., Zayed, T. (2019) Leak detection in water distribution networks: an introductory overview. Smart Water (4), 5 https://doi.org/10.1186/s40713-019-0017-x
Farah, E., & Shahrour, I. (2017) Leakage detection using smart water system: Combination of water balance and automated minimum night Flow. water Resources Management (31), 10.1007/s11269-017-1780-9
Farley, M., & Liemberger, R. (2005) Developing a non-revenue water reduction strategy: planning and implementing the strategy. Water Science and Technology: Water Supply 5 (1) https://www.researchgate.net/publication/239582015_Developing_a_non-revenue_water_reduction_strategy_planning_and_i mplementing_the_strategy
Goraya, K. & Lukin, M. (2018a) Distribution of leakage in Unitywater’s water supply infrastructure.AWA – Water e-Journal (3), 1 https://www.awa.asn.au/resources/latest-news/business/assets-and-operations/distribution-of-leakage-in-unitywaters-water-supply-infrastructure
Goraya, K. & Lukin, M. (2018b) Reducing leakage to save bulk water cost. AWA – Water e-Journal (3), 4 https://www.awa.asn.au/resources/latest-news/business/assets-and-operations/reducing-leakage-to-save-bulk-water-costs
HWM (2020) Flow.Watch – Fire supply surveillance. https://www.hwmglobal.com/flow-watch-fire-supply/
Isle Utilities (2020) Leakage management benchmarking: Utility report – Unitywater
Itron (2016) Regional water meter replacement strategy: Queensland Urban Utilities and Unitywater meter replacement study report. Unitywater internal report.
Lambert A (1994) Accounting for losses: The bursts and background concept. Water and Environmental Journal 8(2): 205-214
Lambert, A. & Fantozzi, M. (2005) Recent advances in calculating economoc intervention frequency for active lekage control, and implications for calculation of ecnomic leakage levels. Proceedings from IWA International Conference on Water Economics, Statistics and Funance Rethymno, Greece, 8-10 July 2015.
Liemberger, R. and Farley, M. (2004). Developing a non-revenue water reduction strategy: investigating and assessing water losses. Presented at IWA 4th World Water Congress, Marrakech September 2004 (in review for Wat. Sci. Technol: Water Supply)
Martínez-Codina, Á, Castillo, M. González-Zeas, D. & Garrote, L. (2015): Pressure as a predictor of occurrence of pipe breaks in water distribution networks, Urban Water Journal
http://dx.doi.org/10.1080/1573062X.2015.1024687
Rezaei, H., Ryan, B., & Stoianov, I. (2015) Pipe Failure Analysis and Impact of Dynamic Hydraulic Conditions in Water Supply Networks, Procedia Engineering (119), 253-
262.(https://www.sciencedirect.com/science/article/pi i/S1877705815025539)
WASA (Water Services Association of Australia) (2019) Reducing leakage in Austaralia. https://www.wsaa.asn.au/sites/default/files/publicatio n/download/leakage%20report%20screen.pdf
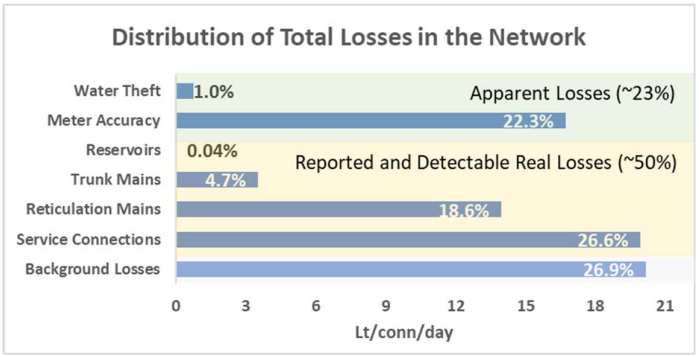
Figure 1: Distribution of losses in Unitywater water supply network
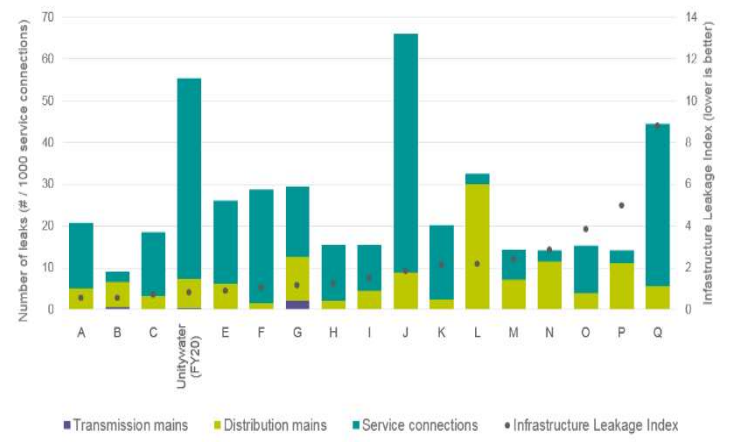
Figure 2: Total Leakage Events Identified (leak events/1,000 service connections) - benchmarked utilities across Australia, England, New Zealand and Brazil
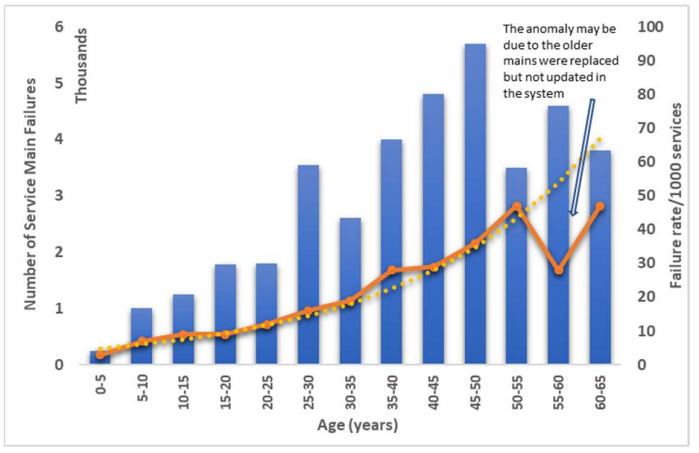
Figure 3: Age of service connections and observed number of failures (based on 7 year data - failure rate is for each cohorent)
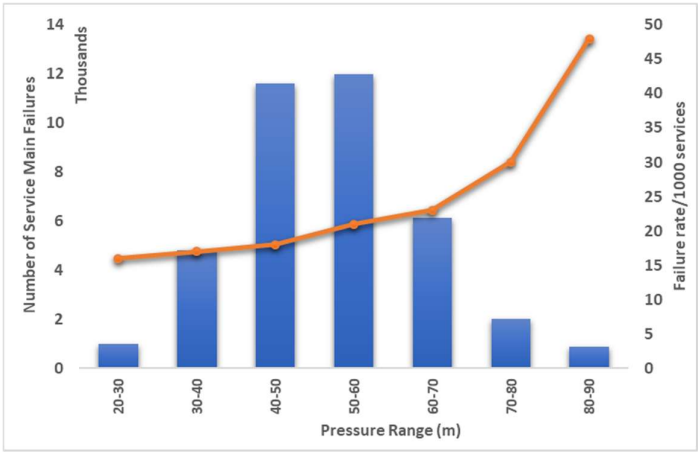
Figure 4: Network pressure and number of service main failure (based on 7 year data - failure rate is for each coherent)
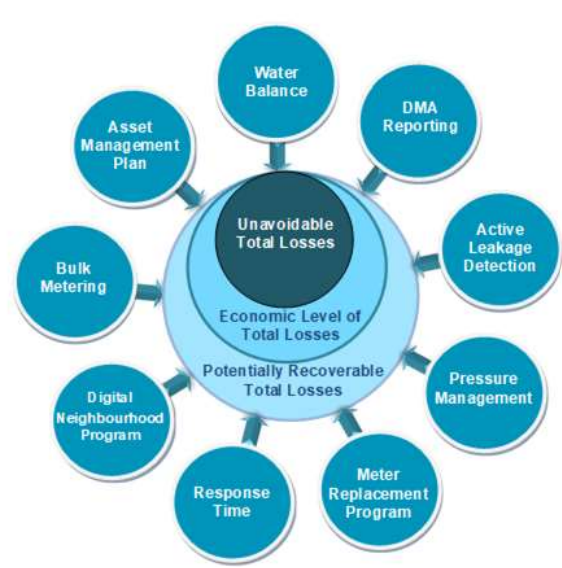
Figure 5: A nine pillar approach adopted by Unitywater to reduce total losses
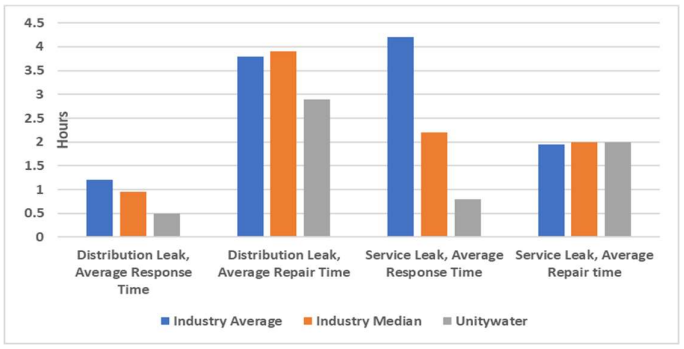
Figure 6: Response and repair time (Priority 1 requests) benchmarking against Australian utilities
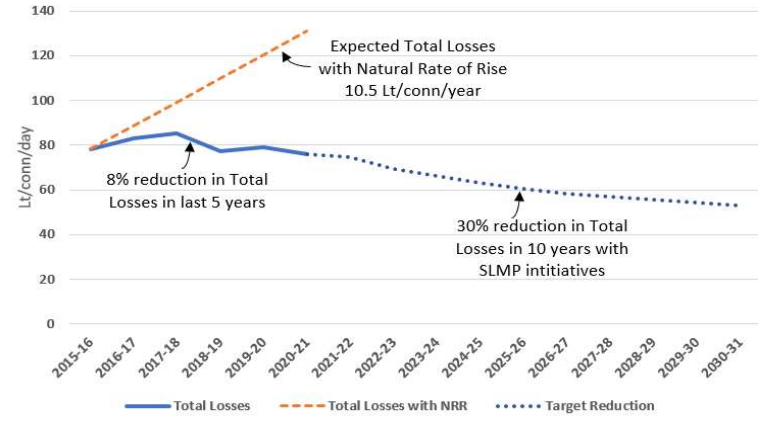
Figure 7: Total losses trend in Unitywater - observed and predicted
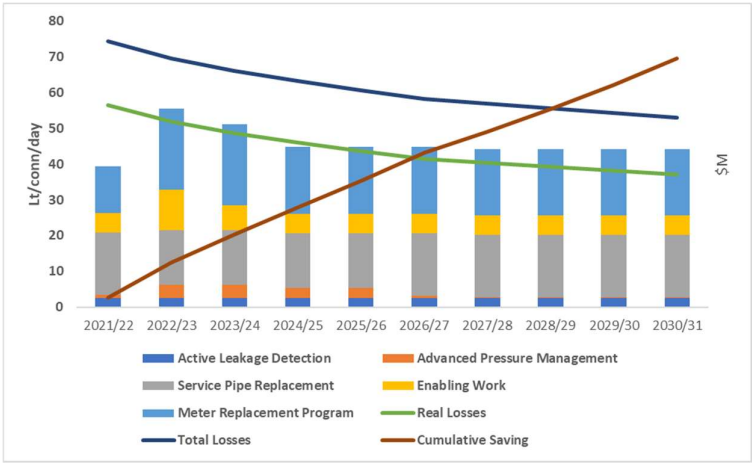
Figure 8: Investment profile and cumulative saving over ten years
Share