


Detecting Wastewater Blockages with Digital Water Meters? A Survey of Methods Used by Sydney Water

Abstract
Sydney Water is exploring a range of methods to prevent and mitigate wastewater overflows in dry weather. The IoT program has been successfully deploying thousands of wastewater blockage detection devices so far. We are trialling diurnal prediction models based on data from wastewater level sensors in the network to alert the operations centre about developing blockages earlier. We propose incorporating water usage data from digital meters deployed in the wastewater catchment upstream to improve those models' accuracy. Furthermore, to detect ongoing and, so far, unreported wastewater overflows, we are working on monitoring receiving waterways, such as creeks and stormwater channels.
Introduction
Sydney Water’s Internet of Things (IoT) program is built around the vision of making Greater Sydney a smarter and more liveable place. An example of enabling a smarter city are digital meters which are the basis for providing water usage information and insights to customers. Aspects of making a city more liveable are to improve our environmental performance and to prevent disruptions to citizens’ daily lives. Reducing the number of wastewater overflows is an IoT use case that delivers on both aspects.
Dry-weather wastewater overflows and their impact on customers and the environment are a challenge for utilities across Australia. The majority of blockages in the wastewater network are caused by either tree roots penetrating pipes and access chambers, wet wipes, fat/oil/grease or a combination of those. Most blockages occur in small diameter pipes, the so-called wastewater reticulation network.
Especially flushed wet wipes combined with tree roots are significant contributors to the build-up of blockages. We documented a case where just 11 months after removing all tree roots, an access chamber was filled with roots again, blocking the sewer flow and nearly causing an overflow.
There are various measures to tackle the problem, such as:
- Regular manual access chamber and pipe inspections (with CCTV)
- Monitoring technologies combined with analytics
- Cyclic cleaning and root-cutting
- Follow-on repairs and rehabilitation
- Continuous lining
- Customer campaigns
This paper focuses on approaches that utilise IoT technology and describes Sydney Water's progress in applying, testing, and developing solutions to detect blockages and identify dry-weather overflows.
Classification of Solutions
The application of IoT technology to this problem is a transformational milestone. Many manual steps, such as pipe inspections by crews and overflow reporting by the public, can be replaced with connected sensors and analytics that detect anomalies in the sewer system and raise alarms.
The ultimate goal of this application of IoT is to detect a blockage well before it becomes an issue and causes an overflow that harms customers and the environment. The earlier a blockage is detected, the more time it leaves the operations teams to schedule, prepare, and perform the cleaning activities safely and efficiently.
However, not always can a blockage be detected in time, and as a result, an overflow occurs. Therefore, there is a need for solutions that help identify ongoing overflows as soon as possible to minimise pollution and environmental impact. For example, a timely warning can give the crews enough time to deploy containment measures that prevent surcharging sewage from reaching a waterway.
To structure the approaches discussed in this paper, the authors suggest the following classification schema using Location Accuracy and Timeliness as defining characteristics of the methods presented. Furthermore, this framework can be applied to other IoT use cases, such as leak detection. Central to the framework is the issue that all solutions aim to prevent or mitigate. The issue for this use case is defined as wastewater in an access chamber rising to a level that cannot be contained anymore, resulting in wastewater spilling into the surrounding environment.
Figure 1 positions the methods in the quadrant, with Timeliness on the x-axis and Location Accuracy on the y-axis.
Thereby Timeliness describes at which point in time a solution can detect an anomaly. Before, after or at the time the issue eventuates. Proactive or predictive approaches aim at identifying developing blockages and preventing overflows. Reactive approaches identify the effects of an ongoing overflow and aim at minimising the time to detect the issue.
Location Accuracy describes the extent to which the method can pinpoint the blockage or issue to a specific asset, a group of assets, such as a pipeline, or an area, such as a sewer catchment. The more precise the location can be determined, the better, as it saves the field crews time and reduces the need to search for holding access chambers in sometimes difficult and unsafe terrain.
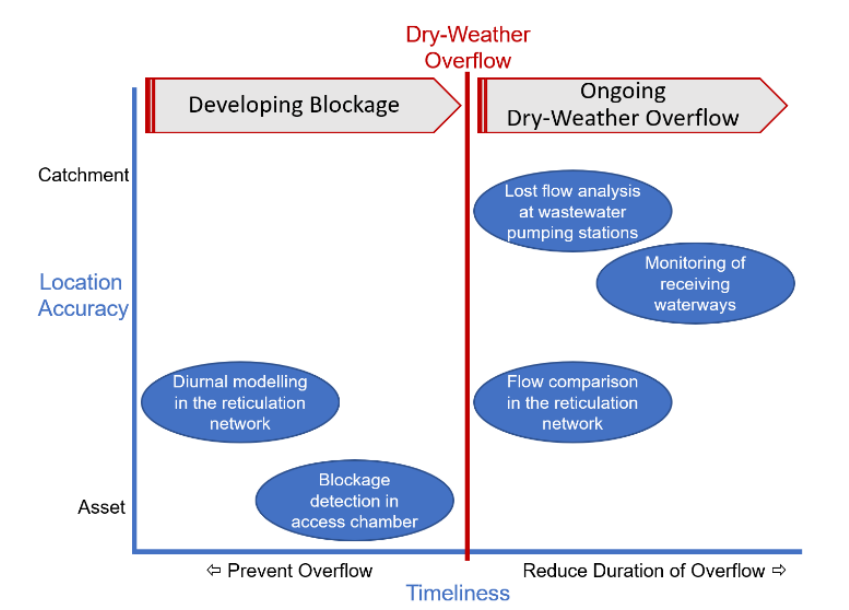
Figure 1: Classification schema for IoT sewer monitoring approaches
For example (see Figure 1), “Blockage detection in access chambers”, can directly detect rising sewer levels in the assets. Depending on the site's geometry, the alarm will be raised typically some hours before an overflow takes place, and this gives crews enough time to clear the blockage and prevent an overflow in the future.
On the other side, the “Monitoring of receiving waterways” method can detect ongoing overflows only. Usually, the overflow location cannot be determined precisely but can be narrowed down to access chambers and overflow points upstream and near the waterway.
Solutions
Sewer Blockage Detection in Access Chambers
The IoT technology most progressed in Sydney Water is Sewer Blockage Detection. After a rigorous testing process, the organisation is deploying devices now at a production scale and will ramp up the roll-out significantly over the coming years. Contrary to an inspection with CCTV, this monitoring approach does not identify the blockage itself but its symptoms, such as rising sewer levels in access chambers upstream of a blockage.
We tested and deployed three types of devices, see Prackwieser et al. (2019):
- Level switches/float sensors, which generate an alarm when a pre-defined sewer level is reached
- Ultrasonic/radar level sensors, measure every 15 minutes the sewer height with centimetres accuracy and submit the readings daily or in case of alarms
- Sewer flow sensors, measure the volume of sewer flowing through a pipe
After initial testing, we stopped using sewer flow sensors for this use case. Those instruments are expensive, difficult to install and maintain and the volume measurements can be derived from sewer level sensors with sufficient accuracy.
The devices selected for the roll-out must fulfil our technical specifications, including communication network, protocols, and security and need to work reliably in the very challenging environment of a sewer access chamber. Some of the requirements are:
- The device casing needs to withstand the highly corrosive environment (no aluminium, steel)
- IP68 is required due to the very high humidity and occasional immersion in wastewater
- Some vermin and cockroaches attack specific rubber cables and seals
- Mounting brackets need to be well designed to enable a safe and efficient installation
- As the devices are installed underground in concrete pits with metal lids, external antennas are required at ~90% of sites
- To minimize the need to re-visit a site, good battery life is essential
- While IoT networks such as LoRaWAN have their place in similar use cases in regional areas and other smart city-type applications, NB-IoT is our preferred communication protocol for this particular use case in a metropolitan area, see Drenoyanis et al. (2019)
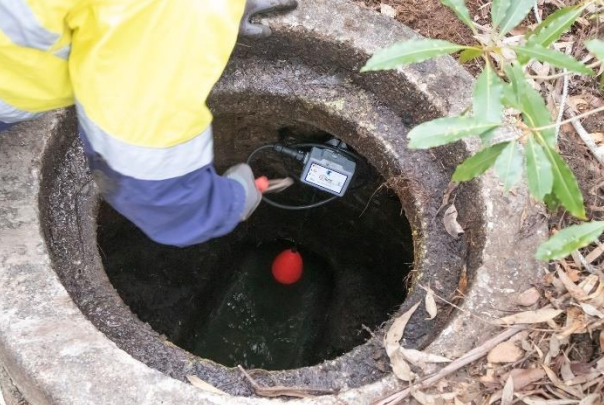
Figure 2: Installation of a sewer level switch device in a shallow access chamber
As of January 2022, we have deployed around 4,600 IoT sewer blockage devices in environmentally high-risk locations across the area of operation. The teams install 50-80 devices a week, depending on the weather and deployment area.
Selecting suitable devices, setting up a reliable supply chain, and enabling all-new device registration and business processes were important project deliveries. Furthermore, the development of a semi-automatic monitoring site selection process was a significant achievement that is paramount for the effectiveness and efficiency of the whole solution. The process identifies suitable monitoring sites out of the approximately 500,000 access chambers in Sydney Water’s wastewater network. It utilises a machine learning-enabled risk assessment, site and spatial information and inputs from subject matter experts.
The access chambers targeted for monitoring within each catchment connect reticulation sewer mains (150mm – 300mm diameter) with at least 30kL flow per day. Analysis of the performance of waterway incidents over the last 5-years indicates that around 61% of the total number of incidents each year are from this asset cohort.
The main steps in the site selection process are:
- Select a prioritised area (sub-catchment) based on the number of dry-weather overflows and licence limits
- On-site asset inspection, including communication network signal testing
- Conduct follow-on repairs and root-cutting if required
- Identify risk rating for each asset incorporating the likelihood of an asset blocking or choking and environmental consequence of failure incorporating sewer location and pipe size
- Generate risk rating for pipeline chains by calculating the probability of failure of sewer assets that are connected in series
- Generate an asset priority list
- Subject matter experts assess sites in the spatial system and decide based on location parameter if monitoring is required
- Assess safety/accessibility of the installation site
- If required:
- Perform an environmental assessment
- Perform a heritage assessment
- Develop a traffic control plan
- Refinement of the delivery plan
When an IoT device detects a high sewer level, the system alarms the 24/7 monitored Customer Hub, where operators assess the situation and prioritise and coordinate the response.
The solution is currently detecting, on average, 20 blockages per month. To date, more than 300 blockages at environmentally high-risk sites have been identified and cleared, representing approximately $400,000 in avoided incident costs per month. However, this is far outweighed by non-financial benefits such as protection of the environment, community amenity, public health, and employee safety. Due to this ongoing success, we have recently gained approval to develop a fully productionised system under the Environmental Improvement Program, including a mass deployment of IoT devices over three years.
We constantly scan the market and test technologies and new devices for this use case. Level sensors, compared to float switches provide much more detailed data useful for prediction and modelling. Additionally, they provide information for the operations teams on how fast the wastewater level rises at a site. This insight, combined with historical flow data at this site and time-of-day, is used to estimate required response times. At this point, we deploy level sensors at sites with a very high consequence of failure or very shallow access chambers.
The project has recently won the national 2021 Internet of Things Alliance (IoTAA) Award in the Water category and the 2021 Australian Water Association (AWA) NSW Water Award in the Infrastructure Project Innovation Award (METRO) category.
Low flow analysis at Sewage Pumping Stations
At OzWater’21 Stephen Cheung presented an approach that analyses sewer flow patterns to detect blockages and overflows. See Januszek et al. (2021) for a detailed description.
The method can detect sewer overflows and some blockages anywhere upstream of sewer pumping stations (SPS). It compares wet-well inflow rates and pump runtimes with historical diurnal patterns and identifies abnormally low inflow rates. However, it relies on the amount of lost flow being statistically significant compared to the normal total SPS inflow. Chokes that are a small proportion of the typical SPS flow cannot be differentiated from natural variation.
If the storage capacity in the sewer system upstream of a blockage is big enough, then there is a good chance to identify the blockage before an overflow occurs. Otherwise, early detection of an ongoing overflow will reduce its duration and impact. Many of the chokes identified so far have been in bushland where overflows are not in public view and could have run for days before being reported.
In 2020-21 this approach identified 28 potential chokes upstream of SPSs. Twenty of these were confirmed as chokes by field crews, and the remainder either had no issue or had previously been reported by customers. In the meantime, the team has operationalised the solution in migrating the data analysis and reporting component into Sydney Water’s SCADA system, called IICATS.
Based on the success of this approach, the logical next step was to apply this method further up in the catchment to evaluate if blockages and overflows could be detected in the reticulation network.
Diurnal Modelling and Prediction
The more recent deployment of IoT-based analogue level sensors within the reticulated wastewater network has provided much finer resolution data of level and therefore derived flows. This has demonstrated predictable diurnal traces even in low-flow areas of the Sydney Water wastewater network. Furthermore, the predictability of time-based flows can be modelled on historical data and then used to forecast expected flows in near real-time.
We developed a diurnal prediction model within Sydney Water’s current IoT platform to detect emerging blockages within the sewer reticulation network. This model utilises historical level data for each wastewater asset to first tune the ‘expected’ time-of-day based flow within that asset, see Figure 7.
By leveraging hourly time-slicing and an exponentially weighted moving average as the first-order infinite impulse response filter to reticulated wastewater level data, we are able to normalise diurnal flows at each network asset within the interquartile range. This is the basis for an early detection tool that identifies out-of-ordinary flows, indicating a sewer main break, a blockage both upstream and downstream of each site, and predicting potential overflow events before they occur.
Previously, when implemented at a sewer pumping station, we could only alert on lower-than-expected flows (negative, normalised flow error, consistently much lower for a specific length of time) to indicate a potential blockage or sewer main break somewhere upstream from the sewer pumping station. This could be, at times, up to tens of kilometres of sewer network to search. With the implementation of IoT sensors in reticulation access chambers, we significantly reduce the potential area where the issue is located. Furthermore, we can utilise the level/derived flow error both upstream and downstream of the device:
- Normalised positive flow error: Reading level/derived flow greater than the expected for a prolonged period of time may indicate a choke or partial choke downstream of this access chamber.
- Normalised negative flow error: Reading level/derived flow less than the expected for a prolonged period of time may indicate a choke or partial choke upstream of this access chamber.
As we deploy larger numbers of these IoT level sensors within a connected reticulated line, we can begin correlating the flow error from chamber to chamber, identifying where precisely the expected flow has decreased, and pinpoint the partial blockage with some accuracy.
Utilising works established as part of the 2021 Sydney Water Innovation Festival Hackathon, we are developing a network traversal model – aptly named the sewer search engine - to effectively search the network upstream or downstream from an identified partial choke and alert civil crews of where to inspect.
Using digital water meters to detect sewer blockages and overflows
Like many other water utilities, Sydney Water is preparing a transition to digital water meters. We explore and estimate benefits such as reducing water consumption by driving behavioural change, detecting leaks, and utilising usage data to improve operations and planning. However, to the authors' best knowledge, one benefit the industry hasn't explored intensively is the usage of digital metering data to identify blockages and overflows in the wastewater system.
Some of the approaches we describe in this paper predict sewer flows based on historical level data. In the following, we propose a method to improve those predictions and reduce the number of false-positive identifications.
Traditionally, water and wastewater systems have been modelled and analysed separately, even though there is an obvious "connection point" between the systems at customer properties. The idea outlined here is to observe the water usage of all properties in the catchment of a sewer monitoring point. This monitoring point can be a sewer level sensor that takes a reading in the same frequency as the digital meters measure consumption. An anomaly is detected if the sewer level doesn't follow the change in consumption over the course of a day exactly, just incorporating a short time delay. If the sewer level drops against consumption volume, an overflow may cause the loss in sewer flow. If the sewer level downstream increases compared to the consumption in the catchment, rain, an illegal connection or inflow from a water main break may be the cause.
Water used for drinking and cooking, washing and bathing will usually be collected by the wastewater system with no or a short delay. Water used for irrigation and pool top-ups may not enter the sewer system at all. Those activities vary for different customer types, seasons, weather situations, and time of day. Therefore, we don't use the actual volume of water consumed but a normalised value for the comparison. Furthermore, we normalise also the measured sewer level to account for different access chamber geometries.
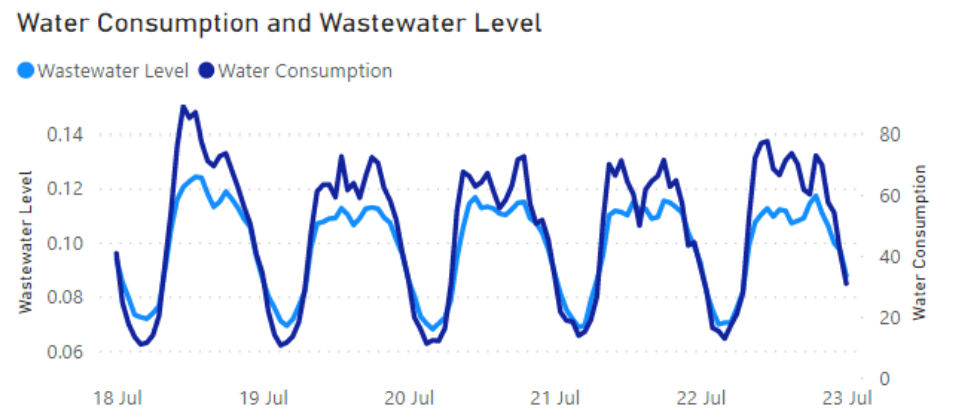
Figure 3: Water consumption in catchment and wastewater level in dry weather
First trials of this method in the digital meter test area around Liverpool show a very strong correlation between wastewater level and water consumption in the catchment of the observed sewer. Figure 3 displays the relationship on a day without rain, and the calculated correlation between those variables for the period is 0.97. Figure 4 shows the two measures on a rainy day, with the correlation decreasing to 0.79.
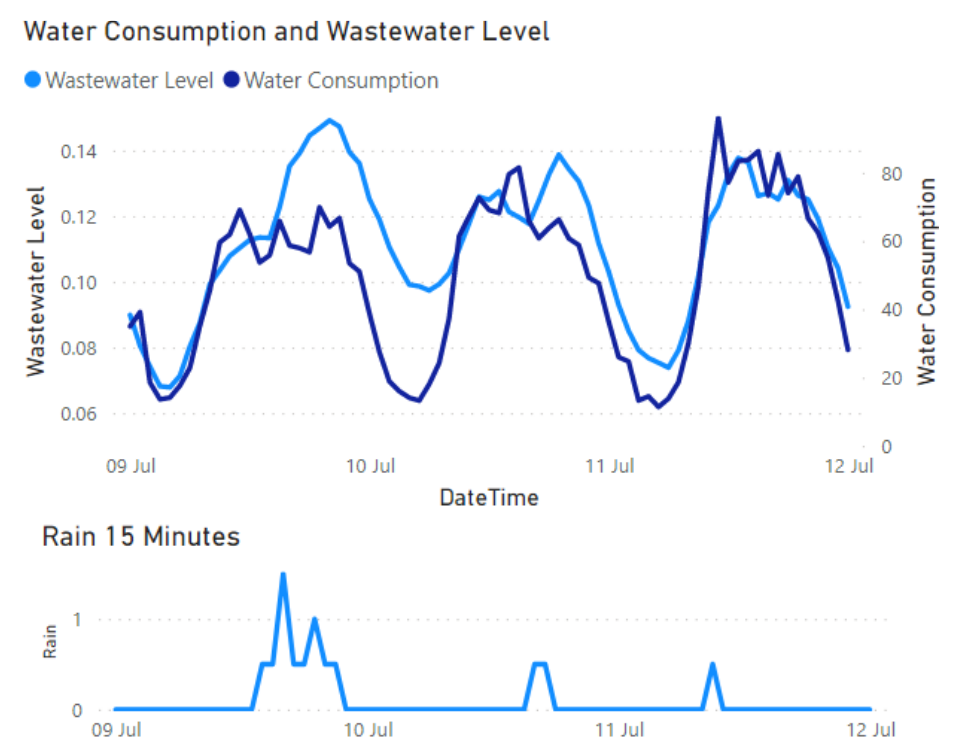
Figure 4: Water consumption and wastewater level in wet weather
Looking at the water consumption of a catchment is useful to understand and explain variability in sewer flows. For example, we expect to see effects on sewer levels while water outages upstream as we advance our trials. Furthermore, as we are progressing with the digital metering trial and more and more sewer catchments are equipped with digital meters, we will test this concept for different catchment sizes and sewer volumes to understand its applications and limitations better.
Flow comparison in the reticulation system
This method uses wastewater level sensors to compare the flow between two or more points in the reticulation sewer system. The backend system compares the difference between the upstream and downstream measurements and raises an alarm if a significant deviation from the prediction is detected.
If there is no inflow between the monitoring points, the comparison just needs to incorporate the time the sewer needs to reach the downstream site. If there are inflows from properties or other sewers in-between, then the inflows are predicted based on historical flow data of the up and downstream instruments.
Applications for this monitoring method are, for example:
- Monitoring sewer pipelines running through remote areas, such as creeks in bushland and areas where there is no communication network coverage for some access chambers
- Observing private sewers connecting to the Sydney Water network. A change in inflow may indicate a problem in the private sewer pipe.
- Monitoring of raising sewer mains. The project has not progressed with this application so far.
The IoT level sensor devices we deploy in the wastewater reticulation system are battery-powered.
Therefore, they are usually configured to measure every 15 minutes the sewer level and submit all readings once a day. This means that comparing readings of two sites in the backend can only happen retrospectively for the last 24 hours. Currently, a real-time alarm based on the difference between two individual IoT monitoring sites is not possible. However, the call-in frequency can be increased to reduce the potential time lag, but this comes at the expense of increased battery consumption.
IoT-based Dissolved Oxygen monitoring of receiving waterways
Dissolved oxygen (DO) refers to the level of free, non-compound oxygen present in water or other liquids. Due to its influence on the resident organisms within a body of water, it is an essential metric in assessing water quality. Wastewater ingress into waterways can cause unabated depletion of dissolved oxygen concentrations leading to short-to –long-term adverse outcomes for the surrounding aquatic environmental health.
Literature, anecdotal evidence from field samplers, and bench testing in the lab confirm that DO levels can indicate wastewater contamination. However, dissolved oxygen concentrations fluctuate from various other, often interrelated environmental casual factors, such as temperature, UV radiation and salinity.
This trial aims to determine how in-situ installed DO-probes connected to an IoT transmitter perform in the field and if wastewater ingress can be detected by observing DO levels under real-life conditions in a waterway.
So far, we have installed a D-Opto sensing element that utilises fluorescence to measure dissolved oxygen at two test sites. Both sites experienced wet-weather overflows nearby, but no dry-weather overflows during the device deployment.
Site 1 is at a coastal bay at the outflow of a tributary. We chose this site for its proximity to three emergency release sites (ERS), all equipped with level instrumentation for event correlation. A floatation device ensures that the sensor is positioned at the critical depth throughout tidal sea-level changes. Our field crews maintained the instrument every eight weeks, including cleaning and correlating with a known, calibrated instrument. We observed reductions in measured DO levels due to excessive marine growth. Cleaning the fluorescent substrate has proven very difficult with the risk of damaging the probe.
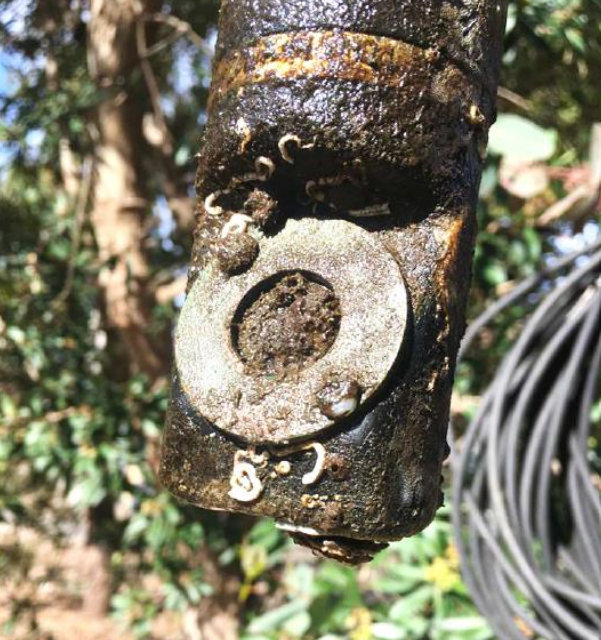
Figure 5: DO probe after 8 weeks in saltwater
During the operation of the sensor, one wet-weather event led to an overflow at one of the ERS. The instrument could not detect discernible reductions in dissolved oxygen concentrations during the wet-weather event. This is possibly attributed to the vast expanse of the water body diluting the wastewater ingress below the detectable limits of the instrument.
Site 2 is at an open freshwater pond that is part of a wetland and is fed by a stream. One ERS overflows into this pond. We installed the instrument in a stilling tube in combination with a floating device. Based on the experience from the installation at site 1 the maintenance visits were increased to a four-weekly cycle, which reduced the risk of damaging the fluorescent substrate while removing marine growth. As a result, the measured DO levels showed a reduced variability.
Multiple rain events took place during the time the probe was installed at site 2. We observed that the dissolved oxygen level increased quite rapidly with any rain. Reasons for this may be a reduction in UV radiation due to cloud coverage, a decrease in salinity, a temperature drop in the pond, a change in barometric pressure, more agitated water and other influences.
Figure 6 displays the wet-weather overflow event recorded at site 2. The upward trending DO level during the rain is recognisable, but also discernible is a visible dip in this pattern that appears shortly after the overflow commences. However, it cannot be determined with certainty that this effect was caused by wastewater ingress as the variability of DO levels during wet weather is too big. A lot more data from different wet and dry weather events need to be collected to detect anomalies in the DO level accurately. As there were no dry-weather overflows recorded during the trial installation, we could not verify the effectiveness of this approach so far.
However, the significant maintenance effort required and the need to apply advanced anomaly detection algorithms, most likely fine-tuned for each install site, indicates that this solution in its current design is only suitable for some sites, such as monitoring swimming spots in the freshwater stream with constant flow. The next trial stage is to install devices in a river system.
Conclusion
Utilising IoT for sewer blockage detection has already benefited Sydney Water, our customers and the environment. We see a huge potential in increased usage of IoT sensors for wastewater monitoring and in applying advanced analytics and models to identify abnormalities in the system. Some of the presented methods in this paper are at the early stage of development and will need more testing and refining before they are ready for a productionised roll-out. For example, the developed initial diurnal prediction models deliver already valuable insights into system behaviour and can forecast potential failures. However, to achieve this solution's full potential, a deployment of analogue level sensors at scale is required. As early results have shown, additional data sources, such as usage data from digital water meters, will improve the prediction models. Furthermore, to support the operations teams, we will utilise the collected historical data from IoT sensors, asset information and external weather data to prioritise alarms and recommend actions to resolve the issue.
Acknowledgement
The authors would like to acknowledge the hard work, dedication, curiosity and out-of-the-box thinking of all members of the wider IoT project team, which led to those highly anticipated insights, beneficial outcomes and numerous innovative solutions. We thank all stakeholders and the Sydney Water Executive for their support and motivation.
References
Drenoyanis, A., Raad, R., Wady, I. and Krogh, C., 2019. Implementation of an IoT Based Radar Sensor Network for Wastewater Management. Sensors 2019, 19, 254.
Januszek M., Rahman N. and Cheung S., 2021. Analysing Sewer Flow Patterns to Detect Blockages and Overflows. OzWater’21
Prackwieser, C., Cash, D. and Wassell, M., 2019. IoT as a digital enabler of a hyper-connected water utility. Water e-journal, 4(3), pp.1-10.
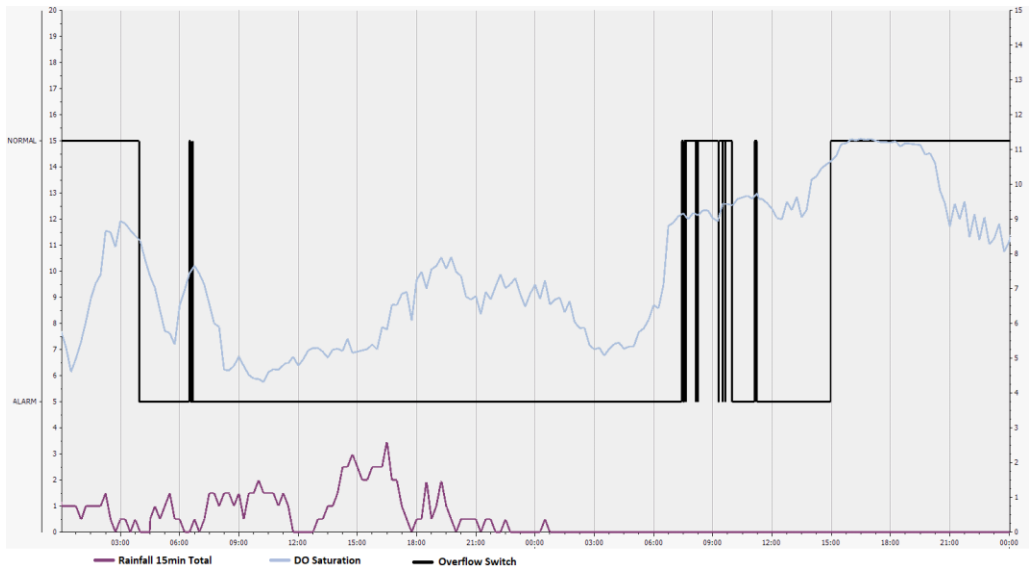
Figure 6: DO Level during overflow at site 2
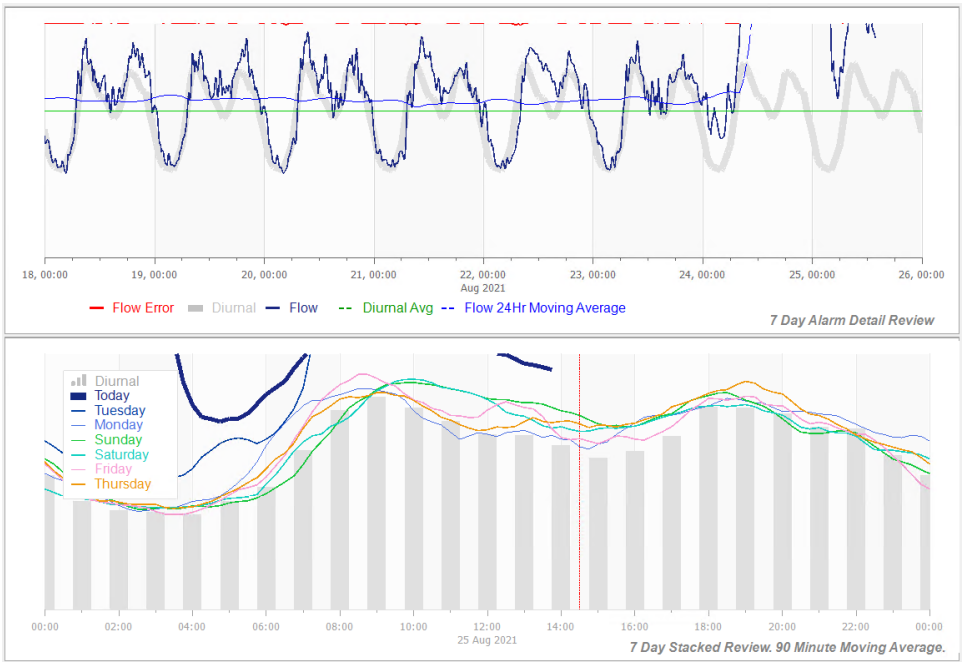
Figure 7: Diurnal model to detect even partial blockages up and downstream of access chambers
Share