


Design strategies for reducing energy and total costs for large-scale seawater reverse osmosis plants

DOWNLOAD THE PAPER
Abstract
One of the main obstacles limiting seawater reverse osmosis (SWRO) from becoming a more widespread solution to water shortages is the overall capital and operational costs, partially driven by energy consumption required for the SWRO process. Since its inception, however, the power requirement for SWRO has decreased dramatically through numerous factors, including improved RO membrane performance, the introduction of energy recovery systems, and improved design practices and efficiency. While many of these solutions relate to technological advances, membrane system design can be optimised during the design stage and maximise total cost savings of using SWRO.
Improving design practice of SWRO to reduce power consumption requires a thorough analysis of all components, such as operating conditions, recovery, system flux, and membrane model selection. This paper presents essential design considerations that impact energy use and strategies for maximising total cost savings for SWRO plants.
Introduction
Reliable water sources have long been an issue in many parts of the world, especially in the Middle East. While seawater is readily available, extensive water treatment is required before the product water becomes potable or acceptable for other uses. Historically, seawater desalination has been quite energy intensive, using methods such as multi-stage flash distillation (MSF). Power consumption greatly reduced with the introduction of desalination through SWRO. Compared to MSF, SWRO operates at higher recovery with much lower energy per cubic meter of water produced. The introduction of energy recovery devices further reduced the energy consumption of SWRO. Although the energy cost is reduced through advances in technology, the improvements are becoming progressively smaller. Hence, rather than relying on new breakthroughs in technology to improve cost-efficiency, it is essential to optimise the SWRO design to ensure the best performance out of the current technology.
The number of SWRO projects with energy consumption as a critical aspect is growing in many regions. For example, the Independent Water Project (IWP) model focuses on long-term energy consumption over 20 or 30 years. In Mega-SWRO projects of greater than 100 ML/d (million litres per day) production, small differences in energy consumption add up over time and lead to larger savings, which is taken into account when determining the appropriate design and membrane selection for the desalination plant.
This paper focusses on the design considerations that impact energy consumption of RO systems and describes strategies used to reduce the overall power required for SWRO operation to make it more cost-effective and sustainable.
Design strategy
When starting the design process, it is necessary to analyse the operating conditions to separate them into design conditions and technical limit conditions. Design conditions take into consideration the realistic operation conditions, with the addition of a small buffer. On the other hand, technical limit conditions consider very conservative conditions that are highly unlikely in real life. Typically, they require that the permeate quality requirements are maintained, but do not require that the production requirements be met.
Optimisation of the system design based on technical limit conditions can lead to an overall less energy-efficient design as these conditions rarely (if ever) occur. Technical limit conditions are better managed by varying other design parameters such as production, recovery, and permeate split.
Feed-End Split Design
When operating two-pass systems, not all the permeate of the first pass permeate is required to be treated by the second pass to meet the permeate quality requirements. Part of the first pass permeate can bypass second pass treatment and be blended with the second pass permeate. The process is referred to as a permeate split. It reduces the flow treated in the second pass, requires less raw water flow to the system, and as a result lowers the overall energy consumption.
In partial two-pass systems, permeate split type greatly influences the size of the second pass. When all the first pass permeate is collected and then split, it is referred to as a simple split. While a simple split of the permeate is easier to implement, utilising a feed-end permeate split, also known as a partial split, improves the quality of the permeate stream that blends with the second pass permeate. Permeate from the lead elements of the pressure vessel is of higher quality than the tail end permeate. Rather than allowing the higher quality feed-side permeate to blend with the lower quality tail-side permeate, the feed end permeate is diverted, as seen in Figure 1.
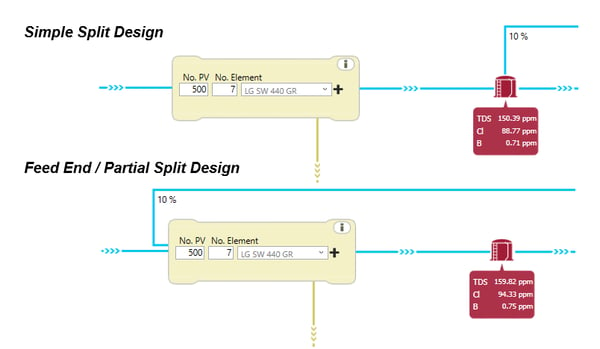
Figure 1: Simple and partial split
As a result, the split percentage is increased and the required number of pressure vessels and membranes in the second pass is reduced. Table 1 and Figure 2 show an example of how the feed-end split can potentially reduce the size of the second pass compared to the simple split at identical first-pass conditions and targeting the same blended permeate quality.
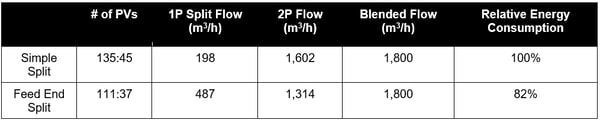
Figure 1: Effects of split type
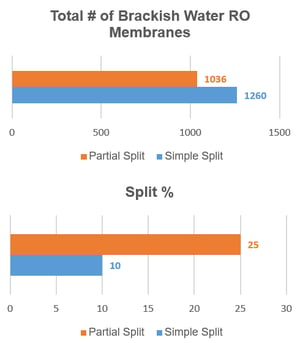
Figure 2: Reduction in 2nd pass membranes and required production
The first pass configuration is identical for both split examples and the second pass is sized to have similar average flux to produce similar permeate quality from the second pass permeate. The difference in second pass size and flow is due to the difference in permeate quality of the split streams. Since the feed end permeate is of higher quality, a larger amount of this permeate can bypass the second pass and be blended with the second pass permeate and still achieve the permeate quality requirements. This reduces the second pass pressure vessel quantities by approximately 18%. With a 25% split, the partial split option has the second pass treating only 75% of the first pass permeate while the simple split at 10% split has the second pass treating 90% of the first pass permeate. The difference in split percentage of feed end split over a simple split can vary depending on operating factors such as permeate quality required, membrane salt rejection, temperature, etc.
Further mention of ‘split’ in this paper will refer to feed-end split.
Recovery rate
Membrane recovery is another important optimisation parameter. Operation at a higher recovery requires a higher feed pressure, increases energy consumption, and worsens permeate quality. However, lowering the recovery requires a larger feed flow and thus larger pretreatment flows as well.
For technical limit conditions in two-pass systems, second pass recovery can be reduced to lower production and manage permeate quality. Recovery should be examined on a case-by-case basis to better fit the plant requirements. Often the desired recovery range will be pre-determined due to plant sizing limitations, as a lower recovery requires a larger spatial footprint.
System flux
System flux plays a significant role in the project total cost as well. Operation at a higher system flux requires fewer pressure vessels to meet the production targets but can lead to a higher risk of fouling, resulting in a higher frequency of chemical cleaning and higher membrane replacement rate. Operation at a lower system flux results in a higher capital cost and a plant with a lower fouling potential and lower energy consumption but worse permeate quality.
Membrane pretreatment also greatly impacts the recommended operating flux for a system.
It is ultimately a designer’s goal to select the system that results in lower total cost over the entire operating life of the plant. Multiple options need to be explored with capital costs and energy consumption calculated for the entire system to determine the optimal flux for cost saving.
Table 2 shows how system flux affects the system size and specific energy consumption when targeting identical permeate quality requirements.
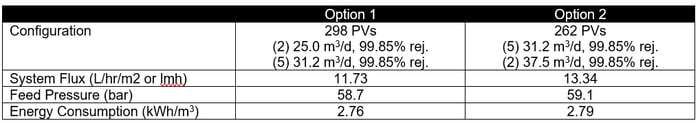
Table 2: Effects of system flux
Options 1 and 2 are both hybrid designs – membrane configurations with multiple membrane types within the same pressure vessel. The values in parentheses indicates the number of elements in the pressure vessel of each membrane type, with the membrane types listed in the order of the membranes from lead to tail. The flows (m3/d) and rejection (% rej) are the membrane specifications at the standard test conditions, which are typically used to identify similar membrane types between different membrane manufacturers. While both options operate at a similar feed pressure, option 1 with lower system flux has a (slightly) lower energy consumption in this case. This is impacted by the membrane selection as well.
Membrane selection
Membrane selection plays a critical role in the overall energy consumption. Typically, membranes with higher rejection characteristics are tighter and, in general, require higher pressure to produce the same amount of water. Maximum designed feed pressure is generally considered as an indicator of energy consumption. However, it is not definitive especially in partial two-pass systems. Utilising membranes with higher rejection characteristics in the first pass allows systems to provide better permeate quality in the split stream to blend with the second pass permeate. It is especially important in cases with higher split percentage and the concentration in the first pass permeate split heavily dictates the overall blended quality. In these cases, the tighter membranes in the first pass can result in a smaller second pass size (and sometimes eliminate the second pass altogether), thereby dramatically reducing the overall project cost.
Membrane case studies
In the below design comparisons, membranes from the same manufacturer and different manufacturers are studied to observe the effects of membrane selection on overall energy consumption.
The design conditions were modelled using common conditions found in SWRO plants in the Middle East, with feed salinity of 45 g/l, production capacity of 300 ML/d, and a temperatures of 18°C, 26°C and 35°C. The recovery was set at 42% in first pass and 90% in second pass with a maximum operating flux of 12.7 lmh in the first pass and 31.4 lmh in the second pass. The limiting permeate requirement was set as Chloride < 25 ppm.
Energy consumption savings can vary depending on factors such as temperature range and permeate quality requirements. The results of the case studies are not representative of every case and are meant to illustrate potential benefits of energy consumption savings and capital cost savings.
Membrane comparison from the same manufacturer (Energy consumption)
Configuration 1A utilises a hybrid with 99.89% rejection membranes in the two lead elements and 99.85% rejection membranes for the remaining elements. Configuration 1B utilises a hybrid with 99.85% rejection membranes.
The two designs are projected using software available from Manufacturer 1 with the results illustrated in Table 3 below noting that projection results may vary depending on the version of the projection software. The brackish water reverse osmosis (BWRO) membranes selected were identical for both configurations, with the pressure vessel staging of first and second stage indicated in “# of 2P PVs.”
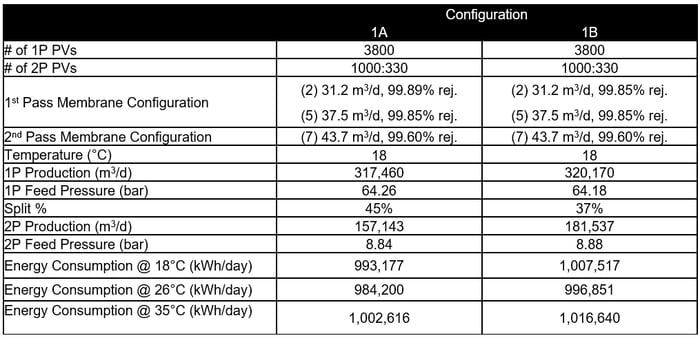 Table 3: Effects of membrane selection
Partial split is maximised for both configurations to reduce the flow to the second pass and still maintain the permeate quality requirements. Only the first two membranes in the hybrid configuration are changed from 99.89% to 99.85%, yet the difference in energy consumption is quite significant.
Since the design utilises feed end partial split, the rejection of the lead elements becomes important in maximising split. Even though the feed pressures are identical, the lower production requirements per pass from Configuration 1 result in a savings of energy consumption by up to 1.38%.
Membrane comparison from three different manufacturers (Energy consumption)
Configuration 2A utilises a hybrid with 99.89% rejection membranes in the two lead elements and 99.85% rejection membranes for the remaining elements, Configuration 2B utilises 99.88% rejection membranes, Configuration 2C utilises a hybrid with 99.80% rejection membranes, and Configuration 2D utilises 99.80% rejection membranes.
The four designs were projected using software available from Manufacturers 1, 2, and 3 with the results illustrated in Table 4 noting that projection results may vary depending on the version of the projection software. BWRO membranes selected were of a similar product type.
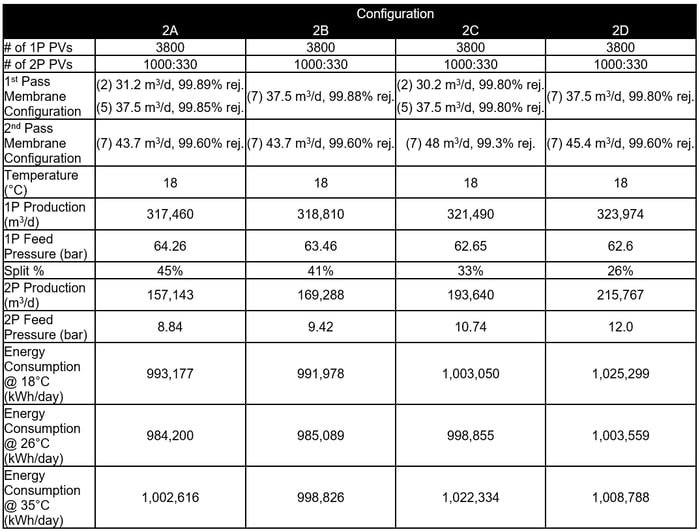 Table 4: Effects of membrane selection
Partial permeate split is maximised for all four Configurations to reduce the flow to the second pass as much as possible while still meeting the permeate quality requirements. The second pass is treated as ten trains of 100:33 pressure vessel arrays, and when flow to second pass is low then the number of trains in operation will be reduced to maintain similar average flux of second pass where possible. Configuration 2A from Manufacturer 1 is compared to Configuration 2C from Manufacturer 2 as the hybrid configurations and Configuration 2B from Manufacturer 1 is compared to Configuration 2D from Manufacturer 3 as the nonhybrid configurations. While the maximum feed pressure for Configuration 2A & 2B is higher than Configuration 2C & 2D, the energy consumption at minimum, average, and maximum temperature is still lower overall. High membrane rejection allows for a larger partial permeate split which lowers production required in both passes and leads to energy savings. The energy consumption of Configuration 2C is up to 1.97% higher than Configuration 2A, and Configuration 2D is up to 3.36% higher than Configuration 2B.
Membrane comparison (Capital cost)
The previous comparison focuses on specific energy savings of membrane selection, however, if capital expenditure savings is the priority, then configurations can be adjusted. Rather than identical second pass configurations, the number of second pass PVs is minimised while keeping similar average flux in Table 5. Only the maximum temperature is considered here as it is the condition with the highest flow to the second pass to emphasise the potential capital cost savings. Configuration 3A utilises a hybrid with 99.89% rejection membranes in the two lead elements and 99.85% rejection membranes for the remaining elements, Configuration 3B utilises a hybrid with 99.85% rejection elements, and Configuration 3C utilises a hybrid with 99.80% rejection membranes. The three designs are projected using software available from Manufacturers 1 and 2 with the results illustrated in Table 5 below. BWRO membranes selected are of similar product type.
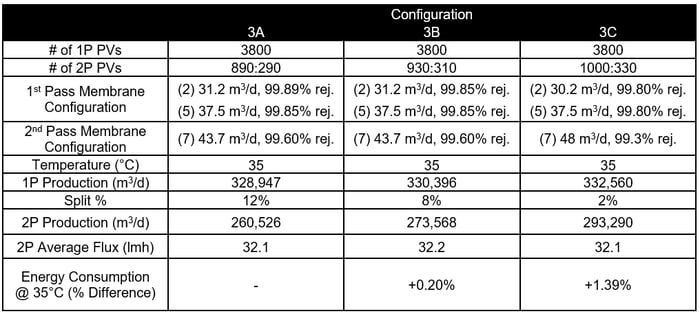 Table 5: Effects of membrane selection
The configurations utilising higher rejection membranes in the first pass increases the amount of permeate split to allow for a reduction of second pass PVs while maintaining similar operating flux. As a result, the capital expenditure for the second pass can be reduced by a significant margin in terms of pressure vessels, membranes, and other equipment. Between Configurations 3B and 3C from Manufacturers 1 and 2, Configuration 3B reduces second pass size by approximately 6.8%, translating to 90 fewer PVs and 630 fewer membranes. Between Configurations 3A and 3B from Manufacturer 1 only, Configuration A reduces second pass size by 4.9%, translating to 60 fewer PVs and 420 fewer membranes. Even with lower capital cost, the energy consumption benefits from the membrane selection are still apparent due to the higher permeate split and lower required production out of the first and second pass.
Conclusions
With thoughtful design choices through every step of the membrane system, it is possible to reduce the overall energy consumption of SWRO and save on capital cost. Utilising feed end split reduces the size of the second pass, lowering both the number of pressure vessels and the amount of water requiring treatment. Lower system flux reduces energy consumption and has lower fouling potential, which can lead to savings in operating cost in the long term if cleanings and membrane replacement become less frequent. Membranes with higher rejection provide higher quality water in the feed end permeate, allowing a larger split and reducing the production required from the second pass. The required raw water feed flow decreases, improving the overall system recovery. These reductions in energy consumption add up and grow in value the longer the plant remains in operation.
Author Biographies
Kenneth Chao | Kenneth currently works as an Application Engineering Manager for LG Water Solutions where he focuses on reverse osmosis system design for large-scale desalination plants. Previously, he attended the University of California, Irvine, where he graduated with a B.S. in Chemical Engineering.
Dr. Eugene Rozenbaoum | Dr. Eugene Rozenbaoum is a Director of Engineering and Technical Service at LG Chem. He has over 12 years of experience in R&D, product development, and engineering in water separation processes including RO and MF technologies for seawater desalination and various water treatment applications.
Dr. Hoon Hyung | Dr. Hoon Hyung is president of LG Water Solutions, the manufacturer of NanoH2O RO membranes. He has more than 25 years of experience in the water industry getting involved in various desalination and water/wastewater treatment projects in technical and managerial capacities.
References
- Altmann, T., Paden, J., Casimiro, S. SWRO Energy Efficiency: Paradigm Shift in Design and Optimization of SWRO Plants Using GCC Seawater Conditions” 2019 IDA World Congress.
- Kim J., Park K., Yang D.R., Hong S., A comprehensive review of energy consumption of seawater reverse osmosis desalination plants, Applied Energy, 254 2019, 1-16.
- Qasim M., Badrelzaman M., Darwish N.N., Darwish N.A., Reverse osmosis desalination: A state-of-the-art review, Desalination, 459, 2019, 59-104.
- Du Y., Xie L., Liu Y., Zhang S., Xu Y., Optimization of reverse osmosis networks with split partial second pass design, Desalination, 365, 2015, 365-380.
Share