


Comparing the reliability of two soil moisture probes for high clay content NSW soils
DOWNLOAD THE PAPER
Abstract
The accurate measurement of soil moisture can be a time-consuming task. Soil moisture is highly variable, and it can be difficult to capture spatially and temporally. While remote sensing has become a popular and ever-improving tool, on-ground measurement is required for both calibration, validation, and evaluation of any emerging technology. Many applications commonly require or use a relative value of soil moisture to assess the temporal persistency of moisture regimes across catchments or agricultural landscapes. This paper compares on-ground indirect soil moisture measurements from two commonly available manufacturer-calibrated in-situ measurement devices against gravimetric soil moisture data. The devices used are a Delta T Theta Probe and a Campbell Scientific CS659 while the gravimetric soil moisture data are from soil cores collected in 2014, 2015 and 2018 (308 samples) with a range of soil moisture states from wilting point to field capacity. The gravimetric and probe measurements returned R values of approximately 0.8 for 2014 and 2015. A decrease in correlation (to approximately 0.3 and 0.5) was observed for the 2018 data. The manufacturer-calibrated probe measurements did not provide a 1:1 relationship with the gravimetric soil moisture data and require calibration for bias correction. However, results show that either the Theta Probe or CS659 are reliable and comparable to the gravimetric results in most conditions. Best results will be obtained by using appropriate techniques and knowing the limitations of devices. The calibration equations developed in this study are useful for others for both understanding and measurement of soil moisture.
Introduction
Whole profile soil moisture content is highly variable both spatially and temporally. However, near-surface soil moisture (i.e., top 5 – 10 cm of the soil profile) is particularly complex (Canton et al., 2004; Cosh et al., 2004; Famiglietti et al., 1998; Hébrard et al., 2006; Qiu et al., 2001; Svetlitchnyi et al., 2003; Western et al., 1999; Western et al., 2004; Wilson et al., 2005). Most hydrological, vegetation growth and climate models require some form of soil moisture data input, identifying its importance. Therefore, accurate and reliable soil moisture data, both near surface and whole profile is vital to understand and manage hydrological, environmental and agricultural processes. Our ability to quantify its spatial and temporal variability is a critical factor in improving our understanding of the hydrological cycle while also improving agricultural water use efficiency and a range of other environmental processes (Famiglietti et al., 1998; Garcia y Garcia et al., 2009; Schmutz and Namikas, 2011; Starks et al., 2006; Wilson et al., 2003). Quick, simple and reliable soil moisture measurement plays an important role in allowing practitioners to make informed decisions regarding agricultural, fire, flooding and ecological management.
The spatial and temporal variability of soil moisture provides great challenges for the soil and hydrological communities. While remote sensing has become a popular and ever-improving tool, on-ground measurement is still needed for both calibration, validation and evaluation of any remote sensing technology (Chen et al., 2017; Senanayake et al., 2019; Senanayake et al., 2021; Wu et al., 2016; Zhang et al., 2017), while some soil moisture satellites provide a relative degree of saturation, rather than an absolute value (Brocca et al., 2017).
The most reliable method for the quantification of soil moisture is the gravimetric technique following the methods described by Rayment and Lyons (2010). While this method is accurate and simple, it is destructive and only provides a unique spatial and temporal snapshot of soil moisture at that time and location. The method is also labour intensive and time consuming. Non-destructive methods such as the neutron probe, impedance probes or Time Delay Reflectometry (TDR), can be inserted into the ground and a reading taken without soil sampling with a soil moisture value obtained instantaneously. Alternatively, nests of probes can be placed at different depths at the same point and left to log continuously providing a continuous stream of data at that point (Rüdiger et al., 2007; Smith et al., 2012; Tetlock et al., 2019). Comparison of semi-permanent and portable probes found that, while both are capable sensors, the semi-permanent options provided better results (Starr and Rowland, 2007). However, these instrumental methods still require the device to be moved from point to point and require calibration for each field campaign if multiple locations are of interest. Calibration is time consuming if there are large differences in soil properties across a study area or with varying depth.
Over recent decades, portable and easy to use measures of soil moisture have been developed (Kaleita et al., 2005; Walker et al., 2004). The methods examined here rely on the dielectric properties of soil, which are then converted into a voltage that is proportional to the water content. However, the dielectric properties of soil are not just related to the amount of water in a soil, it is also related to soil chemistry (e.g. the amounts of salts present) as well as soil textural properties. Therefore to be able to accurately and reliably quantify an absolute soil moisture, these indirect measures require calibration to account for the various properties of the soil being studied (Kaleita et al., 2005; Walker et al., 2004). This requires soil to be collected from the site of interest, wetted to field capacity, and then allowed to dry over a period of days and weeks while at the same time weighing the mass of soil. While this will give the user a more reliable reading (Kargas and Kerkides, 2008; Tedeschi et al., 2014), this process is labour intensive and time consuming (Kaleita et al., 2005; Walker et al., 2004). If an instrument is to be used over an area with different soil properties, then a site-specific calibration can prove to be logistically challenging.
The alternative to site/soil specific calibration is manufacturer-calibration. Most instrument manufacturers offer generic calibration data based on soil properties, although the technique for calibration varies between devices (Vaz et al., 2013). Haberland et al. (2014) found that the manufacturer-calibration is often precise in laboratory settings, although underestimated water content for clay loams and clays in the field. Other studies have found a range of sensors can be used reliably with manufacturer-calibration (Geesing et al., 2004; Lane and Mackenzie, 2001). Importantly for many ‘off the shelf’ devices (such as that examined here) it is not possible to calibrate or adjust values within the device as they provide a soil moisture value only. Information such as voltage and dielectric constant of the soil is not provided. Geesing et al. (2004) presents calibration equations from their study to allow quick and easy conversion from device output soil moisture to match soil water content from core samples analysed in a lab. This provides a calibration option for devices that do not provide voltage or dielectric constant values.
The accuracy and calibration of soil moisture probe measurements has been studied intensely (Huang et al., 2004; Matula et al., 2016; Rowlandson et al., 2018; Rowlandson et al., 2013; Seyfried et al., 2005; Seyfried and Murdock, 2004). There are several studies that suggest using calibration equations for individual soil types for greater accuracy (Caldwell et al., 2018; Huang et al., 2004; Kargas and Kerkides, 2008; Seyfried and Murdock, 2004; Vaz et al., 2013), although Rowlandson et al. (2018) showed the temporal transferability of calibration equations from one year to the next increased the error of the probes compared to temporally derived calibration efforts. The requirements to gain soil texture information (a major control on soil moisture) before measuring soil moisture using a probe can be time consuming and difficult, further adding to the complexities in calibrating equipment. Additionally clay soils can often reduce the sensor’s ability to provide accurate results (Bittelli et al., 2008; Kelleners et al., 2004; Vaz et al., 2013). These challenges mean manufacturer-calibrations are commonly used rather than site specific relationships (Bretreger et al., 2021). In agricultural settings, a comparative soil moisture can often be used in assessing conditions against previous cropping cycles, i.e. assessing the spatial patterns of soil moisture temporal stability/persistence (Kachanosk and De Jong, 1988; Pachepsky et al., 2005; Ran et al., 2017). These analyses can often be done using relative measures of soil moisture from manufacturer-calibrated portable probes. Several studies have found that a large portion of information related to soil moisture can be found from the relative temporal dynamics (Brocca et al., 2014; Puma et al., 2009; Reichle et al., 2004). For practitioners this can range from agricultural assessments to fire planning to impacts from underground mining on soil moisture in predominately wet ecosystems.
The goal here is to assess two commonly available ‘off the shelf’ hand-held and portable soil moisture probes, a Theta Probe and the CS659, for their ability to quantify soil moisture using the manufacturer’s calibration. They were selected for their common use across a wide range of agricultural and environmental sites as well as the CS659 and variants being able to be installed permanently at monitoring sites (Rüdiger et al., 2007; Smith et al., 2012; Tetlock et al., 2019). For the instruments used here (and many others) it is not possible to internally calibrate raw readings to soil moisture measurements and hence is comparable to typical field measurements by many practitioners. Despite their widespread availability and use, there has been limited assessment of such commercially available ‘off the shelf’ devices. Previous research has suggested the manufacturer calibration shows precise results in a laboratory setting, although in the field the ability to reliably measure soil moisture is reduced (Haberland et al., 2014). Meanwhile others have found manufacturer calibration to be reliable (Geesing et al., 2004; Lane and Mackenzie, 2001). The soils examined are predominately clay soils further adding to the difficulties of soil moisture measurement (Bittelli et al., 2008; Kelleners et al., 2004; Vaz et al., 2013). We demonstrate that for the clay soils examined, the manufacturer calibrations are reliable for comparable measurements, or relative degree, of soil moisture for a given site which is an important measurement used by researchers and practitioners globally.
Field Data
Soils cores were collected from two sites in the Hunter Valley region of New South Wales, Australia approximately 200 km north-west of Newcastle (Figure 1). The study location, the Krui (562 km2) and Merriwa (808 km2) catchments have been well described in previous publications (Kunkel et al., 2016; Rüdiger et al., 2007). The soils in the region have a high clay content (often over 50 % clay), while cattle grazing is the predominant land use. The soil sampling technique used in the present study is outlined in Section 3.2. 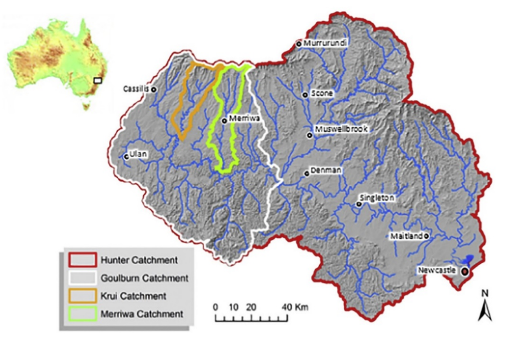
Figure 1: Location map of Krui (orange) and Merriwa (green) River catchments, Goulburn River catchment (white outline) and Hunter River catchment (red Outline) (Kunkel et al., 2019).
In recent years, the Krui and Merriwa catchments have been a focus for soil carbon assessment as well as examining hydrology and sediment transport as they have a consistency of geology, soil, vegetation, land use and relatively easy site access (Gibson et al., 2021; Gibson et al., 2020; Hancock and Coulthard, 2012; Hancock et al., 2011; Hancock et al., 2015; Martinez et al., 2009, 2010; Martinez et al., 2008; Wells et al., 2019). The soil and soil moisture data examined here have been collected as part of these projects.
Methods
Soil Moisture Probes
In this study, we use the Delta-T Theta Probe (Type ML2x) with a Measurement Engineering Australia (MEA) reader and the Campbell Scientific CS659 to quantify soil moisture (Figure 2). The devices were chosen to be representative of two of the options that would be commonly used by practitioners as they are available ‘off-the-shelf’. Whilst newer models may exist, these were the units available when sampling and data collection at the site began.
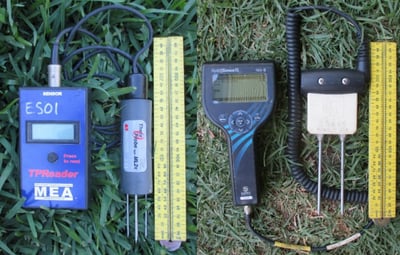
Figure 2: The Delta-T Theta Probe with MEA reader (left).
The Campbell Scientific CS659 probe and HydroSense II reader (right).
The Delta-T Theta Probe (Delta-T Devices Ltd., 1999) body is approximately 12 cm long and has a set of four 6 cm long stainless steel probes at its base, mounted in a sealed unit containing electronics. The Theta Probe is an impedance sensor operating at 100 MHz (Matula et al., 2016). To measure soil moisture, it generates a radio signal that is transmitted along the stainless-steel rods used to determine the dielectric constant of the soil. When inserted into the soil, some of the radio signal is absorbed by the soil with the reflected signal also measured with the ratio between the signals being a measure of soil moisture (Delta-T Devices Ltd., 1999). The ratio of the transmitted and received signal is converted to a voltage of between 0 and 1 Volts. Quoted accuracy is ± 5%, using manufacturer calibration, within a soil moisture range of 5 % m/m to 50 % m/m.
The Campbell Scientific CS659 has two 12 cm long stainless-steel rods with a sealed body containing electronics. The model can support longer rods (i.e. 20 cm), although these were not assessed in this study. Soil moisture is read using the Hydrosense II reader. The CS659 is a transmission line oscillator (TLO) device, similar to TDR, operating at 175 MHz as described by Caldwell et al. (2018). It measures an electromagnetic pulse and the elapsed travel time of the pulse’s reflection. This is then used to calculate soil volumetric water content. The electromagnetic pulse is attenuated by ions in the soil solution and soil mineralogy. The reported volumetric water content accuracy is ± 3% in typical soils (i.e. with an electrical conductivity < 6.5 dS/m) (Campbell Scientific Inc., 2019).
The instruments here are ‘off the shelf’ units with no modification. A point to note is that both instruments only provide a soil moisture reading. It is not possible to extract a voltage or dielectric constant so calibration with raw readings is not possible.
Field sampling
The field sampling (soil sample collection and in-situ instrumental soil moisture measurement) was conducted in 2014 and 2018 (Krui sites) and in 2015 (Merriwa sites) as part of a large project to quantify soil properties and soil carbon (Kunkel et al., 2019). The location of the samples collected covered most of the catchment area and range of soil moisture content. A summary of all data collected is displayed in Table 1. For this study, all samples and instrumental soil moisture data were collected from hillslopes and upslope areas well away from any trees in areas dominated by grassland and were considered representative of the local surrounds.
At each site, soil cores were collected at two different depths. One was collected at a 12 cm depth matching the length of the CS659 probe and slightly deeper than that of the Theta Probe (6 cm). This 12 cm depth captures the most fertile soil and biogeochemically active soil depth. A second set of cores were collected to a depth of 21 cm as this was the maximum depth of topsoil for many hillslope sites as well most of the pasture species rooting depth due to the shallow and rocky nature of the soils. This 21 cm depth allowed us to explore the capabilities of the instruments to provide information on deeper soil moisture.
For the 2014 data collection, a 0.5 m x 0.5 m quadrat was placed on the ground. From within this quadrat two soil cores (1 × 12 cm long and 9.5 cm diameter; 1 × 21 cm long and 9.5 cm diameter) were collected. The Theta Probe was directly inserted into the 12 cm and 21 cm cores that had been inserted into the ground before they were removed to obtain a measurement directly at the core location. The remaining three measurements were collected from within the 0.5 m x 0.5 m quadrat but outside the cores (3 measurements). This approach provided soil moisture data from directly within the cores and from within the 0.5 m x 0.5 m quadrat (5 measurements in total).
In 2015, a similar sampling method was employed. However, after insertion of the two steel cores, the CS659 probe was inserted into each of the cores and a single measurement recorded (two CS659 measurements in total – i.e. one in each core). Additional soil moisture measurements were not collected based on results from the previous sampling.
In 2018, a similar methodology as the 2015 data collection was employed, although in addition to the CS659 measurement, a Theta Probe measurement was taken (i.e., two measurements from inside each soil core).
To collect the soil samples, the steel cores were placed within the 0.5 m x 0.5 m quadrat, a steel cap placed on top, and the core inserted into the ground using a hammer until flush with the ground surface. The cores were then carefully removed, bagged, and transported to The University of Newcastle soil laboratory for analysis. Soil moisture was determined by the gravimetric method (Rayment and Lyons, 2010). The oven used was spatially certified with samples rotated over a 7-10 day drying period or longer. Samples were weighed at 7 and 10 days to check for constant mass and if stable, were moisture determined. If not stable, the drying was continued for several days and the sample was reweighed. A soil texture analysis (% sand, silt and clay) was also completed for each soil core sample via sieving and the hydrometer method (Ashworth et al., 2001).
For the Krui sites there were 51 and 53 soil cores collected in 2014 and 2018, respectively. In 2015, 50 sites were sampled at the Merriwa sites (Table 1). As 12 cm and 21 cm cores were taken at each site, this results in a total of 308 samples available for analysis.
The goal of the soil sampling was to collect data on the soil surface (~0-10 and ~0-20 cm) as being the most hydrologically and biologically active layers of soil. It is recognised that the 21 cm sampling depth is much deeper than both the Theta Probe and CS659 probe lengths. The 12 cm cores match the depth of the CS659. We recognise that the 6 cm probe length of the Theta Probe is less than the minimum core depth of 12 cm, however multiple studies have discussed similarities between different depths of soil moisture (Senanayake et al., 2017; Tromp-van Meerveld and McDonnell, 2006; Wilson et al., 2003) which warrants further investigation. 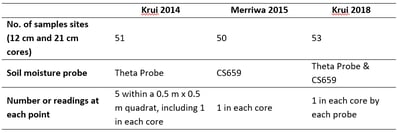
Table 1: Number of soil cores collected, device used and summary of sampling protocol used
Statistical Analysis
Analysis of results was performed by creating scatter plots of the various gravimetric and probe soil moisture readings. A correlation coefficient (R value) was calculated to assess the correlation of each dataset. Additional statistics were calculated by fitting a linear regression model within MATLAB (i.e., Root Mean Square Error (RMSE), Coefficient of determination (R2), standard error and p-value). When comparing gravimetric and field-based measurements, the 95% confidence intervals were also calculated. Finally, a quantile-quantile plot (QQ-plot) (Wilk and Gnanadesikan, 1968), which plots the quantiles of each dataset against each other, was used to assess the distributions of soil moisture datasets.
Results and Discussions
Gravimetric, Theta Probe and CS659 data
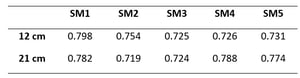
The results show that for all soil moisture datasets there is a considerable range from low soil moisture (below wilting point; ~15-20%) through to higher soil moisture (approximately field capacity; ~40-45%) (Table 2). Therefore, the data provides a good test of the capability of the instruments and the potential for developing calibration equations. An interesting finding was that for all the sites measured, there was very little difference in the average gravimetric soil moisture between the different depth cores (i.e. 12 cm and 21 cm). The minimum and maximum were also showing very similar trends between core depths.
The gravimetric soil moisture data was well within the range of moisture values that the Theta Probe and CS659 are designed to measure (between 5% and 50%). The Theta Probe produced a very similar soil moisture mean and range to that of the gravimetric soil moisture for 2014 (Table 2), while in 2015 the CS659 produced a considerably higher soil moisture mean and range. For many sites the CS659 produced a value which was approximately at the maximum readable range (i.e. a reading of 50.8%). This reading is at the highest range reported in previous studies using capacitance soil moisture probes (Wu, 1998). Additionally, as this study focuses on clay soils, which are conductive, there are dielectric losses that cause TDR or TLO readings to overestimate soil moisture (Bittelli et al., 2008).
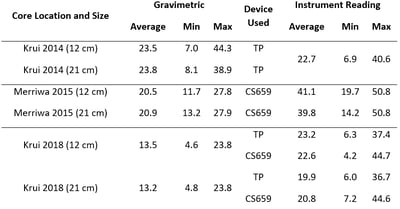
Table 2: Gravimetric and instrumental soil moisture (% m/m) data from the Krui and Merriwa sites
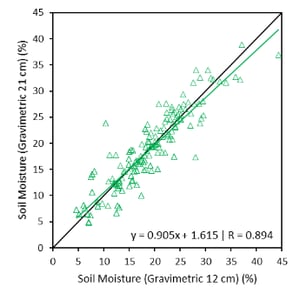
The readings of each device produced similar statistics when comparing between the 12 cm and 21 cm cores. This similarity is also featured when plotting the core soil moisture against each other for each location (Figure 3). This suggests that there may be no need to collect deeper cores for soil moisture in this environment. The R value when comparing the two depths is 0.89 while also showing a close match to the 1:1 line. This may only hold true for this dataset and should be investigated before applying this relationship elsewhere. However, soil moisture gauging stations have shown similar phenomena over the Krui sites when comparing 0 cm to 5 cm and 0 cm to 30 cm in-situ measuring sensors (Senanayake et al., 2017). The findings here are similar to studies that have found similar means between the 6 cm and 30 cm soil moisture distributions (Wilson et al., 2003) and the similarities in soil moisture at various depths from 5 cm to 70 cm and the bedrock interface (Tromp-van Meerveld and McDonnell, 2006).
Comparison of gravimetric soil moisture and instrument data
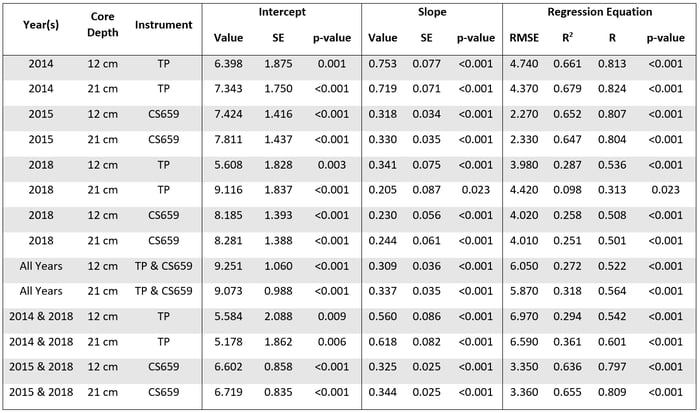
Table 3: Statistical Summary of each linear regression model. SE is the standard error and RMSE
is the root mean square error (%).
In 2014, a strong correlation was observed using an average of all five Theta Probe values for both the 12 cm and 21 cm cores (Figure 4). When performing a correlation with a single instrument measurement, rather than the average of five measurements, and the gravimetric soil moisture, the R value is slightly reduced (Table 4). The first reading of the five was taken within the soil core, simulating an in-situ measurement, and hence produced a slightly higher R value than those outside the core (although the outside measurements were still satisfactory). The averaging of the five readings produced better results than a single reading within the core or outside the core. This demonstrates that using more than a single probe reading at any one point, will likely increase the correlation with the gravimetric soil moisture as is suggested by Foley and Harris (2007). All further reference to 2014 results within this paper is from the average of all five readings as presented in Figure 4.
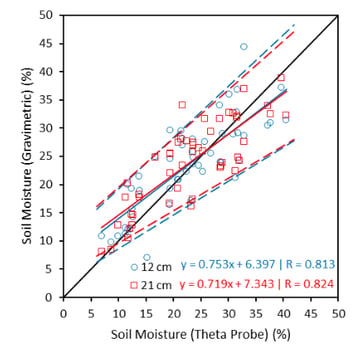
Figure 4: 2014 Krui soil moisture data. Average of all five Theta Probe readings. The Theta Probe data is compared with soil moisture from 12 cm and 21 cm deep soil cores. The black line shows a 1:1 relationship and 95 % prediction intervals are shown with dashed lines.
A consideration here is whether obtaining a reading inside a steel core (i.e. the steel core may alter the electrical properties of the soil within the core) may influence the operation and reliability of the probes. Theta Probe specifications quote a diameter of 30 mm of soil required for a reading (Delta-T Devices Ltd., 1999). All soil cores had a much larger diameter than this requirement (i.e. 95 mm). There is no specification for the CS659. The finding that the best relationship occurred from a reading inside the core suggests that the steel material and core size had little influence on the probes and their data.
The CS659 measurements from the 2015 data, were from a single reading inside each of the cores. Strong and significant correlations were observed for both 12 cm and 21 cm cores (Figure 5). However, it should be noted that there appears to be a grouping of high soil moisture values at approximately 50 % soil moisture when using the CS659. This suggests that the CS659 may be better suited to soils with lower soil moisture content, possibly because the clay soil is affecting the accuracy of the TLO reading due to its conductivity (Bittelli et al., 2008). The 2015 samples have an average clay content of 54 %. Additionally, the manual for the CS659 mentions the potential for reduced accuracy due to high clay soils and the presence of significant volume of rocks in the soil (Campbell Scientific Inc., 2019), both of which were observed at the field sites used. There is a clear bias of the CS659 results from the 2015 samples overestimating the gravimetric soil moisture. Despite this, the CS659 probe produced a correlation with all points within the 95 % prediction line (Figure 5) and a RMSE of ~2.3 % for both core sizes (Table 3).
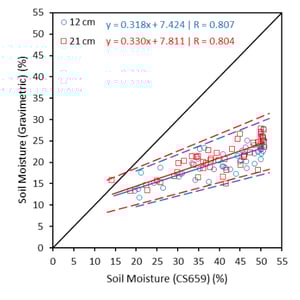
Figure 5: 2015 Merriwa soil moisture (CS659) data from a single reading in each core. The CS659 data is compared with soil moisture from 12 cm and 21 cm deep soil cores. The black line shows a 1:1 relationship and 95 % prediction intervals are shown with dashed lines.
In 2018, as both the Theta Probe and CS659 were used, it provides a direct comparison of the two devices based on the same field data. The results for 2018 show that both tested devices had a reduced R value from previous field measurements (Figure 6). It is worth noting that the average gravimetric moisture content is low for this data set. Dry conditions may produce a relationship with lower correlation compared to the 2014 and 2015 data. However, there are differences between the probes with a poor correlation noticeable in the regression for the 21 cm core measured with the Theta Probe shown in Figure 6. This poor correlation is likely due to the Theta Probe having only a 6 cm deep measurement, whereas the CS659 has longer probes to improve its estimation of soil moisture in the 21 cm core. This suggests that while there is little difference between the 12 cm and 21 cm gravimetric soil moisture data (Figure 4 & Table 2), the longer probes of the CS659 provide a more robust measurement of soil moisture at low soil moisture values. Interestingly, Kargas and Kerkides (2008) found that manufacturer calibration from the Theta Probe showed underestimations when taking readings from kaolin clay which is also observed in this plot.
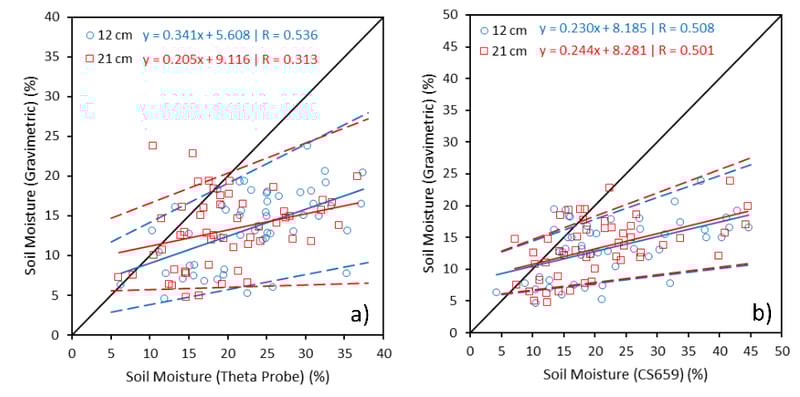
Figure 6: 2018 Krui soil moisture for the Theta Probe (a) and CS659 (b) data from a single reading in each core. The probe data is compared with soil moisture from 12 cm and 21 cm deep soil cores. The black line shows a 1:1 relationship and 95 % prediction intervals are shown with dashed lines.
Figure 7 displays all the field data combined. The results from this comparison show a weaker correlation when combining the Theta Probe and CS659 measurements. This is expected as the probes function differently. When separating the Theta Probe and CS659 results, the R value increases, further suggesting that these probes should not be used in combination. Although the CS659 regression produces a higher R value, the Theta Probe presents much closer to the 1:1 line. This is evident as the gradient coefficient in the regression equations for the Theta Probe is 0.54 and 0.60 whereas the CS659 regression produces value of 0.32 and 0.34 (Figure 7). The y-intercept also shows a differing bias between the instruments. The lower R value for the Theta Probe’s combined results is likely affected by the poor correlation seen in 2018 during a significantly dry period. The decrease in reliability of soil moisture measurement when combining all years data (2014, 2015, 2018) agrees with previous studies that have found transferring calibration equations temporally reduces measurement accuracy (Rowlandson et al., 2018).
Interestingly, correlations that combine all readings of a single device show a RMSE of 6.6 % to 7 % and 3.3 % to 3.4 % for the Theta Probe and CS659, respectively. This error is higher than expected based on values reported in device manuals (± 5 % for the Theta Probe and ± 3 % for the CS659). The higher RMSE found for the Theta Probe may be due to the 6 cm probe length being mismatched with the 12 cm and 21 cm core depths. This is in comparison to the CS659’s 12 cm penetration depth which when combined returned a much lower RMSE. Future assessment should include a 6 cm soil core matching the depth of the Theta Probe.
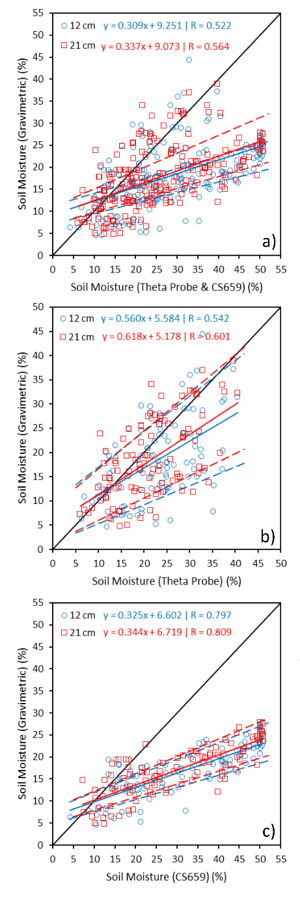
Figure 7: Combined soil moisture from all field campaigns (2014, 2015 and 2018) from both probes (a), Theta Probe (b) and CS659 (c). Probe data is compared with gravimetric soil moisture from the 12 cm and 21 cm deep soil cores. The black line shows a 1:1 relationship and 95% prediction intervals are shown with dashed lines.
The comparison of soil moisture distributions between various field data sets has been compared using QQ-plots. Figure 8 shows the QQ-plot for the average of the five 2014 Theta Probe measurements against the 21 cm core lab based gravimetric soil moisture. The plot shows a close match to the 1:1 line, meaning both the field and lab-based measurements follow a similar distribution. QQ-plots showing the distribution of other years of data are not presented, although show a very similar phenomenon. The 2015 CS659 measurements contain deviations from the trend of their QQ-plots due to the clustering of probe measurements at approximately 50 % soil moisture (See Figures 4 and 6). The trend line plotting closely to the 1:1 line demonstrates the Theta Probe is representing relative moisture content well across these field samples. These patterns in the QQ-plots are similar to those presented by Chen et al. (2020) when assessing sub-daily Bayesian model averaging soil moisture predictions.
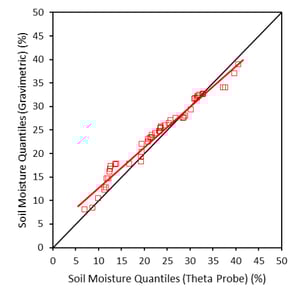
Figure 8: A QQ-plot of the 2014 average Theta Probe readings with the 21 cm core measurements. The black line shows a 1:1 relationship, which indicates a normal distribution.
Soil Texture
The soils examined here are all derived from basalt and have high clay content (Kunkel et al., 2019). It has been reported that probes such as that used here may be less reliable in clay dominated soils (Bittelli et al., 2008; Kelleners et al., 2004; Vaz et al., 2013). Hence the soil moisture data (both gravimetric and probe data) is examined for its relationship with soil texture, particularly clay. The clay percentage and instrument soil moisture showed a poor correlation (not presented). For example, the 2014 results based on the texture for the 12 cm and 21 cm cores produced an R value of 0.18 and 0.21 respectively. Additionally, no acceptable correlation was found with the sand or silt soil texture percentages. These findings suggest that there is no relationship between the soil texture from a sample and the accuracy of the probes used. It is worth noting the homogeneity (i.e. consistent high clay content) of the soil samples used in this study and hence this finding may not be applicable to other settings. In uses with a heterogeneous soil, the locations with higher clay content may influence probe readings as in Kargas and Kerkides (2008).
Strengths and limitations
Quantifying the spatial and temporal distribution of soil moisture is essential for water resource management, rainfall and runoff modelling and flood prediction. Agricultural water use is dictated by soil moisture state as well as fire risk prediction. Hence improved field assessment of soil moisture as well as prediction provides a vital role in managing water resources at local, national and global scales.
For all datasets, neither the Theta Probe nor CS659 demonstrated a 1:1 relationship with gravimetric soil moisture as demonstrated by the slope of the regression (Figures 3, 4, 5 and 6). However, the Theta Probe produced a plot that is closer to the 1:1 line compared to the CS659. If the instruments are to be used for a true or actual soil moisture measurement, they require calibration as discussed by Vaz et al. (2013). The Theta Probe will likely produce a value closer to the true gravimetric soil moisture when comparing manufacturer-calibrated readings. If a value is required for comparison, the value can be obtained with either probe but potential limitations of each probe must be known. The findings here can assist. Previous literature provides evidence of the importance and use of relative measures of soil moisture ranging from remote sensing, land surface modelling and soil moisture temporal persistence (Brocca et al., 2014; Puma et al., 2009; Ran et al., 2017; Reichle et al., 2004). The quick reading time of the Theta Probe and CS659 make them a valuable tool for operational use for assessing these relative soil moisture conditions that can help practitioners in assessing agricultural landscapes or impacts from underground mining operations on soil moisture temporal persistence.
The RMSE of each dataset, presented in Table 3, shows values approximately equal to the quoted accuracy reported in the manuals of ± 5 % for the manufacturer calibrated Theta Probe (Delta-T Devices Ltd., 1999) and ± 3 % for the CS659 (Campbell Scientific Inc., 2019). The manufacturer calibrations are assessed in other studies finding RMSEs ranging from ± 4.8 % to ± 17.1 % (Tedeschi et al., 2014). After calibration this RMSE was reduced to between ± 2 % and ± 4 %. While these soil specific readings proved more reliable than the ones presented within this paper, it suggests the results are reasonable, especially considering the use of manufacturer-calibration in clay soils.
The probes performed well across a range of moisture contents (Table 2) with extremes of wet and dry conditions. Both probes provide more reliable data at mid-range soil moisture content. Multiple readings at a single site will likely improve results (Table 4 and Figure 4). An interesting finding here is that the results show that the relatively shallow measurements of the probes can estimate soil moisture at deeper depths based on these 12 cm and 21 cm core readings. The differences in the slope and y-intercept for each regression equation indicates a differing bias of each probe. The results of this work may aid in the conversion of the soil moisture readings from similar equipment to an equivalent gravimetric soil moisture in a similar method as presented by Geesing et al. (2004). The use of a regression equation, similar to that calculated for this study was found to be the most effective method for calibration in lab analysis by Matula et al. (2016).
The results reported here are for soils with a high clay content. Nevertheless, there are many areas in Australia and globally where soils have a high clay content, therefore these results will be of interest. It is recognised that the probes need to be assessed for soils with different textures and water holding capacity so that further understandings can be obtained for a wider range of environments. However, collecting sufficient soils over a range of moisture states and determining their textural properties is a costly and time-consuming task. Hence, few assessments such as this have been undertaken and/or results reported. We intend to continue this analysis as opportunities in different environments arise.
Conclusions
The accuracy and reliability of portable (or handheld) ‘off the shelf’ soil moisture probes to measure soil moisture are quantified for soils with a high clay content. The results demonstrate these probes can be used with a level of confidence for comparable soil moisture quantification. It was not possible to further refine the data as the instruments provide a soil moisture reading only. Access to voltage and dielectric constant may improve the results via internal calibration, rather than relying on post-processed data being converted.
The method employed here took either five soil moisture readings within close proximity to each other (within a 0.5 m x 0.5 m quadrat) or single readings from within a soil core within the 0.5 m x 0.5 m quadrat. A single reading using a Theta Probe or the CS659 can produce a reliable measure of soil moisture, although taking more measurements (i.e. 5) may improve results. Neither of the instruments demonstrated a 1:1 fit with gravimetric soil moisture, although they do allow a reliable measurement of comparable moisture. The comparable moisture data is an important value for many users ranging from farm managers to natural resource managers and researchers.
The results demonstrate that both methods can provide a reliable measure of comparable soil moisture at both 12 cm and 21 cm depths. This is an important finding for practitioners in various environmental fields ranging from agricultural, hydrology and mining as these depths are the most hydrologically and biologically active soil depths. It is important for potential users of these devices to understand the potential limitations, especially in high clay soils as examined here. Further work is needed to validate these instruments for different soils (i.e. more sandy soils) with different water holding properties.
Conflicts of Interests
The authors declare no conflicts of interest.
Acknowledgements
The families and property owners of the Krui and Merriwa catchments are thanked for giving us access to their land. Without their assistance, this study could not have been conducted. This research was funded by an Australian Research Council Discovery Grant (DP 0556941: “Carbon, nutrient and sediment dynamics in a semi-arid catchment”). David Bretreger and Abraham Gibson are supported by Australian Government Research Training Program Scholarships. Abraham Gibson is also supported by a CSIRO PhD Top-up Scholarship.
Author Biographies
David Bretreger | David is an environmental engineer with experience in hydrology, remote sensing and soil science fields including roles in both academic and government. A large focus of the projects David has been involved in are related to understanding human influenced ecosystems and water management.
Greg Hancock | Greg received his PhD in 1998 from the Department of Civil, Surveying and Environmental Engineering at the University of Newcastle, Australia. He is currently an Associate Professor in the Discipline of Earth Sciences at the University of Newcastle. His research interests are (1) the long-term dynamics of geomorphic systems, (2) the interactions between landscape geomorphology, hydrology and erosion and (3) soil carbon dynamics. He has extensively tested and used soil erosion and landform evolution models for both theoretical and applied situations such as mine sites.
In-Young Yeo | In-Young is an Associate Professor of Civil, Surveying, and Environmental Engineering at the University of Newcastle (UoN). In-Young is primarily interested in understanding the interface of land and water systems where the human and physical systems interact and evolve together. Her research focuses on elucidating the drivers, changes, consequences and feedback loops between these two systems, under the climate changes and human development pressure. She pioneers the integrative uses of remote sensing, in-situ data, and process-based or statistical models to understand the emergent land surface properties and hydrologic processes, predict their change dynamics, and provide site-specific science-based advice to guide sustainable resources management.
Dr Cristina Martinez | Cristina is Manager (Sustainable Cropping Systems – North) at the Grains Research and Development Corporation (GRDC). She has a PhD in Environmental Science with experience in the field of biogeochemical cycling of C and N in soils. Previously, she was a Senior Lecturer at The University of Queensland working within the Soil Science and Agronomy groups, working on soil carbon dynamics, enhanced efficiency nitrogen fertilisers and the role of legumes for improving nitrogen use efficiency (NUE) in agricultural production systems.
Dr Tony Wells | Tony is a scientist with 38 years experience in both industry and academia. Over the years his research has covered topics as varied as exoplanets, landscape evolution, biological corrosion, soil water and carbon dynamics and applications of supercritical fluids. His work has encompassed modelling, laboratory and field work including work related to the interrelationships between temperature, water availability and soil carbon levels in semi-arid catchments.
Tristan Cox | Tristan is a current MPhil student investigating soil health in topsoil stockpiles on coal mine sites in the Hunter Valley of NSW, Australia. This research aims to increase our understanding of topsoil stockpiling, improving soil management on coal mines for
it to then be used with post-mine rehabilitation plans.
Veikko Kunkel | Veikko is an experienced research professional with a demonstrated history of working in the higher education industry. Skilled in E-Learning, Data Analysis, Lecturing, and Educational Technology.
Abraham Gibson | Abraham is a postdoctoral research fellow at Southern Cross University. His areas of interest include catchment scale dynamics in soil carbon, hydrology and drought. His passion is developing better information for help land managers understand the temporal variability in the processes that impact their ability to farm sustainably.
Share