


A multi-facet data-driven technique for proactive management of wastewater main blockage


Abstract
Maintaining an acceptable level of performance of Wastewater Mains (WWMs) entails minimal to no interruptions, nonetheless, blockage is significantly impacting WWMs, causing overflows, impacting customers and the environment. To address this, a strategy for assessing the proneness of WWMs to blockage using Extreme Gradient Boosting (XGBoost), Weibull Accelerated Failure Time (WAFT) model and Associated Rule Mining (ARM) was developed. By computing the Blockage Risk Classes (BRCs) using the Probability of Blockage (PoB) and the Median Time to Blockage (MTTB), inspection and maintenance prioritisation rules were developed. The strategy predicted WWM blockage to 95.16% accuracy, estimated blockage rates and the attributes contributing to the risks for different materials. This model is expected to save 60% of Preventive Maintenance (PM) costs by reducing the Preventive Maintenance Frequency (PMF) rate by 39%.
Introduction
According to the 2022-23 financial year report of the Australian Bureau of Meteorology (BOM 2023), there were 22 Wastewater Main (WWM) breaks and chokes per 100 km per year from the 159,754 km of wastewater mains and channels used by the 87 major urban utilities in Australia. This implied over 35,000 breaks and chokes affecting over 57,000 connected properties. This number has remained unabated in the past decade with 42,000 to 70,000 house connections facing the same fate year after year. Blockage resulting from the accumulation of fats, oil, grease (FOG), debris, rags, and penetration of tree roots into the WWMs have been identified as one of the core contributors of sewage overflow (Faris et al. 2024, Otuska et al. 2020). Unfortunately, the combined impacts of blockage and other environmental, physical, and operational factors such as poor maintenance management practices have helped in accelerating WWM deterioration (Salihu et al. 2022). This implies increased failure rate, which will result in increased maintenance cost. Since the importance of effective management of WWMs cannot be overstated because the consequences of blockage are enormous, it became imperative to develop a smart strategy of maintenance management.
Background of wastewater mains blockage prediction
The impact of blockage on wastewater networks is well-known to result in a range of issues that can include failure of equipment, leaks, breaks, deterioration, and odour problems. These challenges cause increased health and environmental hazards (Liu et al. 2021, Owolabi et al. 2022), service disruptions, unplanned renewal work, increased cost of asset management, as well as legal and regulatory compliance issues (Ana and Bauwens 2008, Caradot et al. 2017). When partial WWM blockage occurs, flow is inhibited, and overflow may be imminent with any form of network overloading caused by rainfall. Nonetheless, complete blockage will quickly trigger overflow from maintenance holes in a very short time interval (Alshami et al. 2022) causing health and environmental concerns.
Even though it may not be the best practice to compare the management effectiveness of WWMs across utilities and geographical locations because of the differences in triggers (Marlow et al. 2010), it is important to identify the most effective way of identifying blockage to better serve the community. Hence, numerous studies have relied on historical data to predict the blockage of WWMs. Okwori et al. (2021) depended on spatial statistics to understand the spatial variation of blockage by analysing the k-function of a wastewater network and used geographically weighted Poisson regression to identify the association of blockage with different features. They linked materials, number of service connections, root intrusion, and distance to restaurant to significant spatial heterogeneity of blockages in WWM, and predicted blockage to 60% – 80% Area Under the Curve (AUC) accuracy level using Random Forest (RF) algorithm. Similarly, a stochastic modelling technique was used to characterise random blockages by other researchers who relied on exponential, Gamma, and Weibull distributions for their work (Jin and Mukherjee 2010). The study utilised Kolmogorov-Smirnov (KS) and Anderson-Darling similarity tests to analyse the time of blockage before fitting stochastic models that described the expected trends of blockage over the lifecycle of the studied WWMs. The study affirmed the known fact that increased human activities have a direct correlation with the blockage pattern of WWMs (Okwori et al. 2021, Yusuf et al. 2023). Again, other studies such as those carried out by Santos et al. (2017) relied on different stochastic models that included non-homogeneous Poisson Process (NHPP), classical decision tree algorithms (e.g. Classification and Regression Tree (CART) and RF), WAFT model and the Linear Extended Yule Process (LEYP) for blockage prediction. The study posited that the classical decision tree algorithms (CART and RF) were most suitable for a short-term blockage prediction while WAFT was favoured for medium term blockage prediction. The authors favoured both the NHPP and the LEYP for WWM blockage because of their overall robustness in predicting blockage in the short, medium, and long term.
Distributed RF was used to predict tree root blockage of WWMs to facilitate the creation of hotspots along wastewater network (Ossola et al. 2023). The analysis affirmed that tree density determined as the count of tree stems and environmental variables such as slope, soil acidity, and water content were important in describing the variability in tree root blockage. In another study, Mateo Perez et al. (2021) relied on RF to predict FOG content of wastewater inlet to a treatment plant to an accuracy of 73%. The work relied on the input flow rate, pH, water temperature, conductivity, and ammonia records from the supervisory control and data acquisition (SCADA), tons of FOG measured from container delivery notes (matched against the SCADA times) and rainfall record.
Effective management of WWMs requires PM, which involves hydraulic and mechanical cleaning such as balling, jetting, flushing, rodding and using a bucket machine. Fontecha et al. (2016) utilised a combined maintenance and routing optimisation that used maintenance model to estimate the optimal time of PM operation. The authors also used a mixed integer approach to route crews and equipment to geographical locations to optimise operation and achieved a 50% cost savings in comparison to the traditional approach. Zaman et al (2013) estimated the time for on-site high flushing of WWMs with a simple regression model that had a predictive power of 73.6% after field data validation.
Since blockage is location dependent (Marlow et al. 2010), it is important to utilise hybrid and multi-faceted approach to predictive modelling to facilitate better understanding and enhanced management. To this end, this study aims to develop WWM blockage management strategy by using supervised machine learning - XGBoost to predict blockage and BRCs by relying on the PoB. This will help to minimise the inherent bias associated with relying only on predictive accuracy for judging WWM blockage because BRC will consider a broad range of blockage likelihoods across a wastewater network. Furthermore, this approach favors inspection and maintenance of WWM based on BRCs in consideration of the MTTB. By introducing unsupervised learning in the form of ARM, prioritisation of inspection for the most vulnerable mains in a wastewater network can be reliant on the logic borne out of key physical, environmental, and operational attributes of operational areas.
Method
The records used for this study were obtained from Unitywater, which is one of the major utilities in Australia that provide water and wastewater services to a population of over 800,000 residents of Southeast Queensland. This 11 years of records consists of blockage recorded for different WWM materials operating at different catchments with varying environmental and operational conditions. The procedures, analytical steps and expected outcomes of the various evaluations carried out in this study are summarised under the analytics architecture shown in Figure 1.

Figure 1: Wastewater Main (WWM) blockage analytics architecture
Historical records comprised of 40045 incidents of blockage failures and normal WWMs were pre-processed by removing duplicated records, filling, and removing missing values, and transforming features. Various attributes of the WWMs such as age at blockage, structural integrity, length, material, operating catchment, soil acidity, installation depth, diameter, vegetation, soil type and the equivalent population (EP) of the catchments were obtained from the organisation’s database and publicly available data. Since more than 95% of the blockage failures were concentrated on Asbestos Cement (AC), Vitrified Clay (VC), Unplasticised Polyvinyl Chloride (PVCU), and High-Density Polyethylene (HDPE), the rest of the materials were classified as others. The EP of the operating catchments of the were categorised into 5 groups. Areas with less than 500 EP were classified as Very Low Population Area (VLPA) whereas Low Population Area (LPA) has 500 to 4,999 EP, Moderate Population Area (MPA) has 5,000 to 9,999 EP, High Population Area (HPA) has 10,000 to 14,999 EP and Very high Population Area (VHPA) has ≥ 15,000 EP.
After pre-processing the data, 34,862 records that consisted of 25,890 normal and 8,972 blockages were used for training and testing the XGBoost model.
Background of wastewater mains blockage prediction
XGBoost is a tree-based algorithm (Jerome 2001) that relies on the residuals from the original trees to build sequential sub-trees that will minimise error in the cost function (Torlay et al. 2017). The algorithm is notably efficient in scalability, optimisation of memory usage and decreasing execution time (Dhieb et al. 2019, Ma et al. 2020). Given a set of WWM attributes x = (x1, x2, . . ., xn) for known blockage status y, XGBoost aims to optimise the loss function (ℓ) given in the objective function (ℓ) in Eqn. (1) (Zhao et al. 2022).
Here, F is the basic model of the k number of trees, Ω is the regularisation function (see Eqn. (2)) used for tuning the model to avoid overfitting using - the weights (ω), number of leaves of each tree (TL), the split threshold (ƴ), and regularisation constant (λ) which controls the strength of regularisation.
![]()
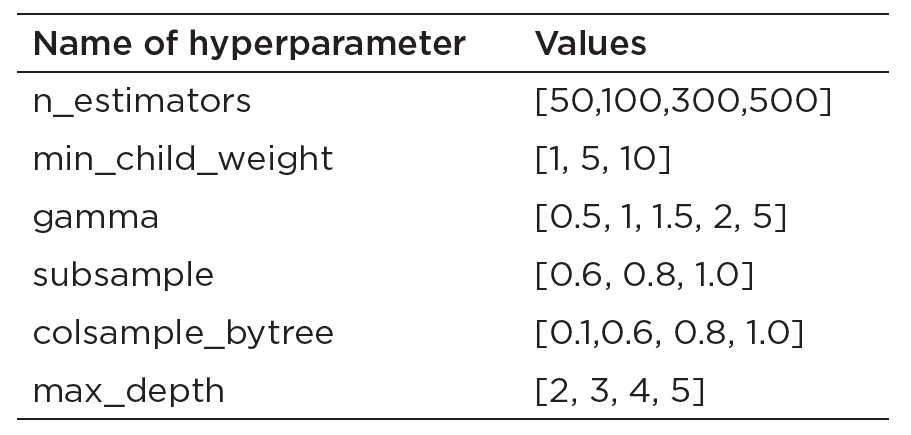
Prior to training the model, the dataset was split into 75:25 ratio of training and testing. The training data (75% of the dataset) was subjected to the Synthetic Minority Oversampling Technique (Chawla et al. 2002) to upsize blockage failures, which are about a third of the normal WWMs. This step helps to improve the performance of the model by reducing bias towards the majority class (normal WWMs) and minimise overfitting and underfitting. Gridsearch (see Table 1) was done on the oversampled 75% training dataset to obtain the best hyperparameter set for the model by using a 5-fold cross-validation technique. This step is necessary for ensuring the robustness of the training model considering different sections of the training data when determining the accuracy of hyperparameter sets.. The best performing trained model based on the gridsearch of the hyperparameters in Table 1 as measured with different metrices – recall, precision, F1 score and ROCAUC was used for predicting the test data (25% of the dataset) to determine the performance of the model.
Table 1: Hyperparameter set for 5-fold cross-validation modelling with XGBoost classifier
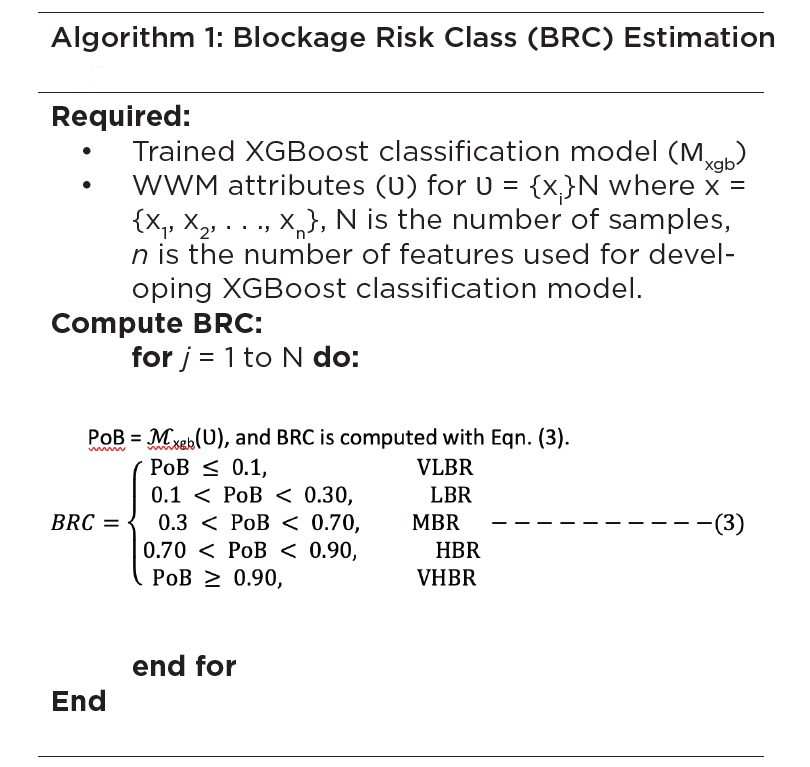
Blockage Risk Classes (BRCs) Estimation
Estimating BRCs is vital for optimal management of WWMs. Since blockage can be attributed to different factors such as material, soil type, slope, soil acidity, and vegetation (Ossola et al. 2023, Okwori et al. 2021), knowing the BRCs enhances the understanding of the combined effects of the various factors. To this end, understanding BRCs can be helpful in planning, prioritising and costing WWM PM in consideration of operational, physical and environmental attributes of WWMs. By relying on the trained model discussed in the previous section, the PoB was computed and then used for computing the BRCs as VLBR, LBR, MBR, HBR, and VHBR following algorithm 1.
Weibull Accelerated Failure Time (WAFT) Model
Understanding the BRCs helps to classify the risk of blockage, but more information from the risk classes is necessary for making decision concerning PM. This makes it imperative to use the WAFT model to compute the Median Time to Blockage (MTTB) by using blockage times (from the work order records), which were left and right censored.
Accelerated Failure Time (AFT) models work on the assumption that the impacts of covariates is multiplicatively proportional to the survival time (Saikia and Barman 2017). Hence, the model in Eqn. (4) describes how the WWM attributes x {x=x1, x2, . . ., xn} relates to the survival time T of blockage (Saikia and Barman 2017, Liu et al. 2023), which is the time lapse prior to blockage failure of the WWMs.
![]()
Here, β₁, . . ., βn represent the coefficients of the WWM attributes, β₀ is the intercept of the model, σ is the scale parameter and ε is the residual that assumes a specified distribution.
The residual (ε) has been assumed to follow Gumbel distribution; thus, the survival time S(t) at time t, MTTB and the BR (in blockage/yr./km) will be following a Weibull distribution pattern (Liu et al. 2023) per Eqn. (5). Note that the number of blockages (NoB) occurring across the total Length of blocked WWMs (LoB) in km and the number of years of collecting the data (NoY) were used to convert the MTTB to blockage/yr./km or per 100km by multiplying the output by 100.

Association Rule Mining (ARM) and Maintenance Planning
ARM discovers the pattern of frequently occurring events in records to facilitate the understanding of correlations (Nahar et al. 2013, Tandan et al. 2021) and inform decisions about future event trends. In this study, ARM has been employed to understand the pattern of occurrence of WWM attributes in BRCs to facilitate maintenance planning, design and renewal of WWMs. The association rule existing between the BRCs and WWM attributes Xatt is expressed as Xatt→BRCs for Xatt (antecedent) and BRCs (consequent) denoted as disjoint sets. The effectiveness of the rules was measured with Eqn. (6) that depends on the frequency of occurrence (Freq) to compute support, confidence and lift. Since VHBR category of the BRCs is the major cause for concern, the patterning rules was focused on the VHBR attributes of the WWM materials such as AC, VC, HDPE and PVCU using the confidence of 0.8 and support of 0.01. Using this level of support makes it possible to capture the majority of WWM attributes that will influence the BRCs, hence, capturing the impacts of minority attributes. The count of the antecedent’s attributes formed part of the decision for accepting a rule because the more the attributes, the better representation of BRCs contributing factors. Hence, a better consideration of the true impact of such attributes on blockage. Prior to the execution of ARM, the continuous features such as age, length, depth, and diameter of the WWMs were categorised.

Cost of Wastewater Main (WWM) Preventative Maintenance (PM)
To calculate the cost of WWM PM involves identifying the expected number of WWMs in the various BRCs and determining the PMF over a certain period. Since WWMs in VHBR are expected to be the most vulnerable to blockage, their PMF (PMFVHBR) and Blockage Rate (BRVHBR) was used as the benchmark for mapping the PMF of the other BRCs per Eqn.(7) using BRHBR, BRMBR, BRLBR and BRVLBR that respectively represent the BR of HBR, BR of MBR, BR of LBR and BR of VLBR. Note that PMFHBR, PMFMBR, PMFLBR, and PMFVLBR are the PMF of HBR, PMF of MBR, PMF of LBR and PMF of VLBR.

The average cost of WWM PM (Costavg) in the network was determined by computing the average work order cost of all the WWM PMs carried out over a 10-year period. The expected PM cost for the various financial years in the historical records was determined with Eqn.(8) using the number of PM (NPM), PMF and the 5 BRCs over the stipulated period.

Results and Discussion
Descriptive Results of Wastewater Mains (WWMs) Blockage
The input features used for this study have been identified from previous studies (Ugarelli et al. 2010, Marlow et al. 2011, Ossola et al. 2023) as being among the core contributors of WWM blockage. Their impact on blockage can vary across different locations due to the synergy of maintenance management practices with the environmental and physical attributes of the WWMs. The distribution of some of the input features used for the model (Figure 2) shows that the median age of blockage, which represents the time 1 in 2 WWM in the network experienced blockage is 33.2 years. VC (47%) and PVCU (29%) materials had the most blockages across the 716.7 Km of recorded length of blocked WWMs. This length consisted of VC (339.1 km), PVCU (211.8 km), AC (127.3 km), HDPE (13.2 km), and other materials (25.3 km). Over 91% of the blockages happened in WWMs made of 150-249mm diameter material, which constituted over 96% of the House Connection Branches (HCBs). Again, over 75% of blockages happened in WWMs installed at a depth of less than 2.49m. This can be attributed to foreign materials such as FOG, diapers and tree roots intruding into the WWMs from households and the environment. It is important to note that flow restrictions in smaller diameter pipes, number of joints and poor sloping can facilitate blockage failures (Ugarelli et al. 2010). Furthermore, the deterioration of WWM joints makes tree root intrusion into the WWM easier.
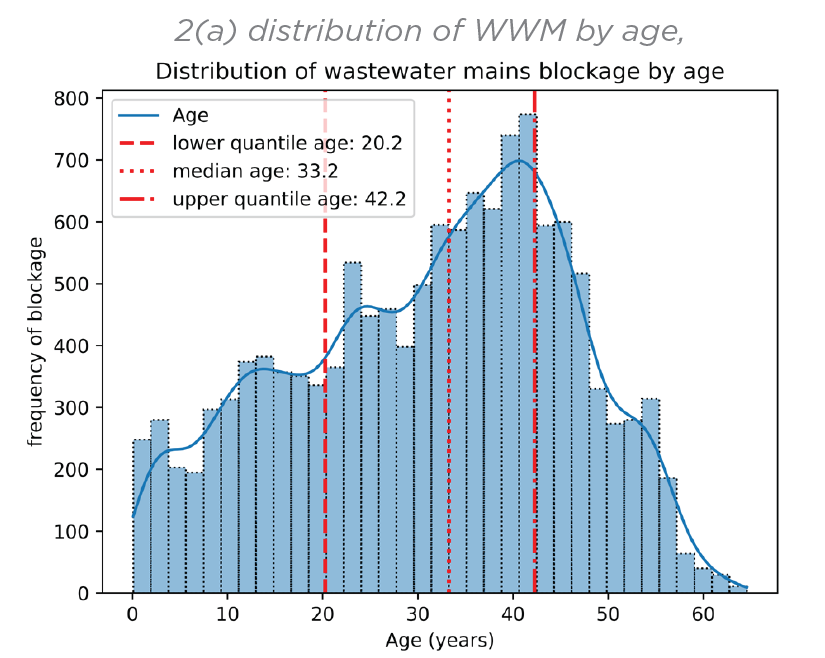
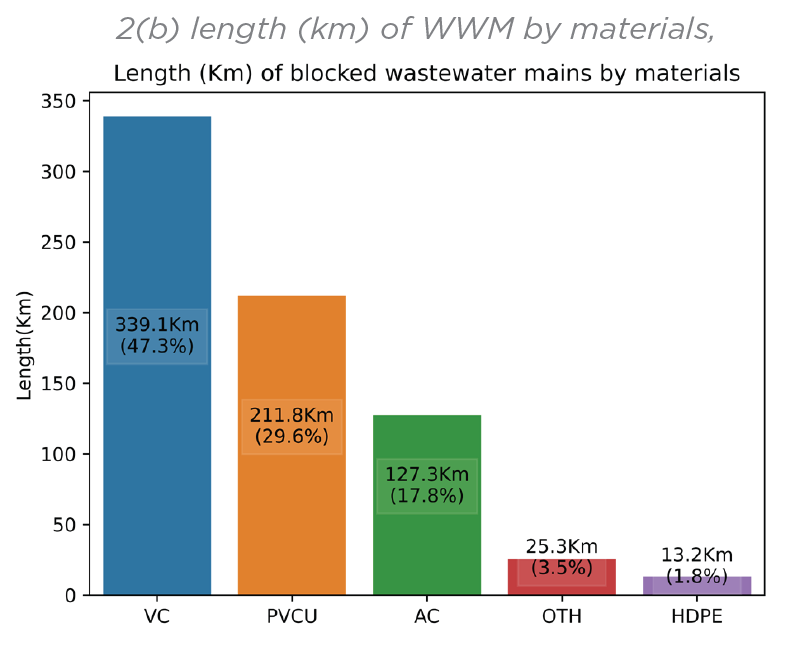
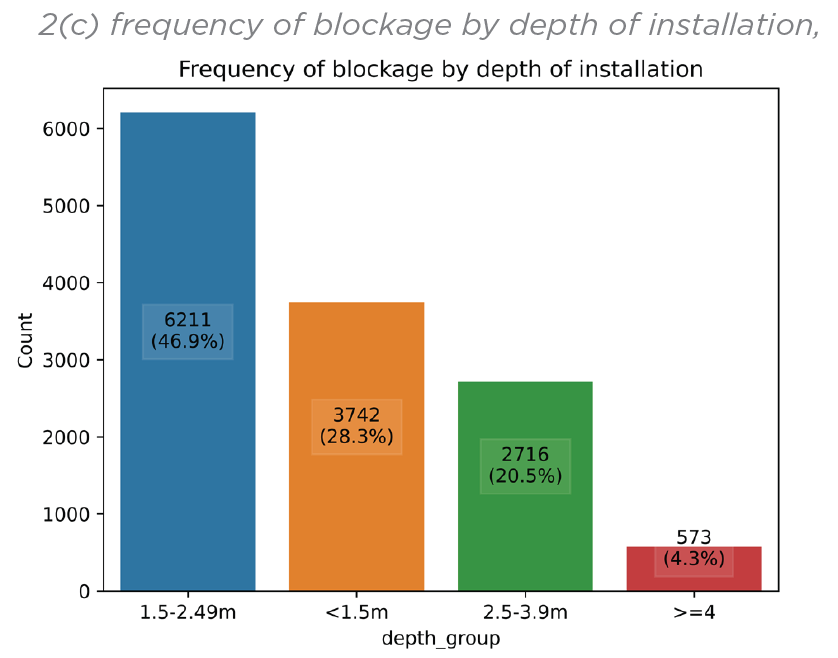
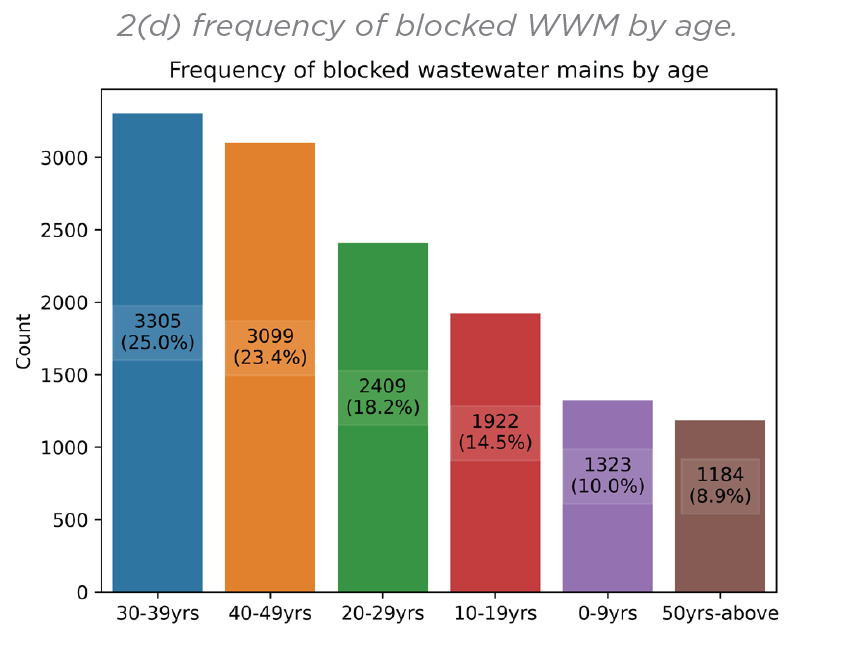
Figure 2: Distribution of some of the input variables of the model: (2a) distribution of WWM by age, (2b) length (km) of WWM by materials, (2c) frequency of blockage by depth of installation, (2d) frequency of blocked WWM by age.
Predictive Modelling of WWM Blockage
Table 2 summarises some of the predictive outcomes of a 5-fold cross-validation of the training data to obtain the best hyperparameter set from 2878 combinations of the hyperparameter sets. The prediction accuracy metrices of the test data sample was obtained with the best performing hyperparameter set by computing the confusion matrix, ROCAUC, classification report, and variable importance (Figure 3).
Table 2: Sample results of the trailed hyperparameter sets showing the best set (in bold)
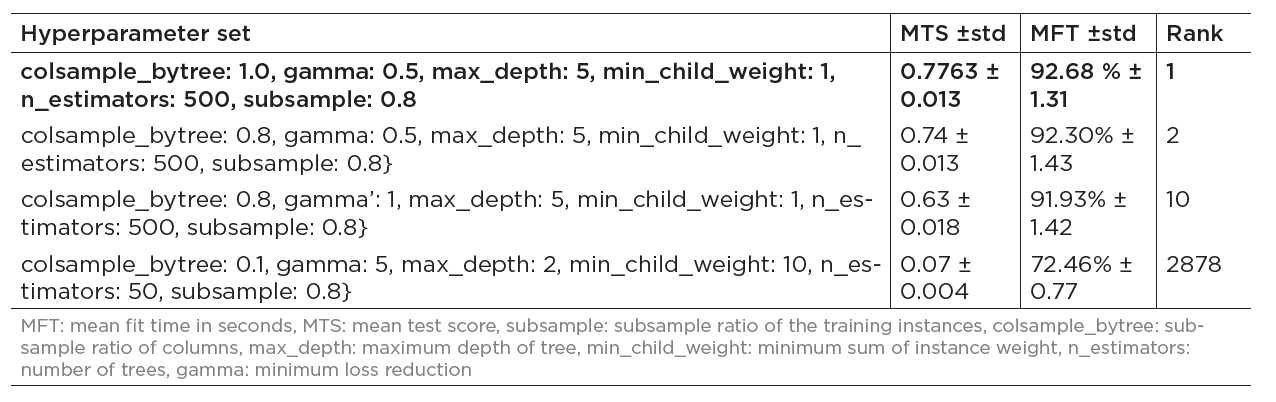


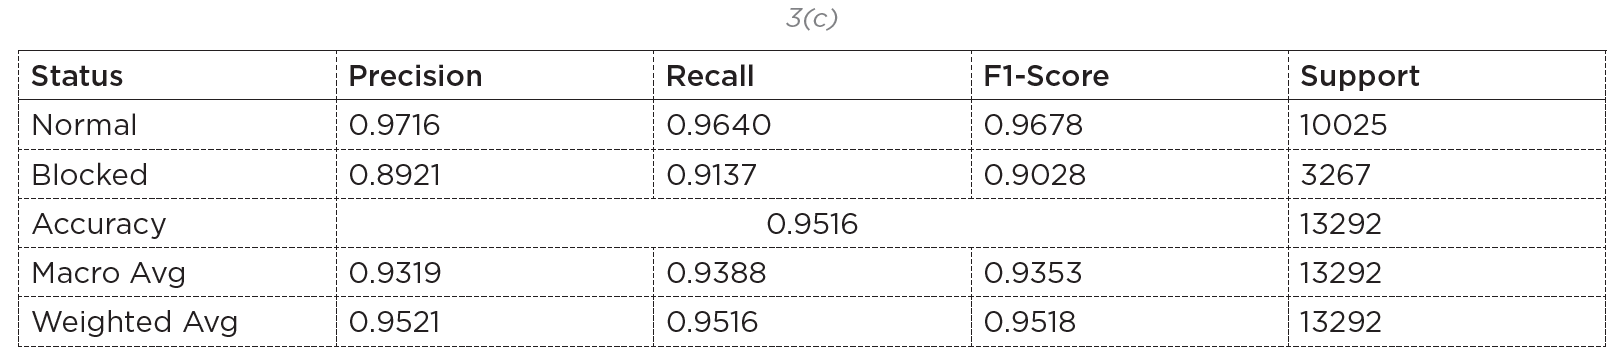
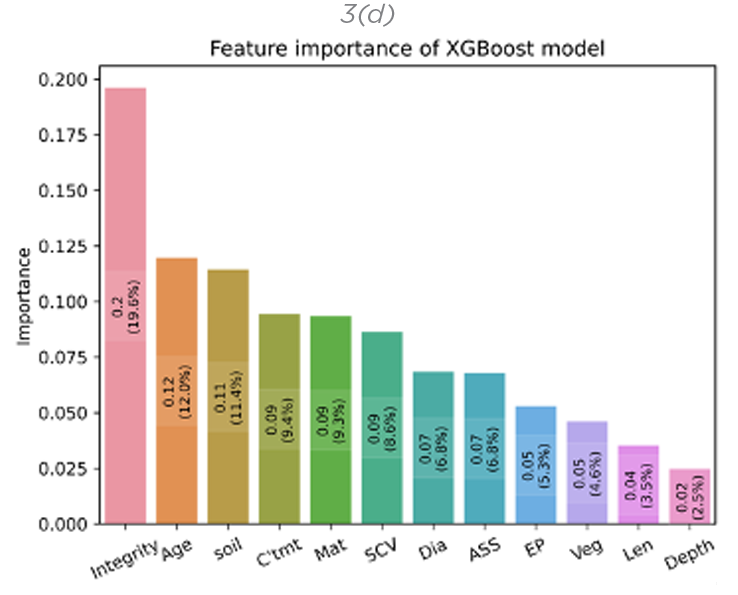
Figure 3: Prediction accuracy metrices of the test data - (a): Confusion matrix of the test data, (b) Receiver Operating Characteristics Area Under the Curve (ROCAUC), (c) Classification Report of the test data, (d) Variable importance of XGBoost model. Mat: material, C’tmt: catchment, ASS: acid sulphate soil, veg: vegetation, Len: length, EP: equivalent persons
The model was able to predict the blockage status of the WWMs (test data) to a 95% accuracy with normal WWMs(those that were not blocked) predicted to over 96% accuracy (precision: 97.33%, recall: 96.44%, f1-score: 96.88%). This accuracy level is higher than those of WWMs that have blockage failure (precision: 89.33%, recall: 91.89%, f1-score: 90.61%). It can be inferred from the overall accuracy that 9 in every 10 WWM studied had a correct prediction. Although the study carried out by Okwori el al. (2021) using RF depended on different features such as sevice connection count, tree roots intrusion risk, self-cleaning velocity risk, the accuracy of 50-80% (ROCAUC) obtained is less than the results of this study. The same can be said of the work of Bailey et al. (2016) that obtained 65-72% (ROCAUC) accuracy using decision tree and input features such as diameter, length, catchment , self-cleaning velocity, catchments, slope, and property ages.
The predictive importance of the model ranged from 2.5% to 19.6% with integrity, age, and soil being the three most prominient features impacting blockage. Even though predictive feature importance is a localised measure of a model’s influential features, it can give comparative information of the features that contribute to blockage.
Median Time to Blockage (MTTB) and Preventative Maintenance Cost Analysis
The current PM approach in the wastewater network involves using Closed-Circuit Television (CCTV) to monitor WWMs to identify hotspots, and the implementation of 3 and 6 monthly pressure cleaning of identified hotspots with known blockage history per historical work order records. The hotspots were predominantly older WWMs designed with smaller diameter pipes in low laying areas that were characterised by poor self-cleaning velocity.
The MTTB of the various WWM materials used for the studies were determined with the WAFT model based on a 30-year timeframe as shown in Table 3. AC material with a MTTB of 10.31 years blocks 67% to 80% faster than VC, PVCU, and HDPE and WWM in VHBR have a MTTB of 3.05 years, which translates to 52.83 blockages/year/100Km. WWMs at VHBR will block more frequently than the rest of the BRCs and will have 41% to 97% more blockages than HBR, MBR, LBR and VLBR.
Table 3: Comparison of the Mean Time to Blockage (MTTB) and
blockage rates by materials and Blockage Risk Classes (BRCs)
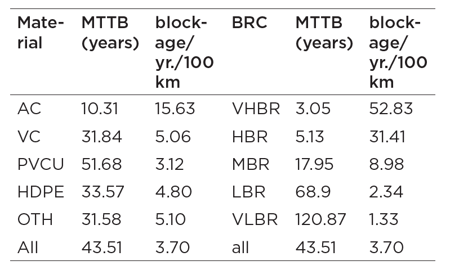
The estimated BR, which is 3.12 to 15.63 blockage/yr./100km for the various WWM materials and 1.33 to 52.83 blockage/yr./100km for the BRCs are not different from the findings of other studies. For instance, Okwuori et al. (2020) obtained a blockage rate of 2 to 61 blockages/yr./100km for studied WWMs in the Swedish municipalities whereas Bailey et al. (2015) obtained 0.2 to 90 blockages/yr./100km for some studied areas in England. On the other hand, the 10 to 20 blockages/yr./100Km (Arthur et al. 2008), and 20 to 120 blockages/yr./100km (Desilva et al. 2011) are slightly different from the outcome of this study. Nonetheless, it is noteworthy that the blockage of WWMs is a locality specific problem (Marlow et al. 2020) that may be difficult to generalise across different geographical areas.
Even though the cost of WWMs PM, which is predominantly cleaning operation to flush out sediments can reduce with enhanced design and methodical planning, the advantages of the proposed model for PM decisions is not in doubt as per Figure 4. The figure shows that using the model will result in 54% to 72% savings in PM cost across the financial years. On average, a 60.45% cost savings is expected using the proposed technique for PM management of the WWMs compared to the current approach that cleaned on average 62.32 Km/yr.
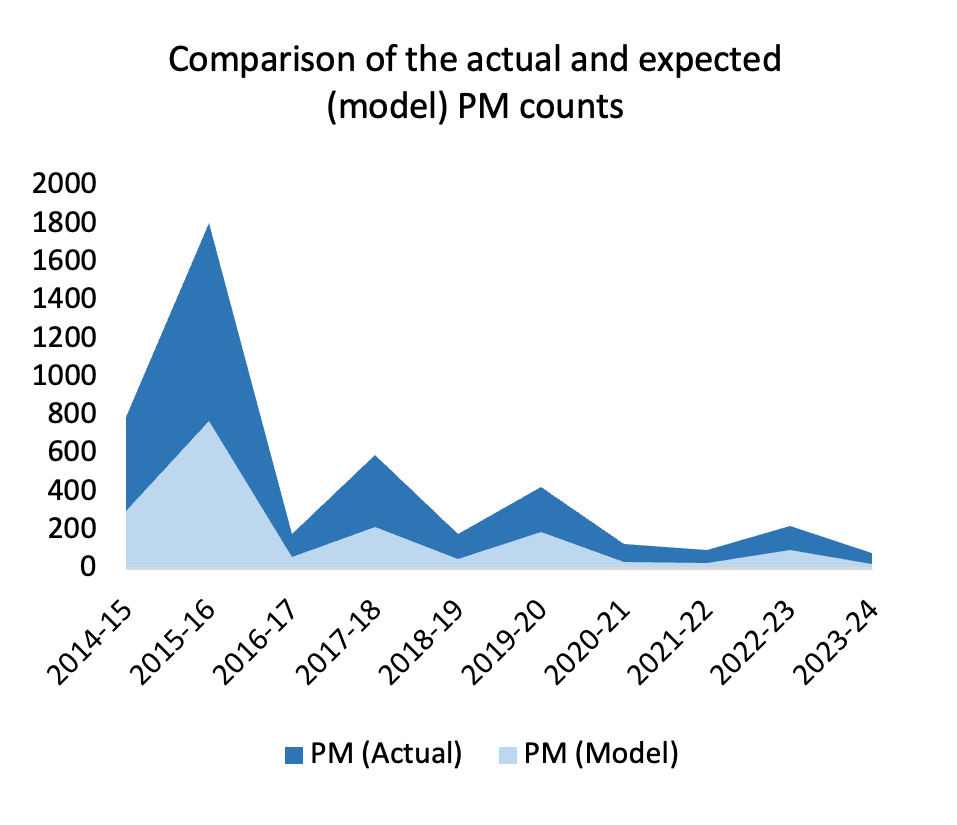
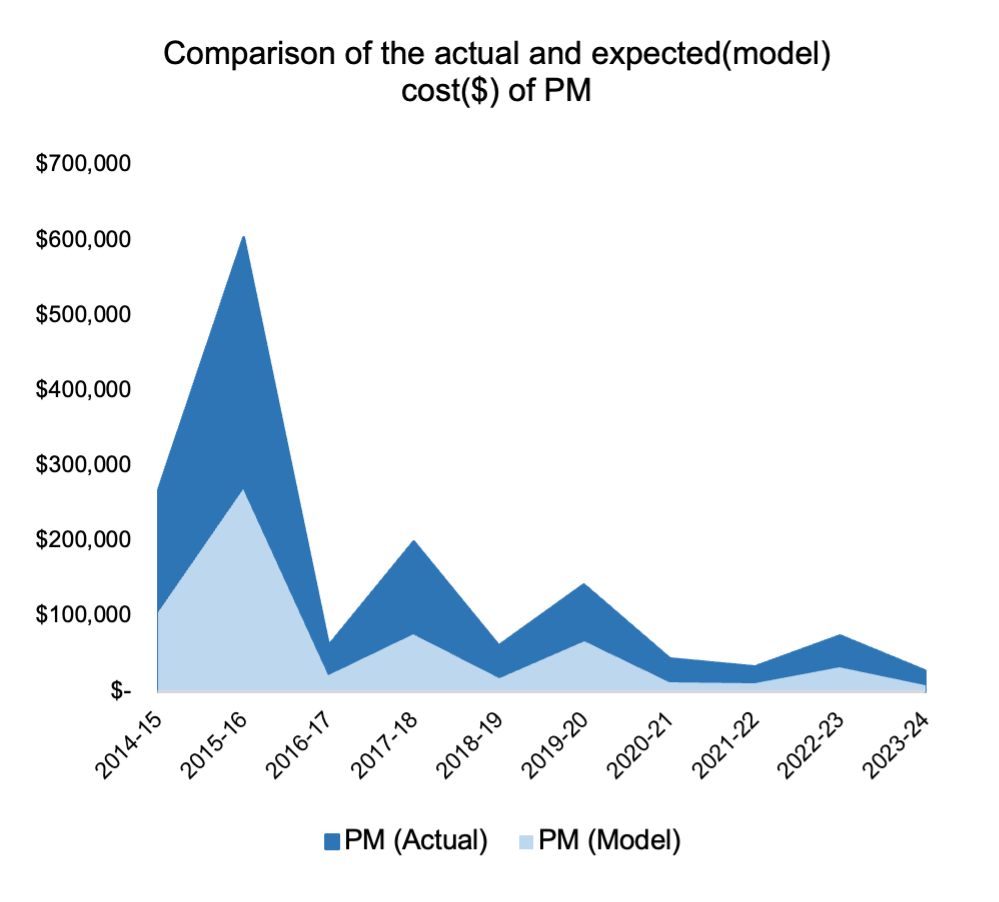
 Figure 4: Preventative Maintenance (PM) cost analysis for financial years and materials
Maintenance Management with Blockage Risk Pattern
Planning the maintenance of WWMs to forestall blockage involves prioritisation, which can be done by patterning the attributes of BRCs using ARM. This helps to augment the PM decision-making process that may also depend on ranking the PoB of WWMs.
Table 4: Top 5 rules for Very high Blockage Risk (VHBR) prioritisation in Preventative Maintenance of WWMs
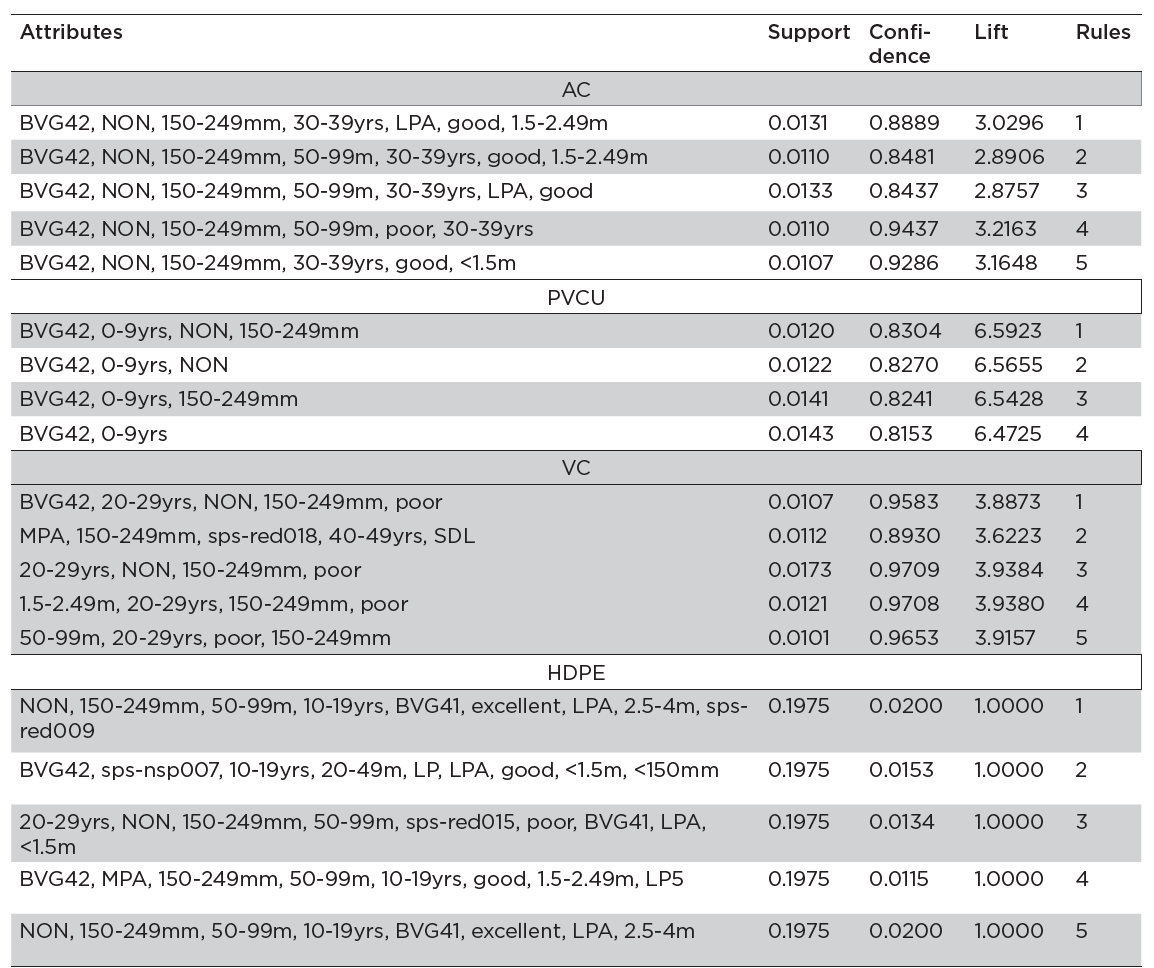
According to Table 4, which shows the top rules for prioritising PM, WWMs with the listed attributes are more susceptible to blockage than others without those attributes. WWMs made of VC material that are 20 to 49 years old have VHBR clustered in 150-249mm diameter pipes of length between 50-99m, and in poor structural integrity condition. They were mainly installed in MPA (with predominance in SPS-RED018 catchment) where soil acidity is SDL (likely to contain acid sulphate soil) and vegetation is BVG42 (nil to very low vegetation cover). Similarly, WWMs made of 150-249 mm diameter AC material that are aged between 30 to 39 years and installed at a depth of 1.5-2.49m in non-acidic soil (NON) have large proneness to VHBR. Most of these AC WWMs were installed in LPA where the vegetation type is mainly BVG42, and they are in good and poor structural integrity conditions.
WWMs made of HDPE in VHBR are mainly found in LPA where they were installed in soil with LP and no soil acidity. They are mostly made of 20 to 99 m length pipes with less than 249mm diameter. These WWMs are between 10 to 19 years in age, in excellent, good, and poor structural integrity conditions and have been installed in BVG42 and low grass or tree cover in built-up area (BVG41) vegetation types. The blockages of HDPE are predominant in SPS-RED009, SPS-NSP007, and SPS-RED015 catchments. PVCU materials at VHBR are mainly 150-249mm in diameter, aged between 0-9 years and are installed in non-acidic soils.
Conclusion
Since effective management of WWM blockage is necessary for maintaining performance and integrity of the wastewater network, this study relied on a hybrid approach for predicting blockage failure and PM strategy. XGBoost algorithm, WAFT model and ARM were used for predicting blockages, BRCs and the pattern of attributes of the BRCs to facilitate maintenance prioritisation.
After analysing historical records that span across 716.7 km of WWMs using physical, operational, and environmental attributes, the following inferences were drawn.
- The median age of blockage of WWMs is 33.2 years.
- Blockage status of WWMs were predicted to 95% accuracy and 98% ROCAUC using XGBoost algorithm.
- Blockage failure was observed to be mostly impacted by structural integrity, age, and soil.
- WWMs at VHBR block between 39% to 97% faster than those in HBR, MBR, LBR and VLBR.
- WWMs made of AC materials blocked 67% to 80% faster than VC, PVCU, and HDPE materials.
- It is expected that the PMF of WWMs will be reduced by 39% and cost of PM reduced by 60% using the developed strategy.
Despite the good outcomes of this study, there are some limitations that are noteworthy. The importance of the number of HCBs, traffic volume, weather patterns, and the sort of economic activities happening within the catchments cannot be overstated. Even though there is no certainty that the result of this analysis will differ significantly if these features are introduced, it may be worth knowing their impact on blockage. Furthermore, the behaviour of the other materials used for WWMs may need to be investigated in future studies to facilitate better management of WWMs that are not made of the four main materials considered in this study.
Even though the preliminary analysis of the strategy developed in this study shows that the operating and maintenance costs of WWMs can be lowered significantly, the full implementation and comparative analysis (with the traditional approach) will be a study for the future. This will be necessary for fully understanding the advantages of using the BRCs and material types for streamlining maintenance planning.
Acronyms

The Authors
Chinedu Ossai
Dr. Ossai is the Senior Asset Analytics Engineer at Unitywater.
Manpreet Singh
Manpreet is working as the Asset Integrity Engineer at Unitywater.
Ken Goraya
Ken is the Strategic Asset Manager at Unitywater.
References
Alshami, A., Elsayed, M., Mohandes, S.R., Kineber, A.F., Zayed, T., Alyanbaawi, A. and Hamed, M.M., 2022. Performance assessment of sewer networks under different blockage situations using Internet-of-Things-based technologies. Sustainability, 14(21), p.14036.
Ana, E.V. and Bauwens, W., 2010. Modeling the structural deterioration of urban drainage pipes: the state-of-the-art in statistical methods. Urban Water Journal, 7(1), pp.47-59.
Arthur, S., Crow, H. and Pedezert, L., 2008, August. Understanding blockage formation in combined sewer networks. In Proceedings of the Institution of Civil Engineers-Water Management (Vol. 161, No. 4, pp. 215-221). Thomas Telford Ltd.
Australian Bureau of Metrology (BOM), 2023, National Performance Report 2022-23: Number of sewer mains breaks and chokes per 100 km – A14, Available from: http://www.bom.gov.au/water/npr/docs/2022-23/Urban_National_Performance_Report_2022-23.pdf on 27/06/2024
Bailey, J., Harris, E., Keedwell, E., Djordjevic, S. and Kapelan, Z., 2016. Developing decision tree models to create a predictive blockage likelihood model for real-world wastewater networks. Procedia Engineering, 154, pp.1209-1216.
Bailey, J., Keedwell, E., Djordjevic, S., Kapelan, Z., Burton, C. and Harris, E., 2015. Predictive risk modelling of real-world wastewater network incidents. Procedia Engineering, 119, pp.1288-1298.
Caradot, N., Sonnenberg, H., Kropp, I., Ringe, A., Denhez, S., Hartmann, A. and Rouault, P., 2017. The relevance of sewer deterioration modelling to support asset management strategies. Urban Water Journal, 14(10), pp.1007-1015.
Chawla, N.V., Bowyer, K.W., Hall, L.O. and Kegelmeyer, W.P., 2002. SMOTE: synthetic minority over-sampling technique. Journal of artificial intelligence research, 16, pp.321-357.
DeSilva, D., Marlow, D., Beale, D. and Marney, D., 2011. Sewer blockage management: Australian perspective. Journal of Pipeline Systems Engineering and Practice, 2(4), pp.139-145.
Dhieb, N., Ghazzai, H., Besbes, H. and Massoud, Y., 2019, September. Extreme gradient boosting machine learning algorithm for safe auto insurance operations. In 2019 IEEE international conference on vehicular electronics and safety (ICVES) (pp. 1-5). IEEE.
Faris, N., Zayed, T., Aghdam, E., Fares, A. and Alshami, A., 2024. Real-Time sanitary sewer blockage detection system using IoT. Measurement, 226, p.114146.
Fontecha, J.E., Akhavan-Tabatabaei, R., Duque, D., Medaglia, A.L., Torres, M.N. and Rodríguez, J.P., 2016. On the preventive management of sediment-related sewer blockages: a combined maintenance and routing optimization approach. Water Science and Technology, 74(2), pp.302-308.
Jerome H. Friedman “Greedy function approximation: A gradient boosting machine.,” The Annals of Statistics, Ann. Statist. 29(5), 1189-1232, (October 2001)
Jin, Y. and Mukherjee, A., 2010. Modeling blockage failures in sewer systems to support maintenance decision making. Journal of performance of Constructed Facilities, 24(6), pp.622-633.
Liu, E., Liu, R.Y. and Lim, K., 2023. Using the Weibull accelerated failure time regression model to predict time to health events. Applied Sciences, 13(24), p.13041.
Liu, T., Ramirez-Marquez, J.E., Jagupilla, S.C. and Prigiobbe, V., 2021. Combining a statistical model with machine learning to predict groundwater flooding (or infiltration) into sewer networks. Journal of Hydrology, 603, p.126916.
Ma, B., Meng, F., Yan, G., Yan, H., Chai, B. and Song, F., 2020. Diagnostic classification of cancers using extreme gradient boosting algorithm and multi-omics data. Computers in biology and medicine, 121, p.103761.
Marlow, D.R., Boulaire, F., Beale, D.J., Grundy, C. and Moglia, M., 2011. Sewer performance reporting: factors that influence blockages. Journal of Infrastructure Systems, 17(1), pp.42-51.
Mateo Pérez, V., Mesa Fernández, J.M., Villanueva Balsera, J. and Alonso Álvarez, C., 2021. A random forest model for the prediction of FOG content in inlet wastewater from urban WWTPs. Water, 13(9), p.1237.
Nahar, J., Imam, T., Tickle, K.S. and Chen, Y.P.P., 2013. Association rule mining to detect factors which contribute to heart disease in males and females. Expert systems with applications, 40(4), pp.1086-1093.
Okwori, E., Viklander, M. and Hedström, A., 2020. Performance assessment of Swedish sewer pipe networks using pipe blockage and other associated performance indicators. h2oj, 3(1), pp.46-57.
Okwori, E., Viklander, M. and Hedström, A., 2021. Spatial heterogeneity assessment of factors affecting sewer pipe blockages and predictions. Water Research, 194, p.116934.
Ossola, A., Yu, M., Le Roux, J., Bustamante, H., Uthayakumaran, L. and Leishman, M., 2023. Research note: Integrating big data to predict tree root blockages across sewer networks. Landscape and Urban Planning, 240, p.104892.
Otsuka, T., Yamazaki, H., Ankyu, E., Ahamed, T., Anda, M. and Noguchi, R., 2020. Elucidation of the mechanism of blockage in sewer pipes by fatty acid deposition and suspended solid. Water, 12(8), p.2291.
Owolabi, T.A., Mohandes, S.R. and Zayed, T., 2022. Investigating the impact of sewer overflow on the environment: A comprehensive literature review paper. Journal of Environmental Management, 301, p.113810.
Saikia, R. and Barman, M.P., 2017. A review on accelerated failure time models. Int J Stat Syst, 12(2), pp.311-322.
Salihu, C., Hussein, M., Mohandes, S.R. and Zayed, T., 2022. Towards a comprehensive review of the deterioration factors and modeling for sewer pipelines: A hybrid of bibliometric, scientometric, and meta-analysis approach. Journal of Cleaner Production, 351, p.131460.
Tandan, M., Acharya, Y., Pokharel, S. and Timilsina, M., 2021. Discovering symptom patterns of COVID-19 patients using association rule mining. Computers in biology and medicine, 131, p.104249.
Torlay, L., Perrone-Bertolotti, M., Thomas, E. and Baciu, M., 2017. Machine learning–XGBoost analysis of language networks to classify patients with epilepsy. Brain informatics, 4, pp.159-169.
Ugarelli, R., Venkatesh, G., Brattebø, H., Di Federico, V. and Sægrov, S., 2010. Historical analysis of blockages in wastewater pipelines in Oslo and diagnosis of causative pipeline characteristics. Urban Water Journal, 7(6), pp.335-343.
Yusuf, H.H., Roddick, F., Jegatheesan, V., Gao, L. and Pramanik, B.K., 2023. Tackling fat, oil, and grease (FOG) build-up in sewers: Insights into deposit formation and sustainable in-sewer management techniques. Science of the Total Environment, p.166761.
Zaman, H., Bouferguène, A., Al-Hussein, M., Lorentz, C. and Melmoth, D., 2013. Estimation of flushing duration for preventive maintenance of wastewater collection system. In Proc., Annual CSCE Conf., Canadian Society for Civil Engineering, Montréal.
Zhao, Z., Yang, W., Zhai, Y., Liang, Y. and Zhao, Y., 2022. Identify DNA-binding proteins through the extreme gradient boosting algorithm. Frontiers in Genetics, 12, p.821996.
Share