Nutrient Recovery From High-Strength Anaerobic Digester Digestate Through Pilotscale Electrodialysis
Abstract
Electrodialysis (ED) is an emerging electrochemical membrane process capable of concentrating and separating nutrient ions from wastewater. Nutrient recovery performance utilising an ED process was quantified in a pilot reactor utilising domestic anaerobic digester digestate supernatant (centrate), with a power consumption of 4.9 kWh/kg NH4-N recovered. Current results demonstrate the use of electrodialysis as a viable method for the collection and concentration of valuable nutrients from nutrient-rich digestates and wastewaters. Further, experimental plant growth trials were completed, and the results demonstrated that ED concentrate products could replace commercial urea fertilisers.
Introduction
Water utilities have achieved significant milestones in energy recovery from wastewater via anaerobic digestion and co-digestion. Advances in treatment, energy efficiency and capital costs have also been made via new processes, such as nitrate shunt and anammox. However, water utilities, like Urban Utilities, continue to seek new technology to enhance their circular economy approach to wastewater treatment. Most current wastewater treatment processes, such as anammox and waste-activated sludge system, do not recover nitrogen, but are based on destructive treatment. To date, minimal work has been undertaken to address the recovery of nitrogen and other nutrients, such as potassium. Nutrient recovery from wastewater via an electrochemical process can play an important role in achieving circular economy goals.
ED is an emerging electrochemical membrane process capable of concentrating and separating ions from wastewater (Thompson Brewster., 2016, 2017a, 2017b). ED processes utilise an alternating series of cation exchange membranes (CEMs) and anion exchange membranes (AEMs), placed between the terminal anode and cathode. Applied current generates an internal potential gradient used to concentrate or dilute ions from an aqueous solution through ion migration (Thompson Brewster et al., 2016, Arola et al. 2019) (see Figure 1).
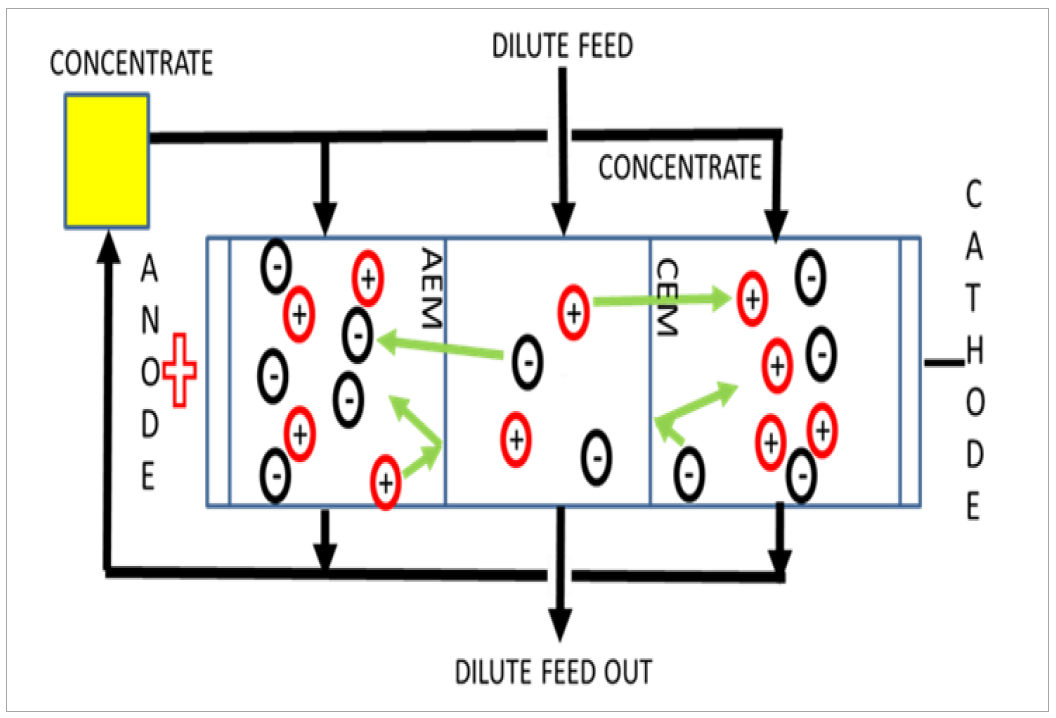 Figure 1: Schematic of ion migration in an active ED cell
Traditional ED has been utilised in applications such as brackish water desalination, table salt production, and industrial process water demineralisation (Ward et al 2018).
A dominant aspect driving the practical feasibility of ED technologies is power consumption. Different NH4-N treatment and recovery technologies have a large variation in energy requirements. Power consumption for the removal of NH4-N by conventional sludge-based nitrification and denitrification treatment processes ranges from approximately 6.18 – 13.6 kWh/kg NH4-N treated (Xie et al., 2016). The anammox treatment process is lower with estimates of 1.50 - 5.02 kWh/kg NH4-N treated (Schaubroeck et al., 2015). ED is more practical for nutrient removal at high concentrations than for full wastewater treatment, but recovered nitrogen is a valuable product, and nitrogen removal from centrate reduces overall plant load. The recovery and concentration of NH4-N by other technologies such as NH4-N stripping with air and acid absorption for (NH4)2SO4 production uses 25kWh/kg NH4-N (Maurer et al., 2003). Commercial N-production fixing NH3 from atmospheric nitrogen (Haber-Bosch process, dominant for nitrogen manufacturing) ranges from 10.3 kWh/kg utilising natural gas to 12.5 kWh/kg NH4-N using oil (Maurer et al., 2003). Another promising N recovery process is membrane capacitive deionisation (MCDI), however recent studies have pointed out that this is more feasible on wastewaters with concentrations of <100 mg/L NH4-N, making it more suitable for desalination rather than nutrient recovery (Wang et al., 2022). Energy consumption below 10 kWh/kg NH4-N is necessary for ED to compete as a potential alternative for the Haber-Bosch process (though recovery from wastewater also offsets treatment energy costs).
Therefore, the aim of this study was to assess the production of a concentrated nutrient fertiliser from anaerobically digester digestate/centrate and its associated energy consumption. Then ED produced nutrient-rich concentrate product was investigated in plant growth trials to determine the suitability of the ED concentrate product as a nitrogen replacement for commercial urea-based fertilisers.
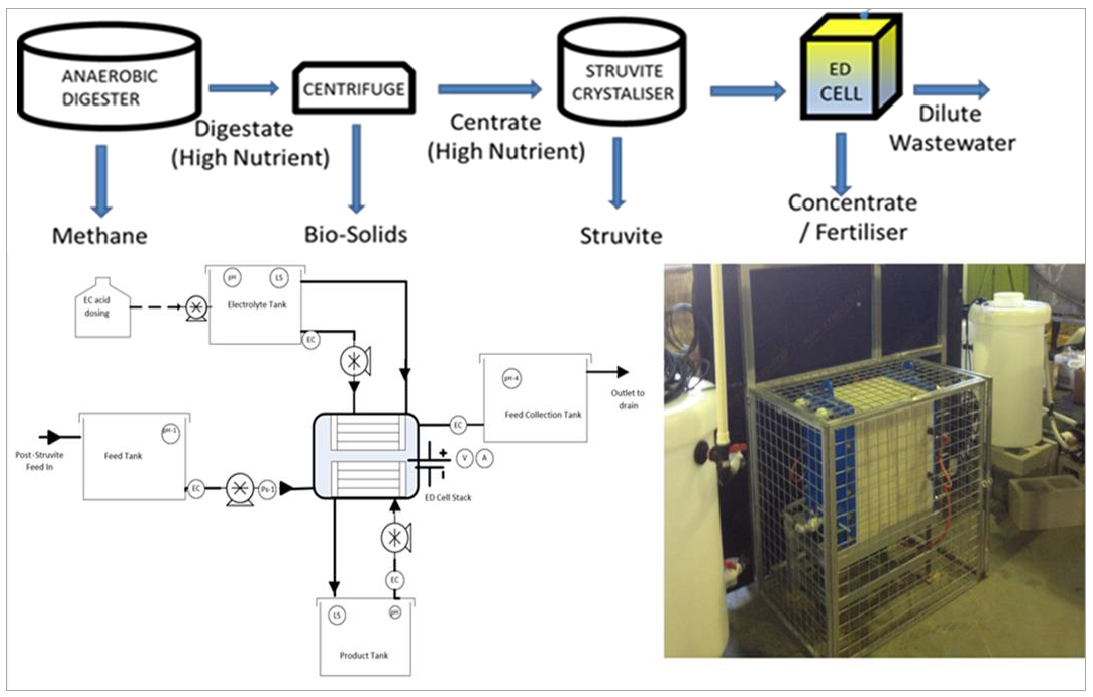
Figure 2: Process diagram and pilot P&ID schematic of the ED cell recovery system
Methodology/Process
Feed water for this experiment consisted of centrate at the Luggage Point Resource Recovery Centre (RRC) in Brisbane, Australia. The centrate was pre-treated by a struvite crystalliser system to precipitate phosphorus as struvite (MgNH4PO4. 6H2O). Post-crystallised centrate was used in the ED cell system (see Figure 2). A 30-cell pair pilot scale ED unit with 7.2 m2 total system membrane area was utilised for this experimental work. The unit was equipped with 31 cation exchange membrane (General Electric CR67) and 30 anion exchange membrane (General Electric AR204SZRA) and Ti/PtIrO2 electrodes used as the anode and cathode.
High-density polyethylene tanks were used for the one pass dilute feed, and recirculated electrolyte rinse solution and recirculated concentrate product stream. A process logic controller was employed to control, operate and log operational data from the pilot ED cell system. The process diagram and pilot P&ID schematic of the system is shown in Figure 2.
The pilot scale ED reactor was operated at 2 mA/cm2 which equated to approximately 60-80% of the ohmic region prior to the limiting current density region (3.2 mA/cm2) (see Figure 3).
After 3.2 mA/cm2 (plateau region) water splitting occurs on the membranes. This is associated with increased resistance due to concentration polarisation or depletion of ions in the boundary layer of the membrane. Therefore 2mA/cm2 was considered as an ideal current density for efficient cell operation. Peristaltic pumps at a flow rate of 1250 mL/min (75 L/h) were used to pump feed, electrolyte and concentrate through the ED system. This flow rate was used due to ED being dependent on a relatively high solution electrical conductivity, and as ions are recovered, electrical conductivity drops, increasing cell resistance requiring increased voltage. Due to this, the flow rate of 75 L/h allowed a removal rate of approximately 25% of NH4-N from the feed solution. Sampling was undertaken four times during the 72-hour experimental period and analysed for anions and cations. After 72 hours of operation, the ED cell was cleaned by draining the feed and concentrate cells and recirculating 0.5% sodium hypochlorite solution through the ED cell for approximately two hours. The ED cell was drained again and flushed with water before a 1% HCl acid solution was recirculated through the ED cell. The Ed cell was then flushed with clean potable water before starting the next replicate run.
An experiment growth trial was conducted to evaluate the effect of liquid concentrate derived from electrodialysis unit on growth of Sorghum at The University of Queensland, St Lucia, Australia. The liquid concentrate was compared with liquid urea. Potting mix (University of California potting mix) was used. Total number of treatments were 10, and there were four replicates per treatment. Treatments 1 – 3: Three N application rate (50, 100 and 200 kg-N ha-1) of liquid urea, 4 – 6: Three N application rate (50, 100 and 200 kg-N ha-1) of the ED concentrate, 7 – 9: Three N application rate (50, 100 and 200 kg-N ha-1) using 50% ED concentrate and 50% urea as mineral fertiliser and 10: Control, no N was applied (see Table 2). The experiment was run for 47 days after planting. Plant height was measured on a weekly basis and dry biomass and nutrient concentration at the end of the experimental period.
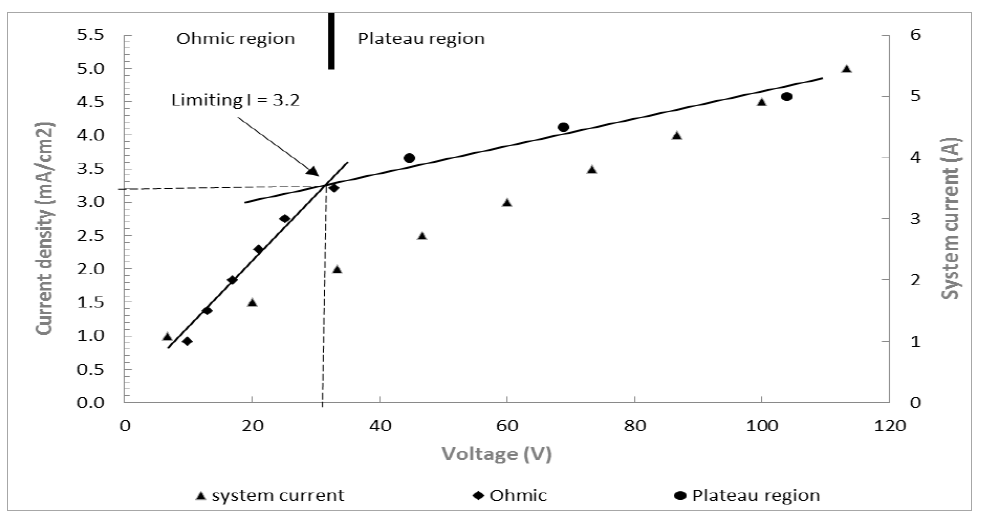
Figure 3: Current-voltage plot showing the system current (A), limiting current density (ilim) (mA/cm2) and the presence of the ohmic and plateau regions. The limiting current density was determined by the intersection of the two slopes belonging to the ohmic and the plateau regions.
Results/Discussion
For all three replicates, cation concentrations increased over the experimental period of 72 h. The maximum concentration of NH4-N and K achieved was 7.1 ± 0.2 g/L and 2.5 ± 0.1 g/L, respectively. Table 1 shows the concentration of cations in the raw centrate feed, post struvite pre-treatment and final ED concentrated product. The transport of ions across the membranes (flux density) of all major cations appeared to decrease over the experimental period, but further statistical analysis indicated no significant reduction in flux density over the time period (p>0.05) (Figure 4).
The results from this showed that the ED cell flux density returned to its original flux and starting voltage, indicating the struvite pre-treatment and cleaning process was successful at eliminating excessive membrane fouling and scaling during operation. Phosphorous-rich struvite was also recovered as part of the struvite pre-treatment process (approximately 60% recovery) (see Table 1).
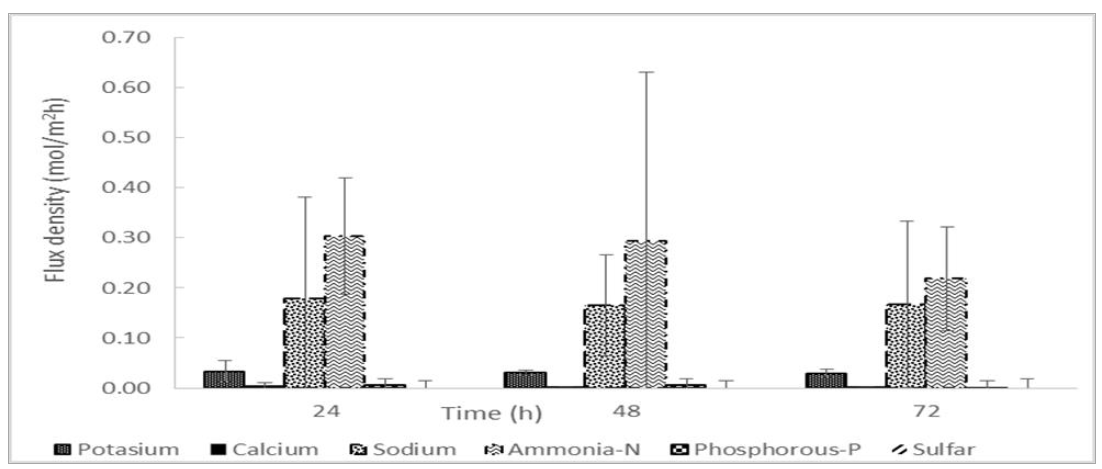
Figure 4: The ionic flux density (Ji, mol/m2h) between the 24, 48 and 72-hour individual sampling periods
Mean current efficiency for ion transport was 76 ± 2% and a power consumption of 4.9 ± 1.5 kWh/kg NH4-N was calculated from the experimental results. This is well under previous results and estimates for nutrient recovery by ED in literature.
Results from the growth trial using Sorghum are shown in Figures 5 and 6. The growth trial confirmed both urea and ED concentrate caused significant growth increases relative to the control. Overall, no significant difference in plant height, dry biomass and nutrient concentration was observed between ED concentrate and liquid urea trials (see Table 3), indicating ED concentrate is an effective replacement.
| mg/L | K | Mg | Na | P | Ca | NH4-N |
| Centrate | 231 ± 8 | 23 ± 3 | 437 ± 100 | 162 ± 67 | 35 ± 6 | 847 ± 391 |
| ED dilute feed | 232 ± 4 | 1 ± 2 | 1003 ± 333 | 58 ± 46 | 25 ± 4 | 835 ± 267 |
| ED concentrate | 2466 ± 2 | 0.34 ± 0.1 | 8106 ± 3438 | 408 ± 291 | 24 ± 76 | 7100 ± 2022 |
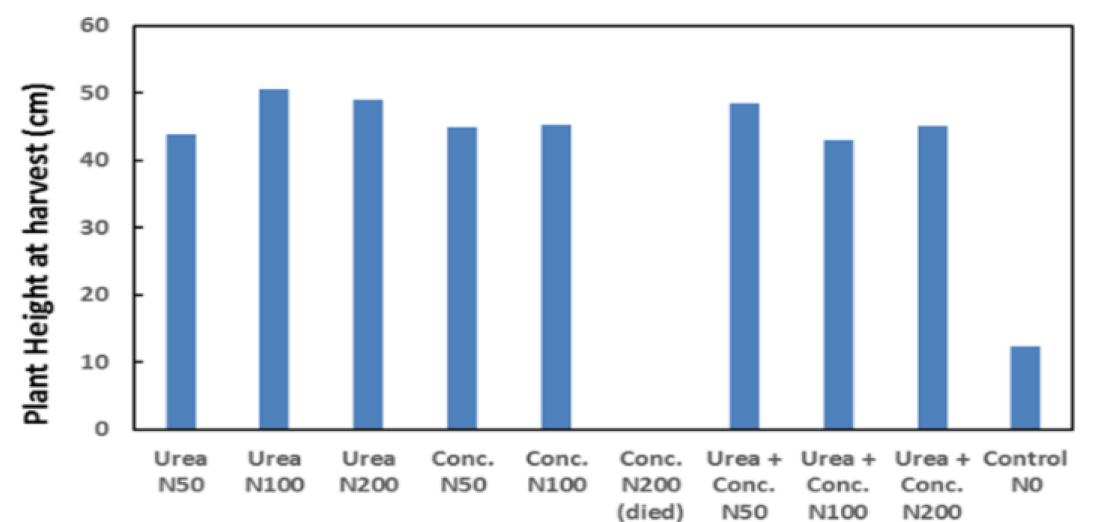
Figure 5: Sorghum growth rate (height vs time) for liquid urea and concentrate at application rate
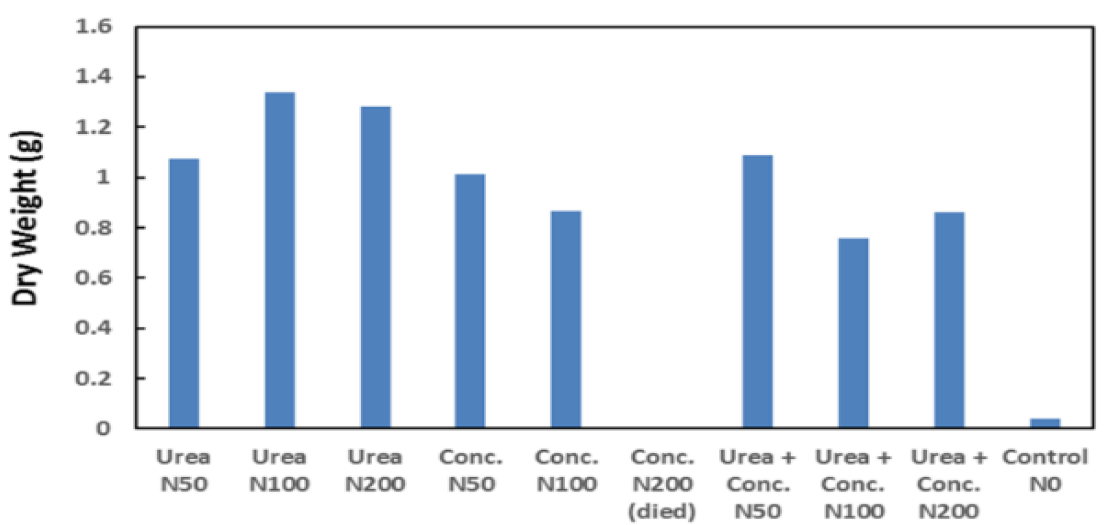
Figure 6: Sorghum dry weight for liquid urea concentrate at application rate
| Treatment | Commercial Urea application (kg-N ha-1) | ED concentrate application (kg-N ha-1) |
| 1 | 50 | 0 |
| 2 | 100 | 0 |
| 3 | 200 | 0 |
| 4 | 0 | 50 |
| 5 | 0 | 100 |
| 6 | 0 | 200 |
| 7 | 25 | 25 |
| 8 | 50 | 50 |
| 9 | 100 | 100 |
| 10 | 0 (control) | 0 (control) |
However, at the ED concentrate product dose rate of 100 kg-N ha-1 decreased growth was noted, and at 200 kg-N ha-1 all plants died during the trial. This is believed to be associated with a high sodium concentration. The high sodium concentration resulted from the struvite process where sodium hydroxide was used to raise the pH for struvite crystal formation. The use of this chemical in this process added additional sodium to the ED cell feed water. This issue can be eliminated in the future by changing the chemicals in the struvite system to magnesium hydroxide rather than magnesium sulphate and sodium hydroxide, hence eliminating additional sodium from the struvite process (Batstone et al. 2015).
| g kg-1 | N | K | P |
| Urea N50 | 17.1 | 28.5 | 5.1 |
| Urea N100 | 28.4 | 32.9 | 4.2 |
| Urea N200 | 38.9 | 30.4 | 4.4 |
| Conc. N50 | 29.1 | 35.7 | 6.4 |
| Conc. N100 | 40.3 | 38.8 | 6.1 |
| Conc. N200 (died) | - | - | - |
| Urea + Conc. N50 | 26.3 | 33.4 | 5.8 |
| Urea + Conc. N100 | 38.2 | 36.3 | 4.2 |
| Urea + Conc. N200 | 46.0 | 35.9 | 4.6 |
| Control | 14.5 | 30.7 | 5.6 |
Conclusion
The feasibility of ED for nutrient concentration and recovery from municipal wastewater was demonstrated in this work. The achievable concentration factor of approximately eight times was reported for NH4-N. Power consumption by the ED process was calculated at 4.9 ± 1.5 kWh/kg NH4-N. This makes the process economically competitive for nitrogen removal by advanced destructive technologies, such as anammox (2-5 kWh kg NH4-N), and advantageous for nitrogen production versus manufacturing by the Haber-Bosch process (11 kWh kg NH4-N). Results from the plant trial indicated ED concentrate is an effective urea fertilser replacement.
Acknowledgements
This research was financially supported by the Grain Research & Development Corporation (GRDC) under the project UQ00061 Fertiliser from Waste Phase II. The authors also thank the facilities and the scientific and technical assistance of the Analytical Services Laboratory at the Australian Centre for Water and Environmental Biotechnology, The University of Queensland. Urban Utilities is also acknowledged for their supply of wastewater and facilities at the Innovation Centre, which houses both the struvite and pilot ED systems.
References
Arola, K., Ward, A.J, Mänttäri, M., Kallioinen, M., and Batstone, D.J. (2019) Transport of pharmaceuticals electrodialysis during treatment of wastewater. Water Research 161 496-504.
Batstone, D.J., Hulsen, T. Mehta, C., Keller, J. 2015. Platforms for energy and nutrient recovery from domestic wastewater: A review. Chemosphere 140: 2-11.
Maurer, M., Sckwegler, P., Larsen, T. 2003. Nutrients in urine: Energetic aspects of removal and recovery. Water Science and Technology 48, 37-46.
Schaubroeck, T., De Clippeleir, H., Weissenbacher, N., Dewulf, J., Boeckx, P., Vlaeminck, S.E. and Wett, B. 2015. Environmental sustainability of an energy self-sufficient sewage treatment plant: Improvements through DEMON and co-digestion. Water Research 71, 166-179.
Thompson Brewster, E., Mehta, C.M., Radjenovic, J., Batstone, 2016, A mechanistic model for the electrochemical nutrient recovery systems. Water Research 94, 176-186.
Thompson Brewster, E., Ward, A.J., Mehta, C.M., Radjenovic, J., Batstone, D.J. 2017a. Predicting scale formation during electrodialytic nutrient recovery. Water Research 110, 202-210.
Thompson Brewster, E., Jermakka, J., Freguia, S., Batstone, D.J. 2017b. Modelling recovery of ammonium from urine by electro-concentration in a 3-chamber cell. Water Research 124, 210-218.
Wang, Q., Fang, K., He, C., Wang, K. 2022. Ammonia removal from municipal wastewater via membrane capactitive deionisation (MCDI) in pilot sclae. Seraration and Purification Technology 286: 120469.
Ward, A.J., Arola, K., Thompson Brewster, E., Mehta, C.M., and Batstone, D.J. (2018). Nutrient recovery from wastewater through pilot scale electrodialysis. Water Research 135 57-65.
Xie, M., Shon, H.K., Gray, S.R., Elimelech, M. 2016. Membrane-based processes for wastewater nutrient recovery: technology, challengers, and future direction. Water Research 89, 210-221
